Powertrain Blockset
AIM
Understanding Powertrain Blockset in MATLAB
OBJECTIVE-1`to`What is the difference between mapped and dynamic model of engine, motor and generator? How can you change model type?
OBJECTIVE-2 `to`How does the model calculate miles per gallon? Which factors are considered to model fuel flow?
OBJECTIVE-3 `to`Run the HEV ReferenceApplication with WOT drive cycle. Change the grade and wind velocity in the environment block. Comment on the results.
OBJECTIVE-4 `to`Keeping all other parameters same, compare the simulated results of hybrid and pure electric powertrains.
PRE-REQUSITES
MATHWORKS - the leading developer of mathematical computing software.
MATLAB - the language of technical computing, is a programming environment for algorithm development, data analysis, visualization, and numeric computation.
SIMULINK - a graphical environment for simulation and Model-Based Design for multidomain dynamic and embedded systems.
SIMSCAPE DRIVELINE - provides component libraries for modeling and simulating rotational and translational mechanical systems. It includes models of worm gears, lead screws, and vehicle components such as engines, tires, transmissions, and torque converters
MATLAB from Mathworks introduced a blockest called as POWERTRAIN for designing and simulation of automotive and control engineering. It provides a library of automotive components as well as pre-assembled engine dynamometer and complete vehicle models for fast desktop simulation and real-time HIL (Hardware-in-the-loop ) testing. It includes a component library for simulating engine subsystems, transmission assemblies, traction motors, battery packs, and controller models. Powertrain Blockset also includes a dynamometer model for virtual testing.
HOW TO USE THIS POWERTRAIN BLOCKSET ? - The Powertrain blockset is built on simulink platform. The pre-built vehicle models in this blockset can be used for study, research or can be integrated with the Simscape Driveline. They will start with one of the pre-built vehicle models from Powertrain Blockset, then customize the underlying subsystems with Simscape. This can include replacing the default driveline subsystems with one of their own models developed with Simscape Driveline. The two products can be used together in order to take advantage of Powertrain Blockset’s closed-loop vehicle models and Simscape’s customizeability.
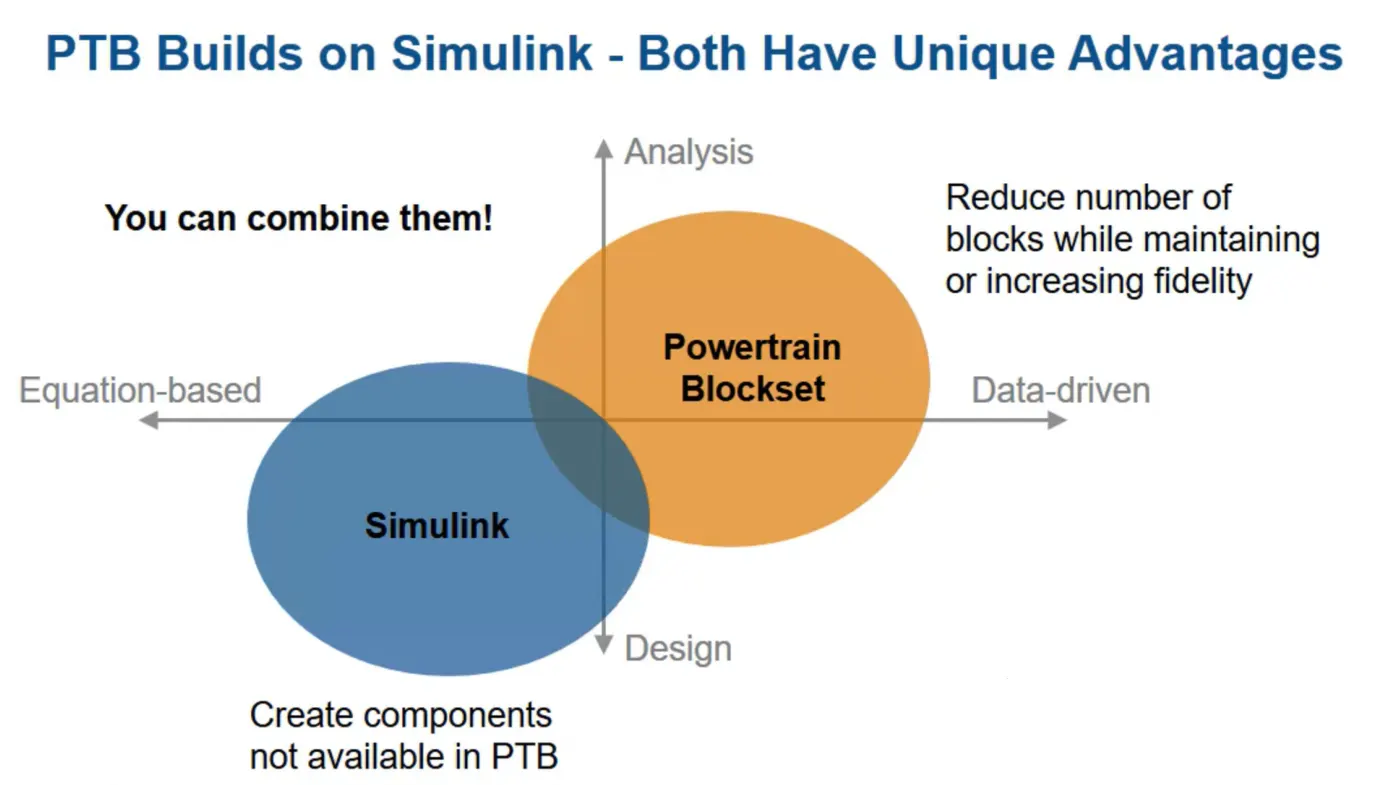
From the figure below it is clear that the simulink is mostly used for design purpose and is configured based on equations. On the other hand, powertrain blockset is mainly for analysis and it require data to work on. Also even if we some of the components if not present in the powertrain blockset (PTB), can be designed in simulink. That is why powertrain blockset is best compatible on simulink platform
OBJECTIVE-1`to`What is the difference between mapped and dynamic model of engine, motor and generator? How can you change model type?
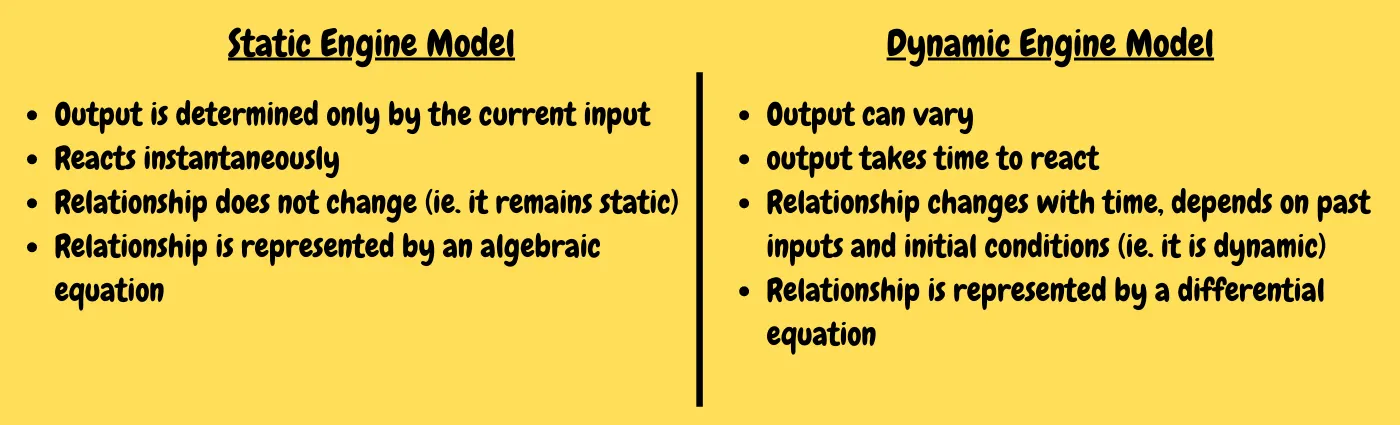
Powertrain Blockset provides two types of combustion engine models:
- Mapped Engine Models
- Dynamic Engine Models
Mapped Engine Models - Initially, when there was no ECU, the accelerator pedal was directly & physically connected to the engine via a mechanical cable. The more the pedal is pushed the more the throttle is, letting more air-fuel to into the engine, which drove more power from the engine via increased combustion. It was simple, but had its own limitations.
Now the amount of travel in the accelerator pedal is measured electronically and read by the Electronic Control Unit (ECU). The ECU takes in lots of other inputs from the car and works out exactly how to manage the combustion part of the engine and ultimately the power output. It works all this out via engine maps. Engine maps are essentially a bunch of data tables in which the ECU looks up what's going on with the car and driver inputs and finds out what it is supposed to do with the engine. Hence i ca say as per the need of simulation, these data tables can be termed as lookup tables. Lookup table blocks use arrays of data to map input values to output values, approximating mathematical functions.

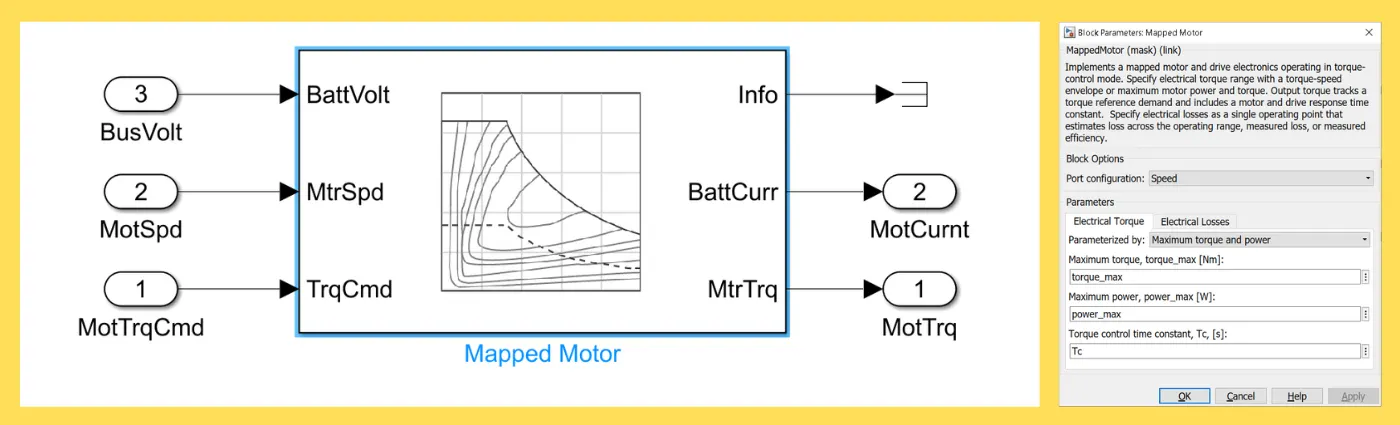
EX:- The below shown is from the reference application of pure EV from the powertrain blockset. This block act as a motor and generator during regenerative braking. This block is mapped. That means the output is determines only by the current input and the software looks up in the lookup tables and gives the required output. You can see the output obtained will be very much instantaneous. Like of you give 2v as input to the motor, and it is programmed to give 10rad/sec as the output speed. This is going to be same all the time.
DYNAMIC ENGINE MODEL - Here the output takes time to react, because it is like the system has to check into individual system compents and then come at a desirable output.
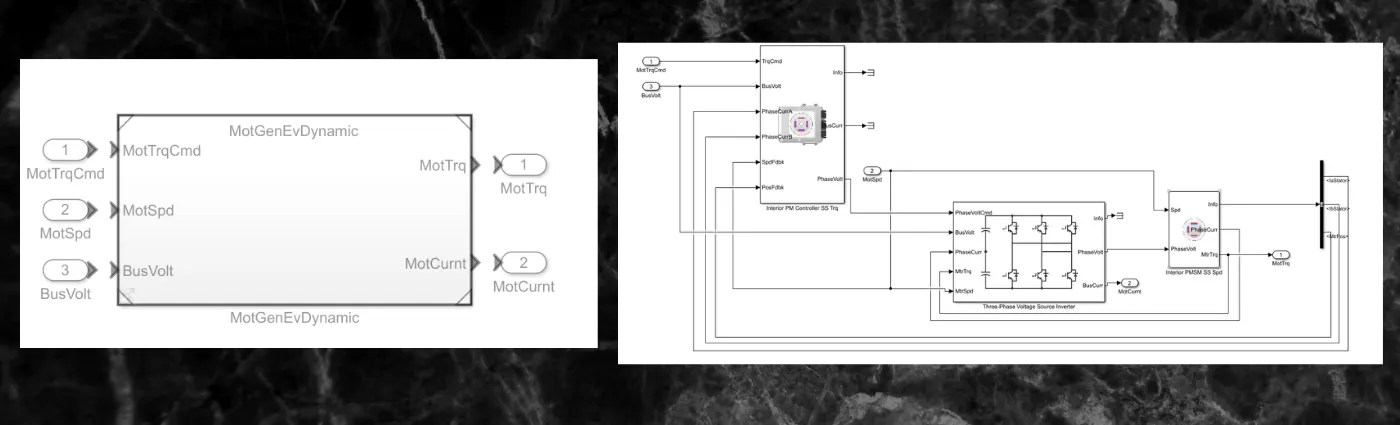
EX:- In teh above motor case, suppose the input given is 2v. Then the output is not necessary to be 10 rad/sec. It can vary because here the motor's speed can depend on the timing of input applied. Like , at what time the 2v is applied?, was the motor already in motion while applying input? or was it loaded? etc...
In the below figure we have the dynamic motor system ehich uses a permenent magnet controller and an inverter to act for regenerative braking. You ca see the output is again fed back to the input section. This was not there in mapped motor.
HOW TO CHANGE THE MODEL TYPE?
- Frst the type of powertrain blockset is selected (ie. pure EV, hybrid vehicle etc)
- Here i have selected the pure EV type. The passenger block is selected.Followed by electric plant, then the EV plant/ generator block is selected.
- Right click on the white space of the simulink platform`to`variant `to` label mode active choice `to` MotorgenEV mapped or dynamic.
REFERENCE
https://www.youtube.com/watch?v=1cr4uIzkD0k&t=23s
------------------------------------------------------------------------------------------------------------------------------------------------------------------------------------------------------------------------------------------------------------------------------------------------------------------------------------------------------------------------------------------------------------------------------------------------------------------------------------------------------------------------------------------------------------------------------------------------------------------------------------------------------------------------------------------------------------------------------
OBJECTIVE-2 `to`How does the model calculate miles per gallon? Which factors are considered to model fuel flow?
NOTE:- Before getting into the answer, i have to answer a term called FUEL ECONOMY.
What is Fuel Economy? It is the relationship between the distance travelled by the vehicle and the amount of fuel consumed. Since fuel consumption of vehicles is a significant factor in air pollution, and since importation of motor fuel can be a large part of a nation's foreign trade, many countries impose requirements for fuel economy. Different methods are used to approximate the actual performance of the vehicle.
Electric cars do not directly burn fuel, so we can't directly define the fuel economy for the EV based on the battery power consumption. Hence we can express it as an equavalent to gasoline engine's fuel economy. Fuel Economy can be expressed in two ways, but both are just same as per the nomenclature (ie. Units of fuel per fixed distance or Units of distance per fixed fuel unit)

How is Miles Per Gallon calculated?
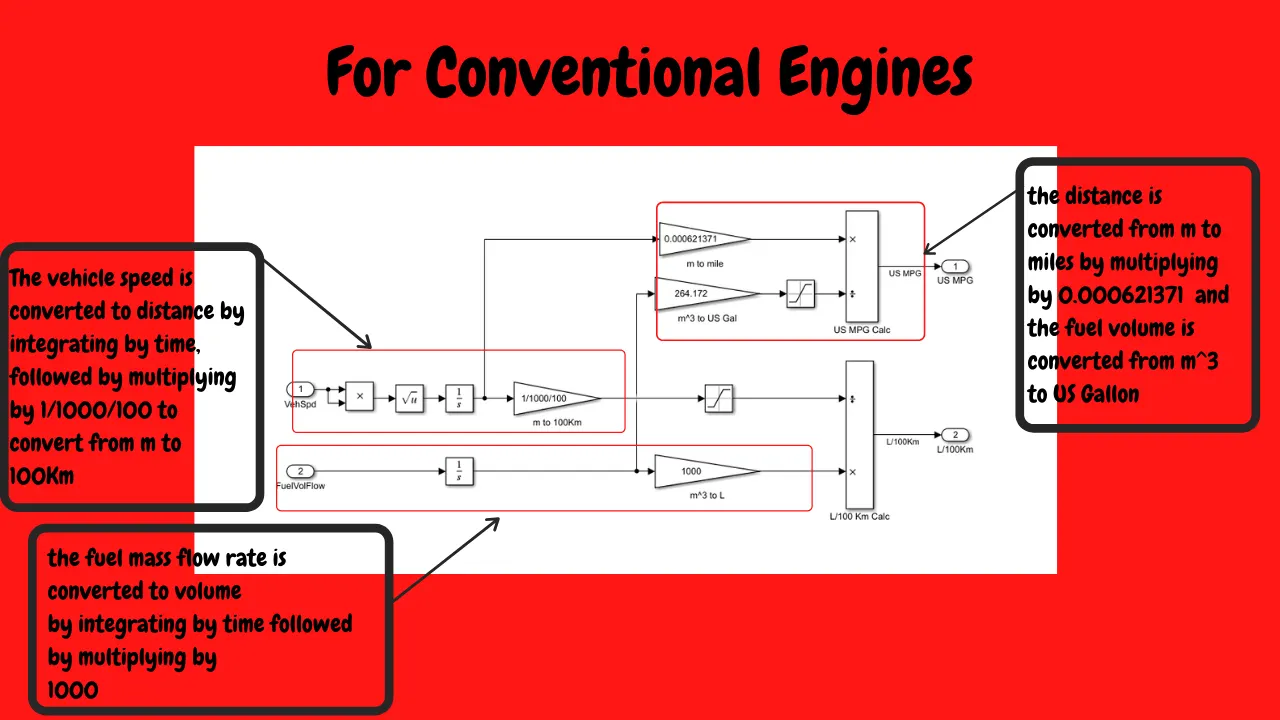
- For the conventional gasoline vehicles - the vehicle distance (m) travelled is converted to miles and the fuel volume (`m^3`) is converted to US Gallons. Both these results are then divided to get US MPG. Also the L/100Km is also calculated.
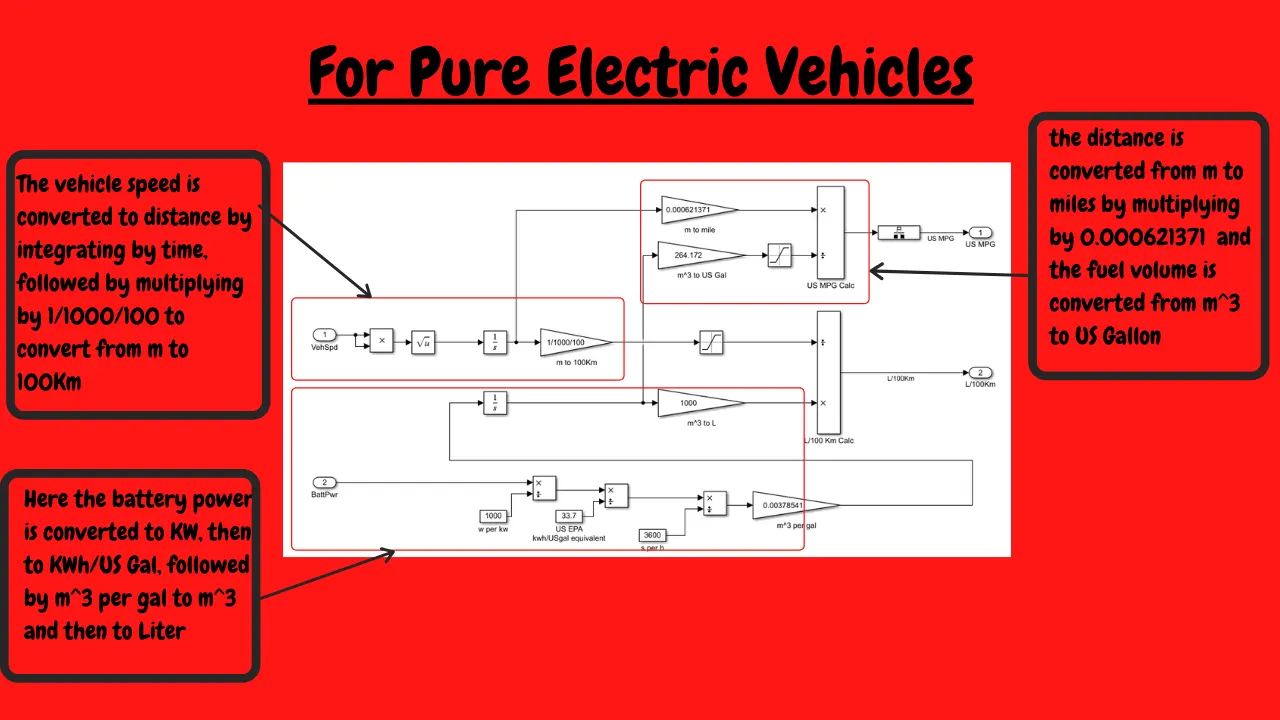
- For pure EV - US MPG calculation is same as for conventional. But for L/100Km caculation there is no gasoline fuel used. So the fuel volume (in L) calculation is done from the battery power.
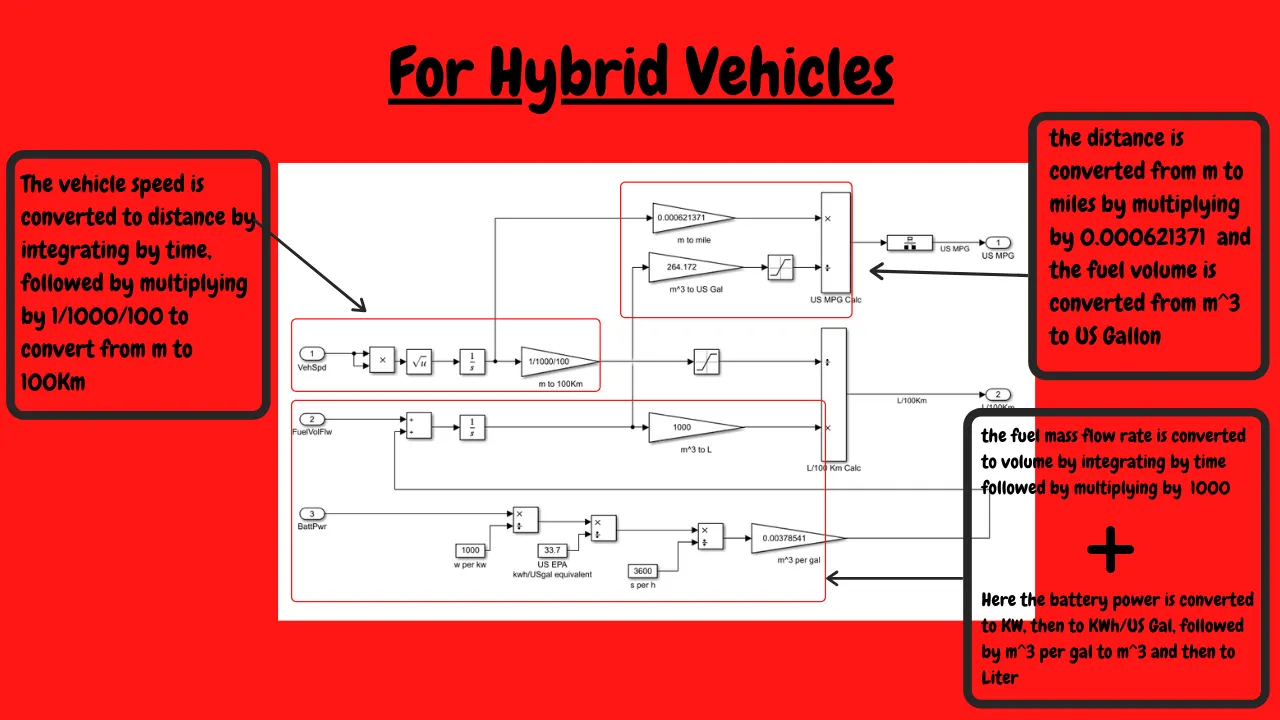
- For Hybrid Vehicles - Here the US MPG calculation is same as above. But the L/100Km is calculated by summation of gasolie fuel volume in L when run in gasoline and the volume in L when run in battery.
What are the factors considered to model fuel flow?
The only factors considered while modelling the fluid flow are fuel consumprtion and fuel economy. I have discussed the the fuel economy in detail in the previous section. Now when it comes to fuel consumption, it depends on the type of reference model. For example in conventional and hybrid models, we have to consider the fuel as a physical quantity and calculate its volume from the mass flow rate by integrating wth the time interval. When it comes to pure EV model, we have to consiter the batteries electrical energy as the source of fuel. The batteries power is is converted to energy (KWhr) per gallons of gasoline fuel equivalent, then to the repective volumetric form.
------------------------------------------------------------------------------------------------------------------------------------------------------------------------------------------------------------------------------------------------------------------------------------------------------------------------------------------------------------------------------------------------------------------------------------------------------------------------------------------------------------------------------------------------------------------------------------------------------------------------------------------------------------------------------------------------------------------------------
OBJECTIVE-3 `to`Run the HEV Reference Application with WOT drive cycle. Change the grade and wind velocity in the environment block. Comment on the results.
NOTE:- In Powertrain blockset, we have two types of hybrid vehicle model's:- HEV using multimode reference application and HEV using input power-split reference application. These two are classified based on the arrangement of transmission.
A multimode or dedicated hybrid transmission (DHT) is where the electric motor is added to a conventional automatic transmission.A general property of DHT's is that the electric motor is indispensable for the operation of the overall powertrain. Some vehicle manufacturers already offer DHTs, (e.g., the Toyota with the 4th generation of the Prius, GM with the ‘Voltec’ system, or Mitsubishi with the multimode transmission.
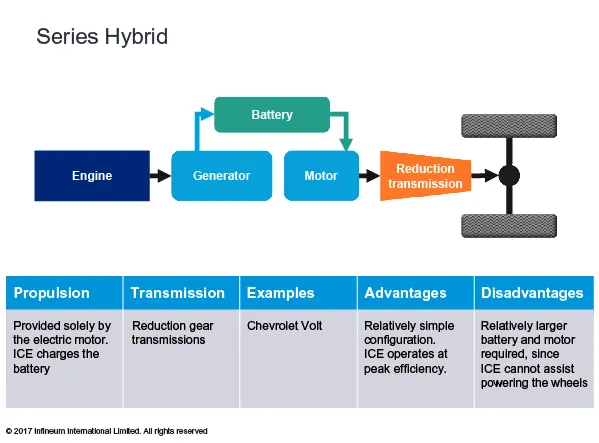
Common powertrain configuarations are - Series, Parallel, and Power-Split configurations. For this reason, special transmission concepts have been developed, which enables the switching of the operation mode of the powertrain. Each operation mode conforms one of the common powertrain configurations and the capability of switching them during the vehicle operation will combine the advantages of the available powertrain configurations.
1. Series Hybrid Configuration
2. Parallel Hybrid Configuration
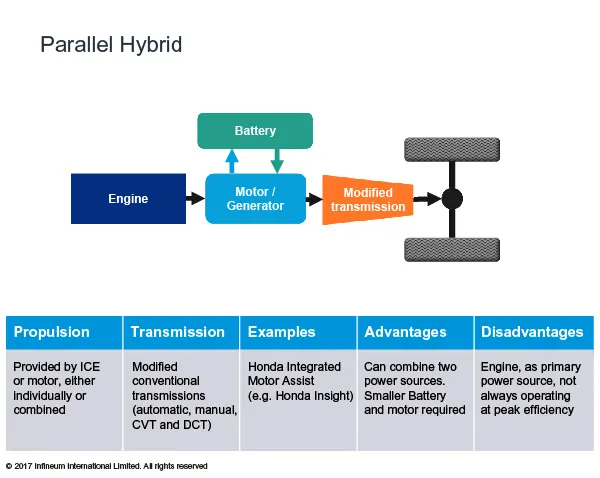
3. Power split hybrids - combine the best aspects of both series and parallel hybrids to create an extremely efficient system. This system divides the engine power along two paths: one goes to the generator to produce electricity and one goes through a mechanical gear system to drive the wheels. .The series path is generally avoided because it is less efficient. The main additional feature is that the engine, generator and motor speeds are decoupled, allowing additional freedom in control.
The most common configuration, called an input split is composed of a power split device (transmission), two electric machines (MOTOR & GENERATOR) and an engine.
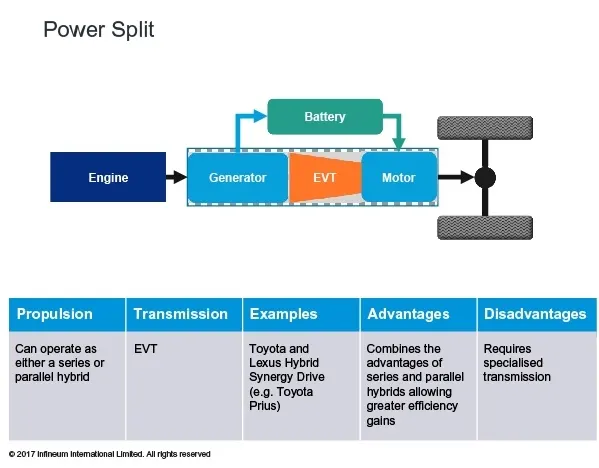
Common powertrain configuarations are - Series, Parallel, and Power-Split configurations. For this reason, special transmission concepts have been developed, which enables the switching of the operation mode of the powertrain. Each operation mode conforms one of the common powertrain configurations and the capability of switching them during the vehicle operation will combine the advantages of the available powertrain configurations.
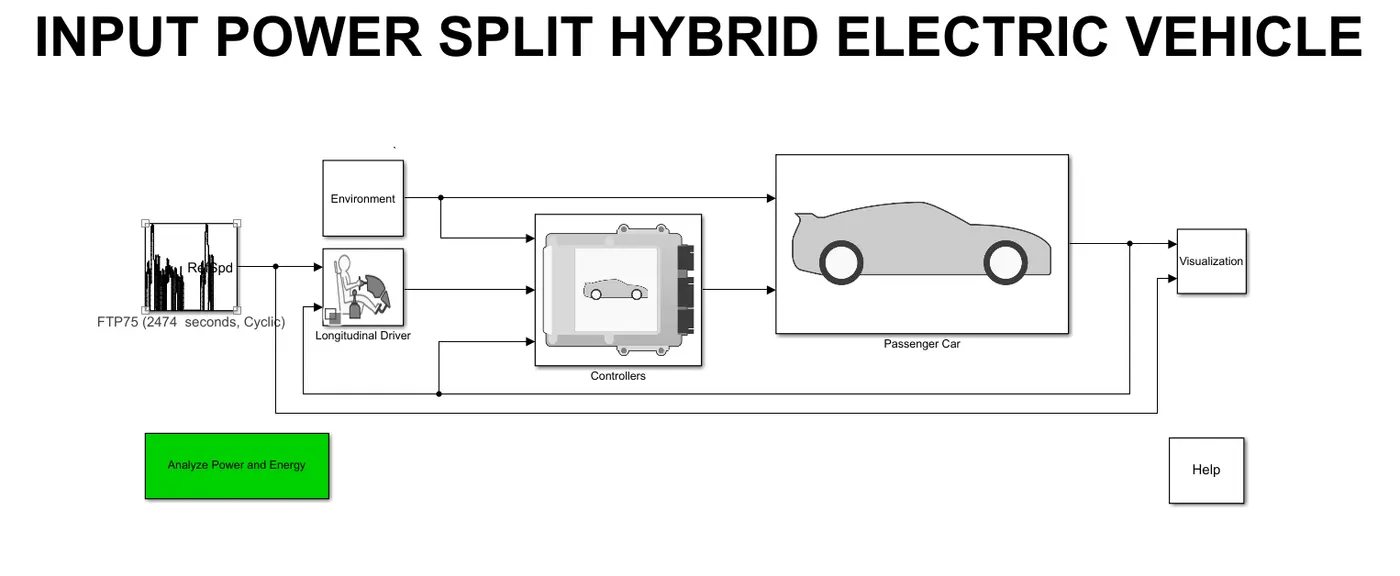
Now, i am considering the power split variant of hybrid vehicle model in powertrain blockset for analysis. The below shown is the powersplit simulink model of a hybrid vehicle. I will conduct two case studies using WOT drive cycle. One without changing the grade and grade veloity and the second study by changing the two parametres.
Case study - 1
time=100sec
grade=0%
wind velocity=0 m/s
drive cycle = wide open throttle (WOT)
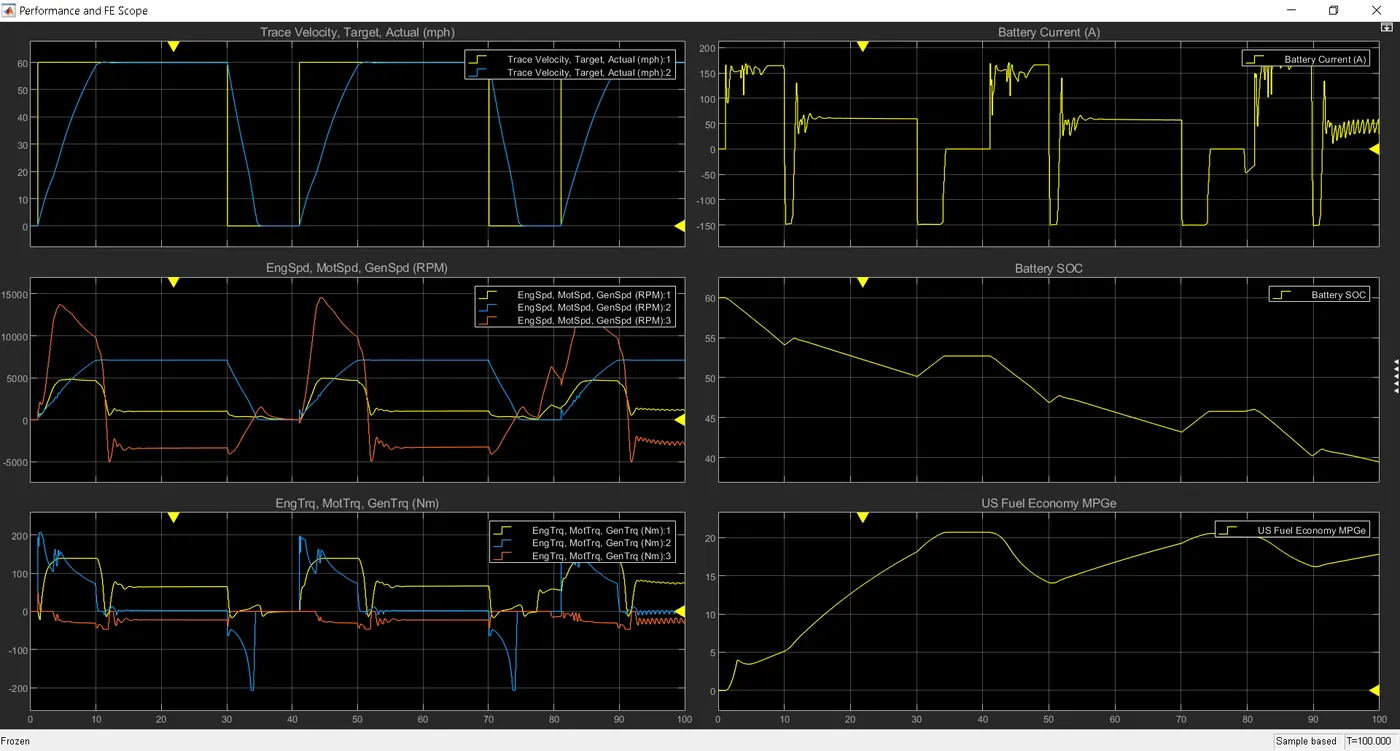
Here we got the output as 6 plots as shown above. Each plot deicts how the result varies when the input provided gets modified based on the mode's design. Now we will study each plots and point out major points from each one.
Plot 1 - drive cycle
The plot is a graph between velocity and time on x and y axes respectively.
peak velocity = 60 mph
Time taken by the vehicle to accelerate and reach the peak velocity = 9.753 sec
Time taken by the vehicle to decearate and stop = 5.495 sec
Plot 2 - graph between engine speed, motor speed and generator speed in (RPM)with repect to time
engine peak speed = 4957 RPM
motor peak speed = 7140 RPM
generator peak speed = 14540 RPM
Plot 3 - graph between engine torque, motor torque and generator torque in (Nm) with repect to time
engine peak torque = 139.50 Nm
motor peak torque = 207 Nm
generator peak torque = 47.43 Nm
Plot 4 - graph between battery current (A) with repect to time
Maximum discharge current from battery = 171.70 A
Mainimum discharge current to the battery = -151.90 A
Plot 5 - graph between battery state of the charge (SOC) in % with repect to time
The battery's state of charge (SOC) reduced from 60% to 39.44% in 100 sec for the WOT drive cycle.
Plot 6 - graph between US fuel economy in (MPGe) with repect to time
The maximum miles that the vehicle travelled is 20.67 miles for specied WOT drive cycle.
Case Study - 2
time=100sec
grade=10%
wind velocity=10 m/s
drive cycle = wide open throttle (WOT)
NOTE :- The grade value and wind velocity comes in the environ ment block of the hev input power split vehicle model
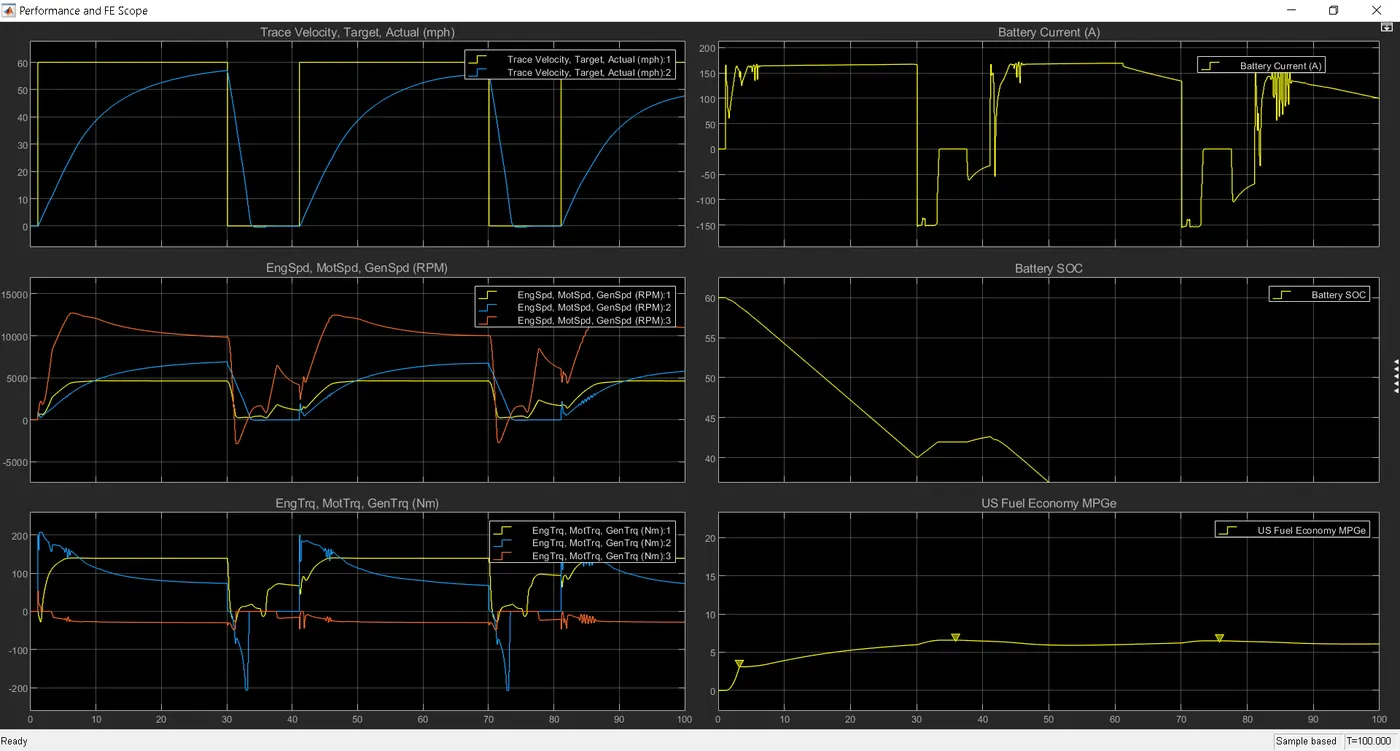
Here also we got the output as 6 plots as shown above. Each plot deicts how the result varies when the input provided gets modified based on the mode's design. Now we will study each plots and point out major points from each one.
Plot 1 - drive cycle
The plot is a graph between velocity and time on x and y axes respectively.
Because of grade and wind velocity the maximum speed of the vehicle was not able achieve the 60 mph
peak velocity = 56.20 mph
Time taken by the vehicle to accelerate and reach the peak velocity = 28.951 sec
Time taken by the vehicle to decearate and stop = 3.916 sec
Plot 2 - graph between engine speed, motor speed and generator speed in (RPM)with repect to time
engine peak speed = 4656 RPM
motor peak speed = 6907 RPM
generator peak speed = 12710 RPM
Plot 3 - graph between engine torque, motor torque and generator torque in (Nm) with repect to time
engine peak torque = 140.30 Nm
motor peak torque = 207 Nm
generator peak torque = 53.57 Nm
Plot 4 - graph between battery current (A) with repect to time
Maximum discharge current from battery = 174.90 A
Mainimum discharge current to the battery = -151.90 A
Plot 5 - graph between battery state of the charge (SOC) in % with repect to time
The battery's state of charge (SOC) reduced from 60% to 37.08% in 49.59 sec for the WOT drive cycle.
Plot 6 - graph between US fuel economy in (MPGe) with repect to time
The maximum miles that the vehicle travelled is 6.57 miles for specied WOT drive cycle.
SUMMARY
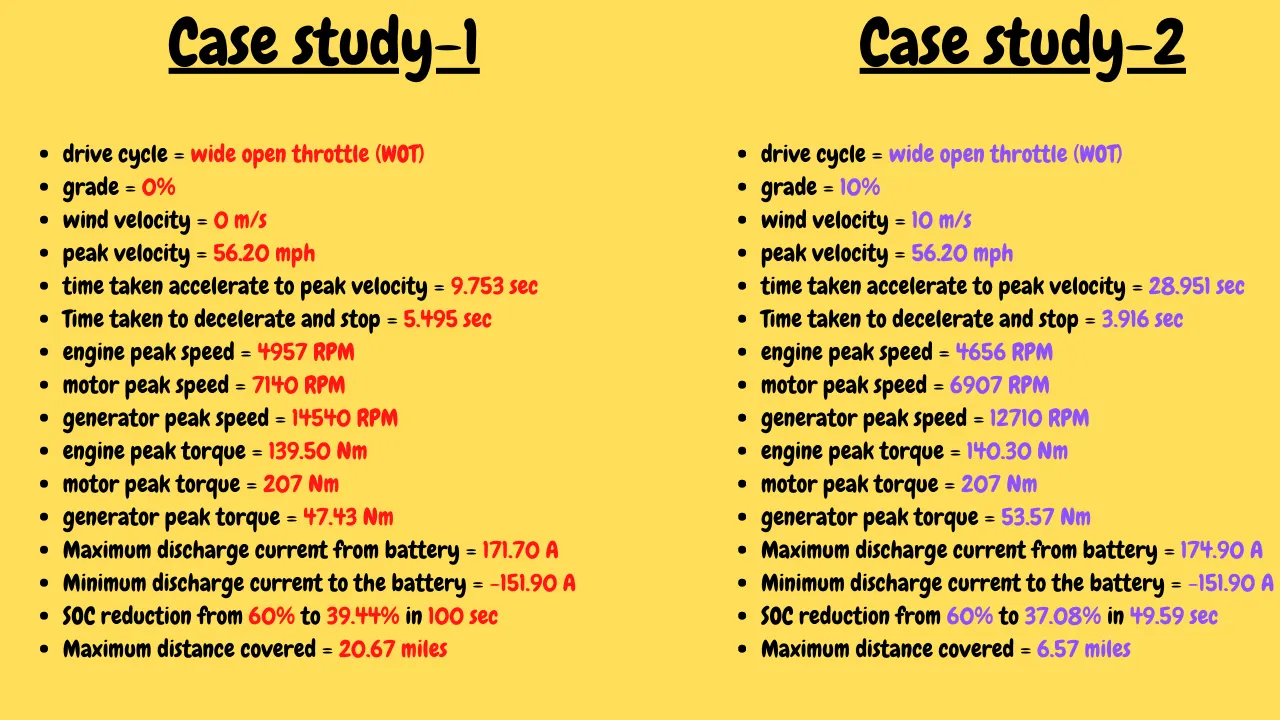
Hence we can see that when the vehicle is simulated for normal road condition and ideal wind resistance, the energy cinsumption is ideally less as compared to when it is running an inclined grade of 10degree and 10 m/s of wind velocity.
The battery discharge is 4 units more than the normal rad condition.
There is no much torque difference for engine and motor but the generator torue is more in case study-2. Because the battery might have discharged quickly in case study-2 as the SOC discharge has reduced quickly in case study-2 and this might hav ecaused the generator to charge the battery simultaneously. For that more times it would have rotated.
--------------------------------------------------------------------------------------------------------------------------------------------------------------------------------------------------------------------------------------------------------------------------------------------------------------------------------------------------------------------------------------------------------------------------------------------------------------------------------------------------------------------------------------------------------------------------------------------------------------------------------------------------------------------------------------------------------------------------------------------------------------------------------------------------------------------------------------------------------------------------------------------------------------------------------------------------------------------------------------------------------------------------------------------------------------------------------------------------------------------
OBJECTIVE-4 `to`Keeping all other parameters same, compare the simulated results of hybrid and pure electric powertrains.
Note:- I am using the WOT drive cycle for simulating the hybrid and pure EV. For your information, i hhave already simulated the hybrid vehicle. So i will simulate for pure EV and then compare the reuslts.
Pure Electric Vehicle
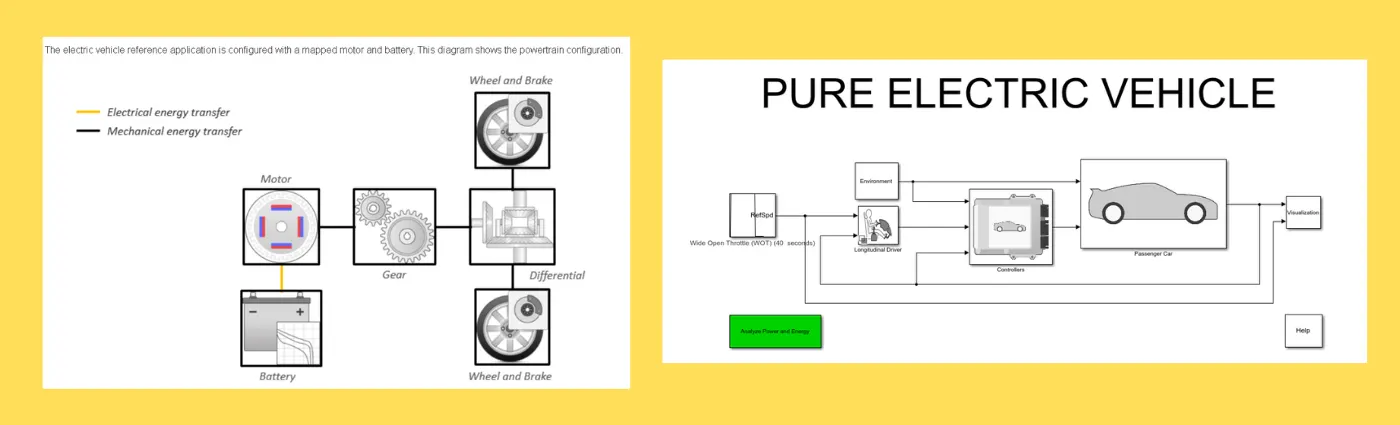
OUTPUT
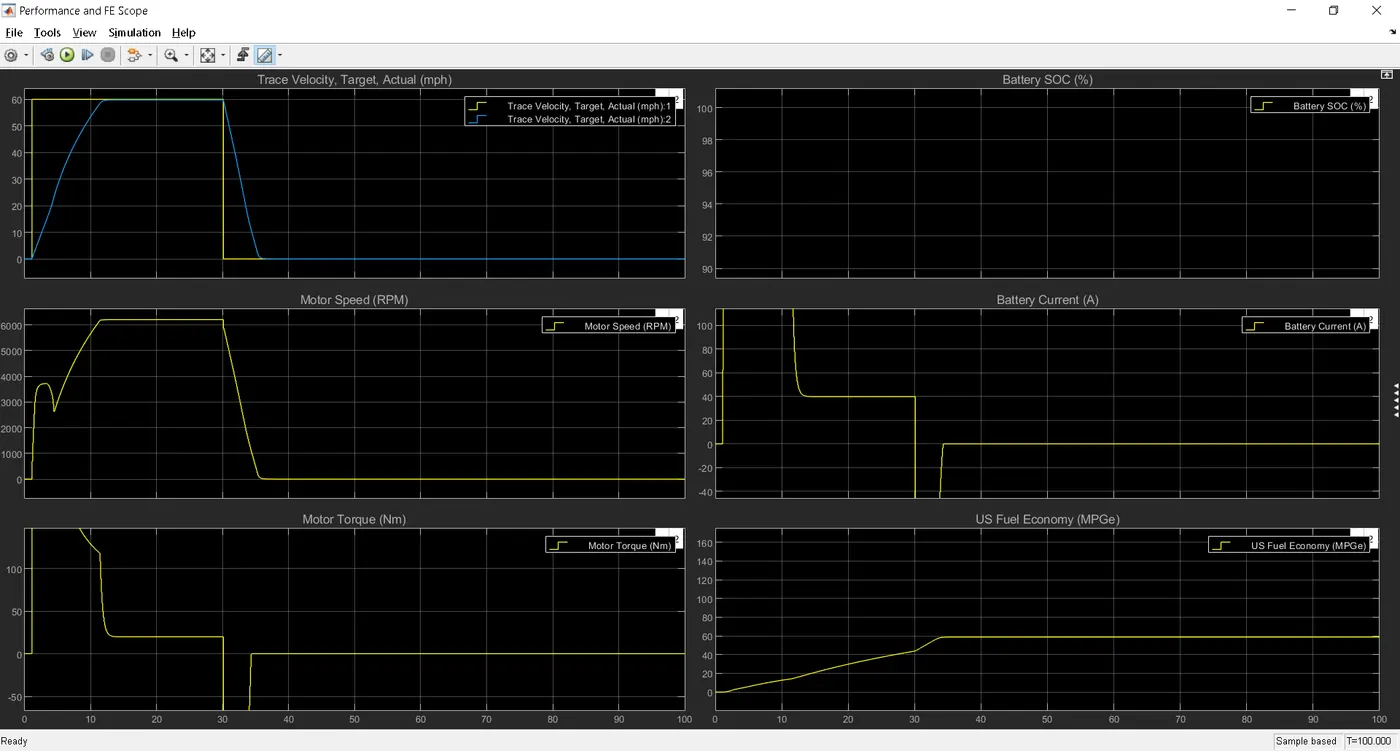
Plot 1 - drive cycle
The plot is a graph between velocity and time on x and y axes respectively.
Because of grade and wind velocity the maximum speed of the vehicle was not able achieve the 60 mph
peak velocity = 59.68 mph
Time taken by the vehicle to accelerate and reach the peak velocity = 11.46 sec
Time taken by the vehicle to decearate and stop = 6.139 sec
Plot 2 - graph between engine speed, motor speed and generator speed in (RPM)with repect to time
motor peak speed = 6208 RPM
Plot 3 - graph between engine torque, motor torque and generator torque in (Nm) with repect to time
motor peak torque = 280 Nm
Plot 4 - graph between battery current (A) with repect to time
Maximum discharge current from battery = 225 A
Mainimum discharge current to the battery = -141.169 A
Plot 5 - graph between battery state of the charge (SOC) in % with repect to time
The battery's state of charge (SOC) reduced from 80% to 79% in 33.37 sec for the WOT drive cycle.
Plot 6 - graph between US fuel economy in (MPGe) with repect to time
The maximum miles that the vehicle travelled is 58.28 miles for specied WOT drive cycle. This value is the gasoline equavalent value calculated in MPGe, as it is a pure EV, no fuel used.
COMPARISON
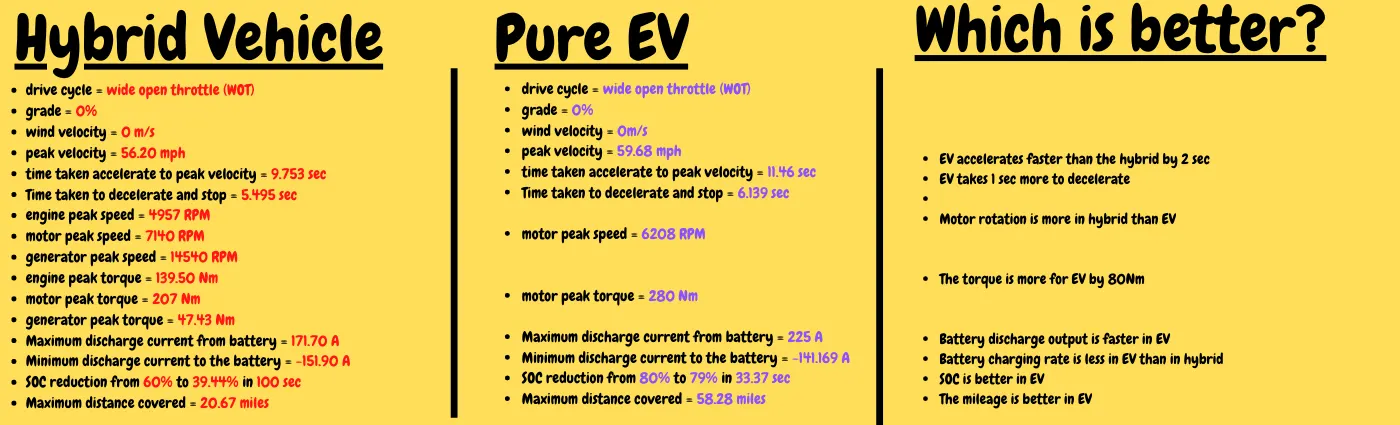
REFERENCE
https://www.mdpi.com/2032-6653/9/1/12/htm