Week-4 Challenge WOT Condition Part-2
1.
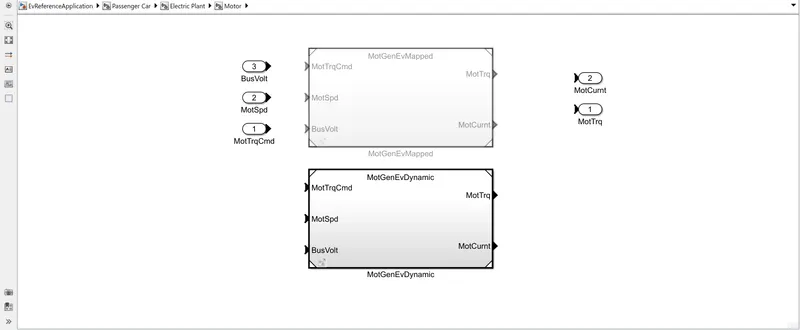
Mapped model: The data used for operation and entered in a form of a lookup table which would be then configured with the operational parts and the analysis would be formed. If the detailed specification or lookup table data is available with us then the simulation becomes easier and it gives the results based on the data interpreted. It is also known as the global-based model. The main disadvantage is that mode data has to be collated and some assumptions have to be taken.
Dynamic model: It understands the behavior of the part/element and then it behaves accordingly. It gives detailed analysis for the variations entered by us in the specifications whereas it simulates according to real and dynamic operations. It operates dynamically depending on the situation of the operation detailed data and specifications are not required and the simulation gives the detailed analysis of the components simulated. It is known as a real-time-based model. The main disadvantage is that we could not simulate as per customized specifications.
The model type can be changed by going into a passenger car, electric plant, motor and then altering it to mapped or dynamic.
2. How do we calculate miles per gallon?
Conversion from cubic meter to the gallon(m^3 to the gallon)
264.172 Gallons is 1000L
The HEV reference model is taken into consideration and it operates on both the battery and fuel injection engine.
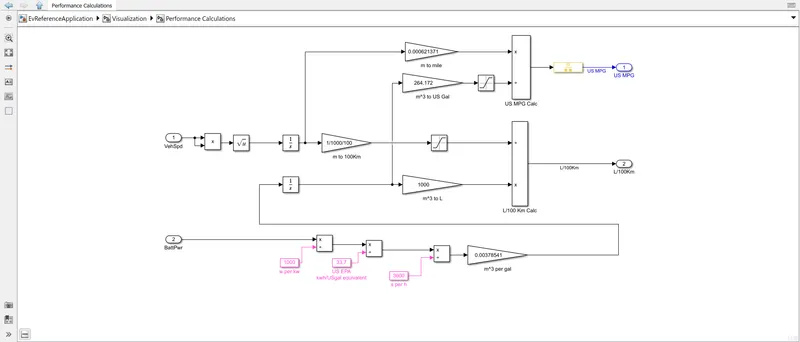
The final output is calculated by keeping into consideration the battery output, fuel output, and vehicle speed/kilometers driven. Therefore, the fuel efficiency is calculated and it is converted after the saturation, this the Fuel efficiency is calculated.
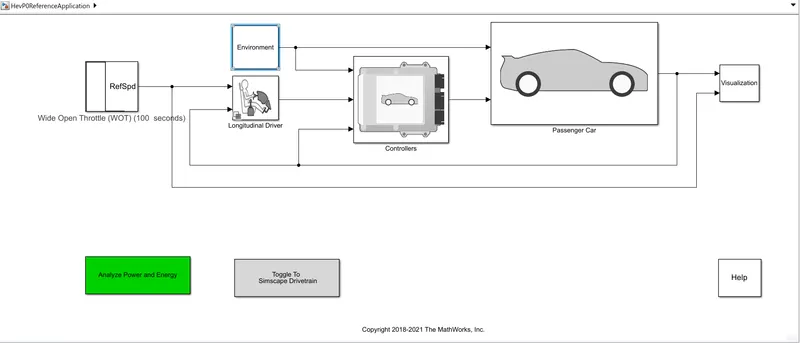
3. Run the HEV ReferenceApplication with WOT drive cycle. Change the grade and wind velocity in the environment block. Comment on the results.
This is the Simulink block diagram of an HEV ReferenceApplication with WOT drive cycle:
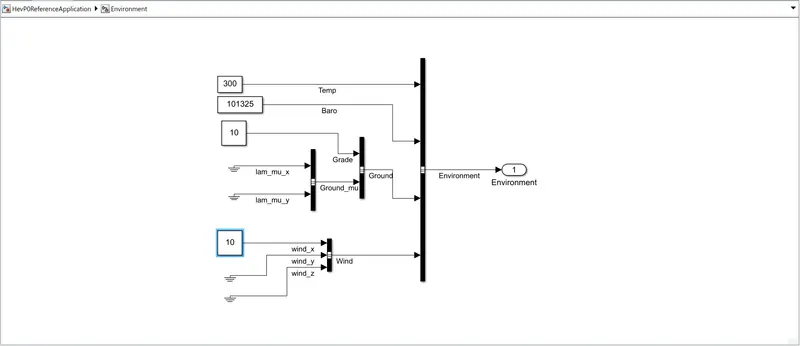
The wind and grade parameters are altered to 10 and 10 and then we run the simulation.
We run the simulation for 2474 seconds
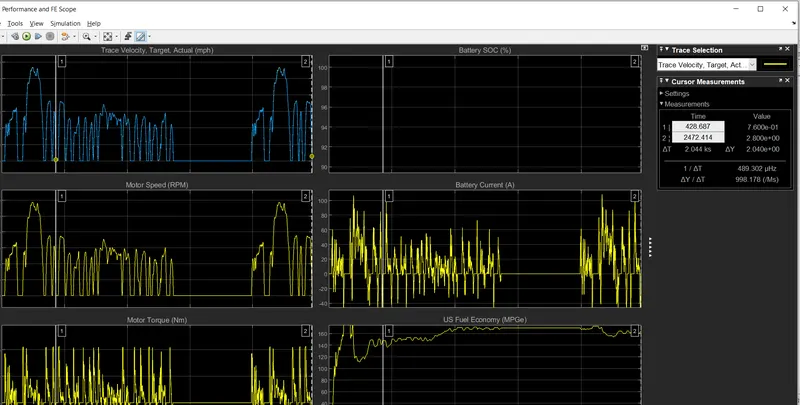
The characteristics are obtained for trace velocity, battery SOC, motor speed, Battery current, Motor torque, and fuel economy.
When the grade and wind velocity are increased, the vehicle is unable to reach the target velocity. The engine speed has reduced to a steep slope on the negative side when the wind and grade have changed and the target engine speed is not met.
There are different variations in Engine torque, Motor torque, and generator torque and are visible in both the results of normal and with grade and wind velocity
Battery current has been fluctuating at a higher range as compared to the normal after the vehicle is reaching near to steady/stable peace the fluctuation start and is simulated.
The battery SOC has not been simulated due to changes in the simulation. Although for both cases, the SOC remains almost the same.
The average fuel economy differ in the ranges of 6 to 9 mph in both scenarios
4. Keeping all the parameters the same, compare the results of the EV and HEV powertrain
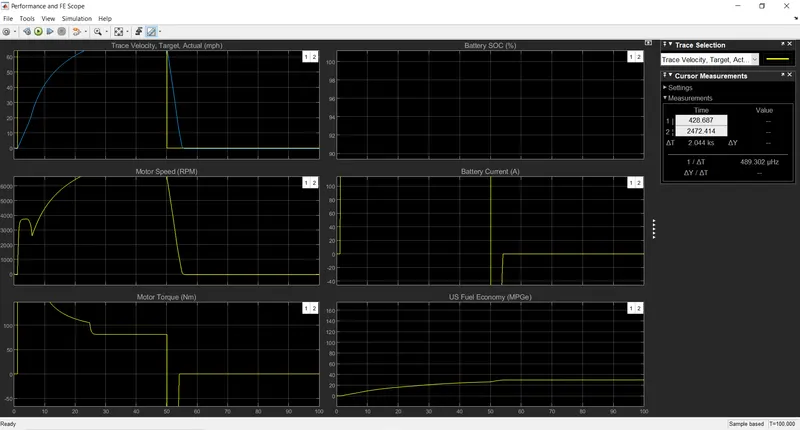
We run the simulation for a time period of 100 seconds.
EV results:
HEV results:
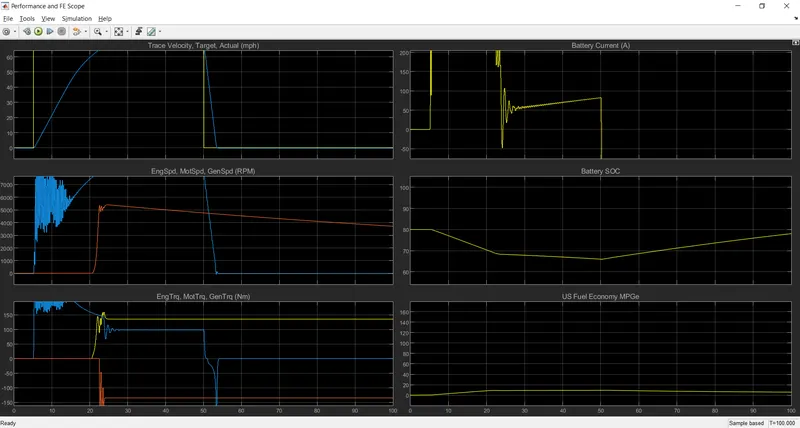
Comparison:
The difference in the simulations is based on vehicle operations where the EV is completely operated on the battery as the power source and on the other hand the HEV has two power sources SI/CI Engine and battery. The results obtained are varied and the parameters also differentiated accordingly