Week-4 Challenge WOT Condition Part-2
- What is the difference between mapped and dynamic model of engine, motor and generator? How can you change model type?
The powertrain Blockset™ provides fully assembled reference application models of automotive powertrains, including gasoline, diesel, hybrid, and electric systems. It includes a component library for simulating engine subsystems, transmission assemblies, traction motors, battery packs, and controller models
The Powertrain Blockset simulates Propulsion systems using two different models.
One is Mapped another is dynamic modelling. For the Mapped model of Engine, it uses CiMappedEngine and SiMappedEngine and for the Dynamic it uses CiEngine and SiEngine.
The Mapped Model uses, look-up tables for torque, fuel flow rate, engine exhause emission etc, to simulate engine performance,while the dynamic model simulates engine performance based on realtime lower level engine components.
The Mapped model is used usually for engine steady state simulation and analyses the macro level performance of the engine model,However the dynamic model is used for transcient and realtime situation.For eg, dynamic modelling is more suitable for finding the effect of a turbocharger on the vehicle acceleration.
The mapped model is easier and faster to simulate compared to Dynamic modeling where individual component data is required and takes longer to simulate each component.The dynamic model is also more accurate and detailed.
The Matlab Hybrid Electric Vehicle Multimode Reference Model is a Parallel hybrid model, using both IC Engine and an Electric Power Train for Propulsion.The model (autoblkHevStart) has Engine, Generator and Motor for Propulsion as shown below.This model uses
both Mapped and Dynamic Models for Engine, Motor and Generator.
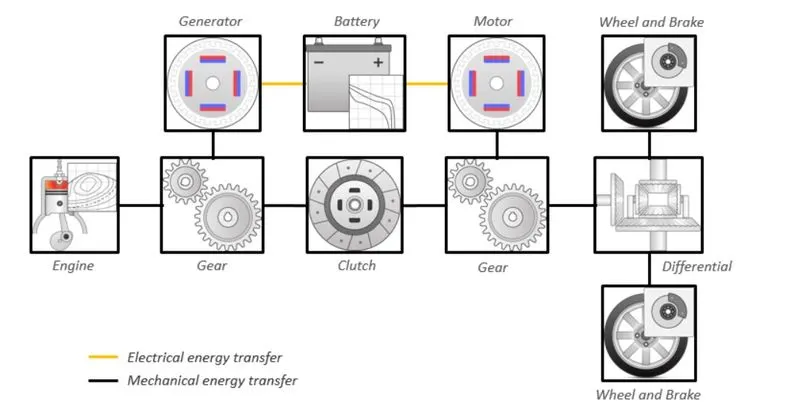
The mapped model is the default. To switch to dynamic model
the following steps needs to be taken.
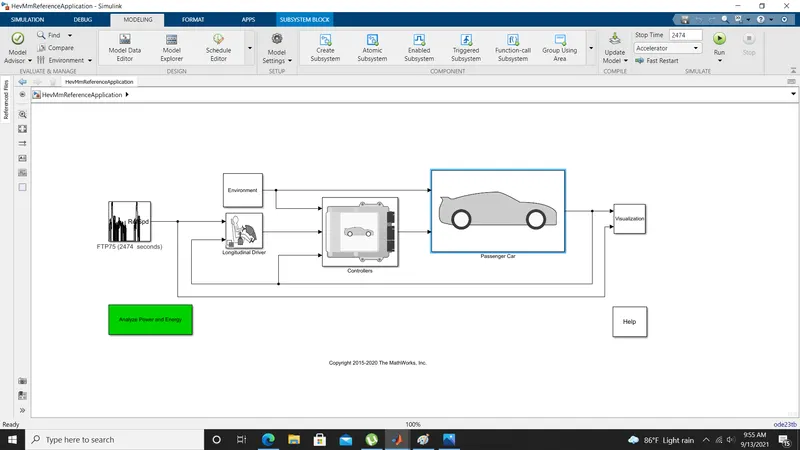
Step 1:Open the Engine Model by typing autoblkHevStart in the Matlab command window and open then the plant to get the model.
Step 2:
Click on the Modeling Tab on the tool bar and select Variant Manager.
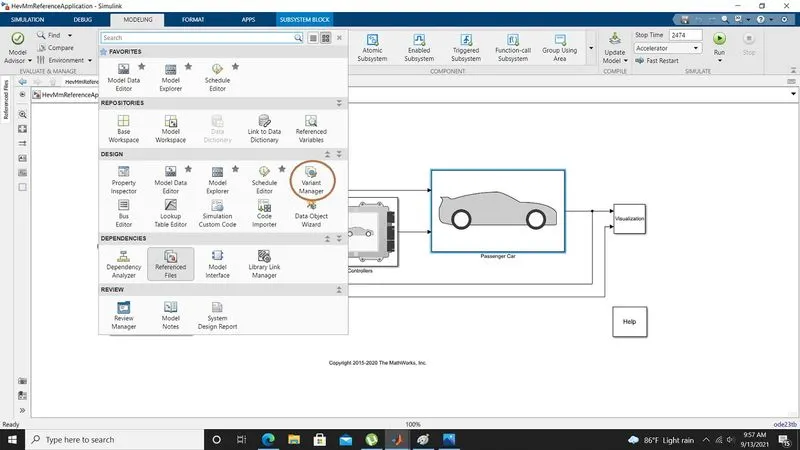
The Following Dialog box will open
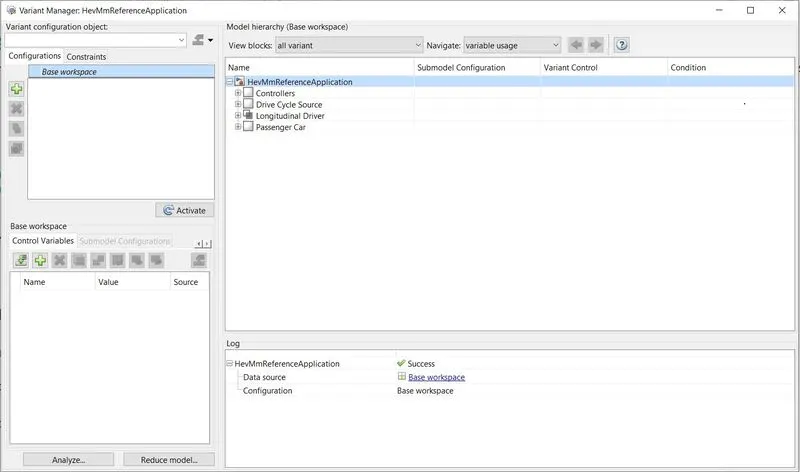
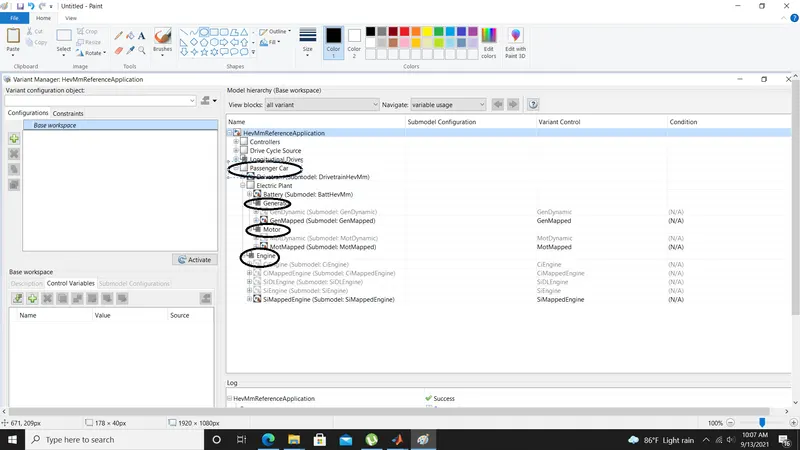
Step 3: Expand the Passenger Car, then Generator, Motor and Engine as shown to see the default model setting as shown below. It can be seen all the three models are mapped and are highlighted in bold.
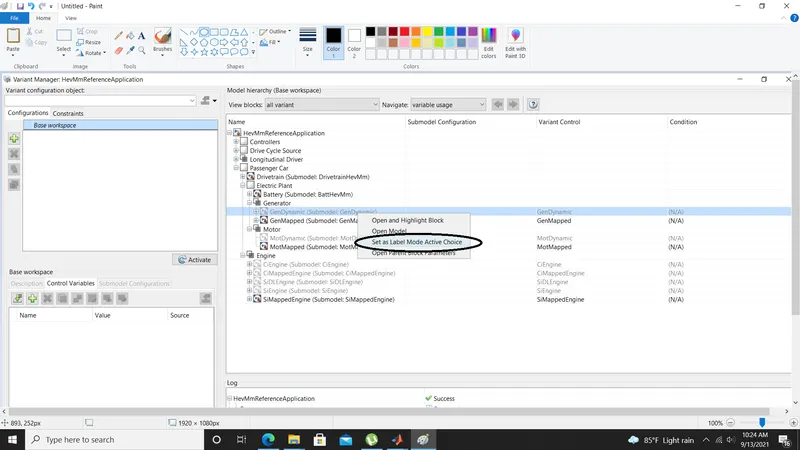
Step 4: Right Click The GenDynamic and select Set as Label Mode Active Choice as Shown below. Do the same for MotDynamic and SIEngine.
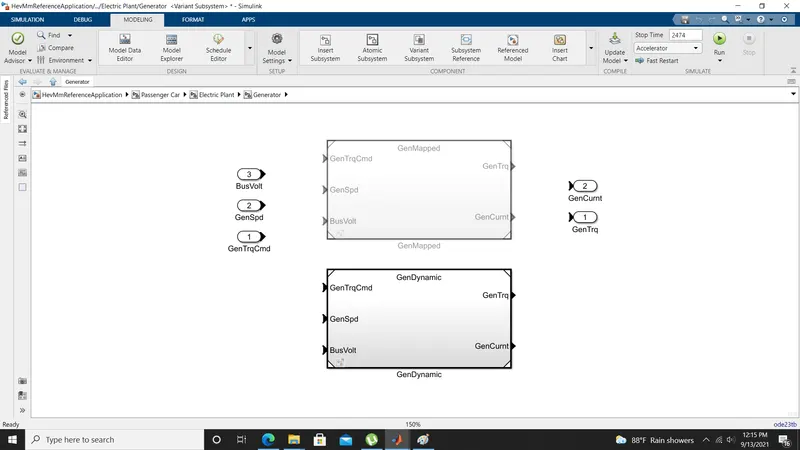
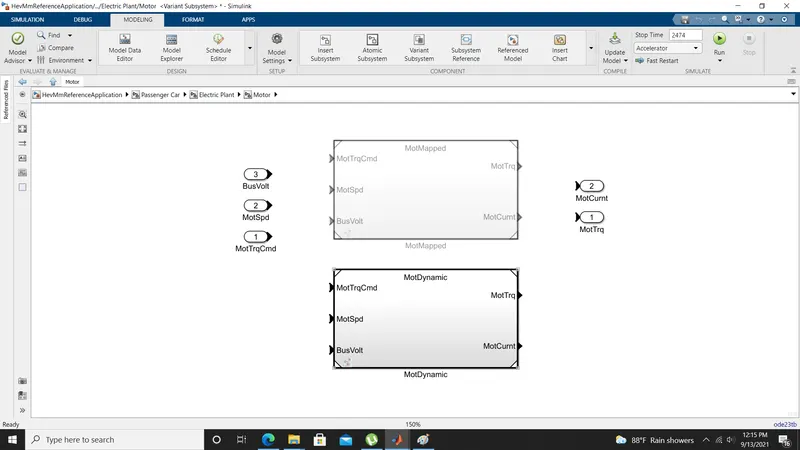
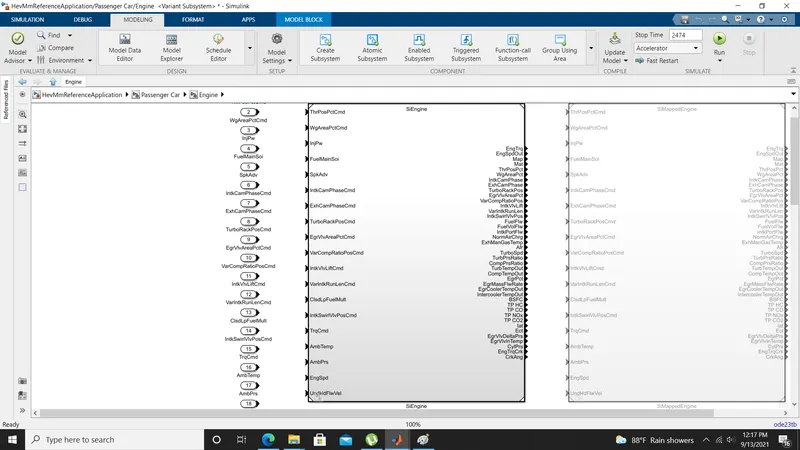
Step 5:Check the Generator, Motor and Engine Block in the Passenger car block to see if the dynamic model is highlighted.
For Generator Model:
For Motor:
For SiEngine:
2. How does the model calculate miles per gallon? Which factors are considered to model fuel flow?
The vehicle Fuel economy of the the model is done using performance calculation block giving the result in US Miles per Gallon.
US MPG is a method of calculating fuel economy of a vehicle primarily used in US, Canada.
It measures the number of miles travelled by one gallon of fuel. The higher the value, the better is the fuel economy.
Another Mode of Fuel economy calculation is L/1OO km which is also used in this model.which gives the number of litres required for 100 km, here the lower value indicates better fuel economy.
For our question we will focus on US MPG.
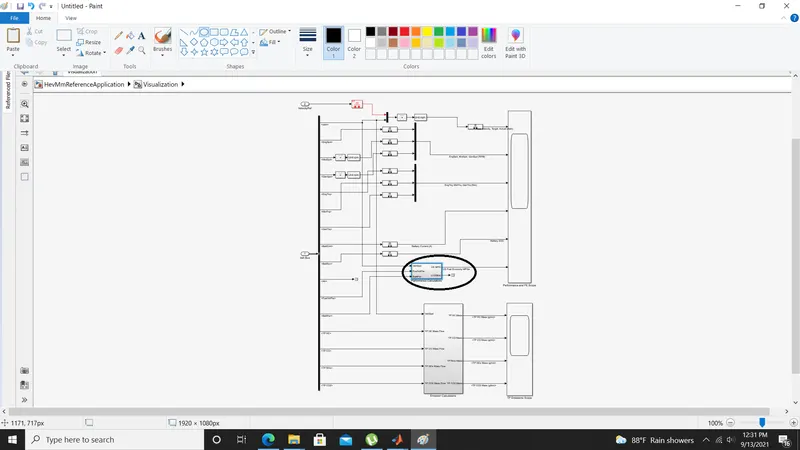
To find how the calculation is done, we can see inside the Performance Block.
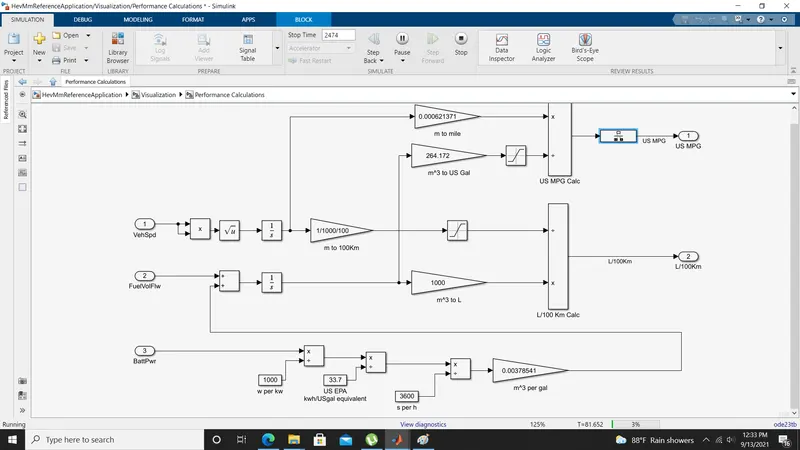
There are three inputs to the vehicle performance calculations.
1. VehSpd ( Vehicle Speed)
2.FuelVolFlw( Fuel Flow)
3.BattPwr ( Battery Power)
And Two Output
1. US MPG
2. L/100 Km
To get the output in US MPG the following steps are done.
Step 1: Converting Vehicle speed to miles.
VehSpd has the unit m/s, the vehicle speed is squared and rooted to get rid of negative values of velocity.
The VehSpd is integrated by an integration block to get the distance in meters.
The distance is converted to miles using a gain multiplier with a value of 0.000621371 to convert from m to miles.
STEP 2: Calculating Fuel Consumption.
Since this is a Hybrid Vehicle model. There are two types of Fuel Consumption in this Model.Battery ( Electric and Fuel) to calculate fuel economy both fuel has to be added.
The important part is to convert the Electric battery Consumption to Fuel.
This is done by the following Steps
1. BattPwr convert to US Gallon per Second.
The BattPwr is given in Watts,to convert it to KW , its divided by 1000 using a divider block.
To convert from KW to gallon US EPA Standard is used, which states, 1 gallon of gasoline = 33.7 KWh of Electric Power. Thus the BattPwr is divided by 33.7 to get US gallon per hour.
To convert to US gallon per sec,its divided by 3600.
Since the FuelVolflw is in m3/s and the BattPwr needs to added to it.The resultant BattPwr is converted to m3/s by a gain block of 0.00378541 to convert BattPwr to a fuel flow m3/s.
This is added with FuelVolFlw, using an addition block. The block is then integrated to convert the flow to Volume and finally converted back to US gallon using a Gain block of 264.172 to get the total volume of fuel used.
STEP Three.
The output of the Speed conversion and that of the Fuel Consumption are divided to get the Fuel Consumption in US MPG
3.Run the HEV ReferenceApplication with WOT drive cycle. Change the grade and wind velocity in the environment block. Comment on the results.
Q3 Part 1: WOT analysis of the HEV Reference Application.
The WOT drive Cycle taken for the simulation is as follows
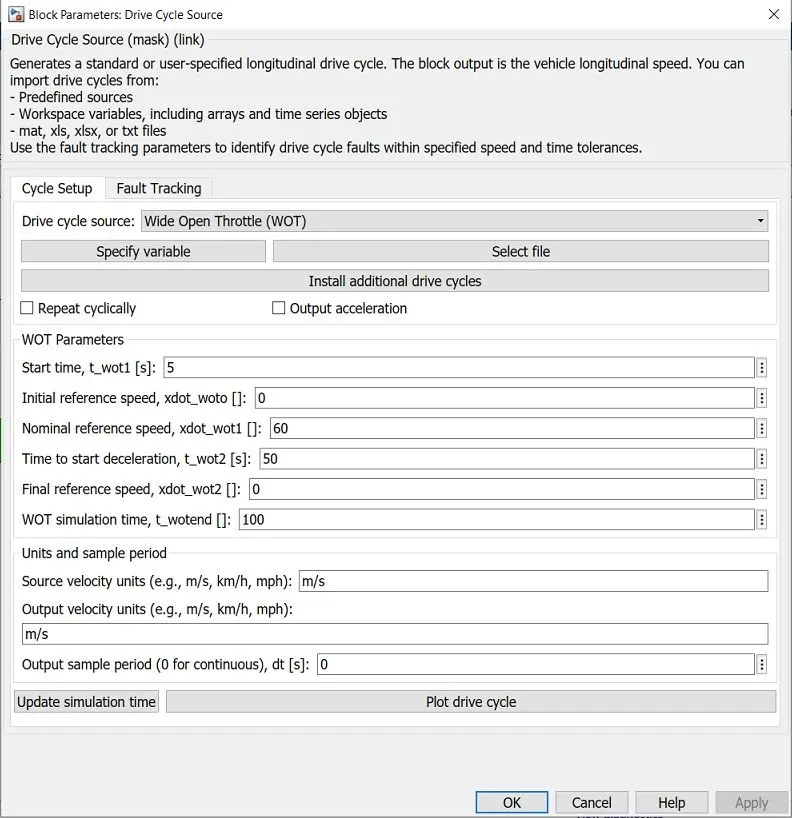
The nominal reference speed is 60, Time of Deceleration is 50 Sec, and Total simulation time is 100 Sec.
The result is shown below.
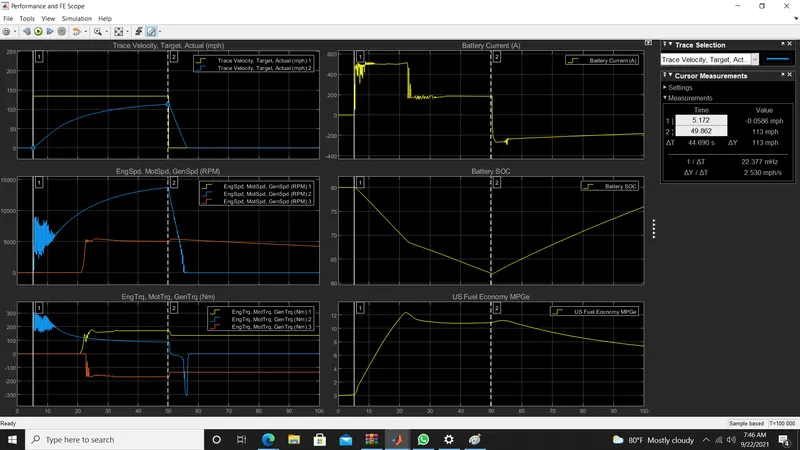
There are 6 plots in the Result scope.
1.Trace velocity ( which is the drive cycle demand velocity) and the Actual velocity.
2.Engine speed, Motor speed, and Generator speed.
3.Torque plot for Engine, motor and Generator
4.Battery Current
5.Battery SOC
6. Fuel Economy in US MPG.
The First plot show the vehicle performance of Speed for WOT analysis.
The yellow line is the Demand speed, by the driving cycle and the blue is the actual speed.
It can be observed, that the vehicle actual speed dont reach the vehicle demand speed. this is due to physical limitation like battery current limits or Temperature protection limits etc in the model.
The maximum actual speed reached at 50 sec is 113 mph.while the drive cycle command was 134mph. The acceleration time to get to 113 mph is 44.966 sec
From the Engine motor and generator speed and torque plot we can observe, that during the initial acceleration the electric motor provide the torque and the engine speed is zero. The electric motor provide an initial maximum torque of about 300 which steadily reduces to 86.5Nm at 50 sec.
The engine starts at 20 sec and provides an additional torque of about 170 Nm to help in accelerate the vehicle and also drive the generator . The generator and Engine Runs at the Same RPM that is about 5000 rpm.
The moment the engine kicks in, the Battery current drops from about 510 A to 180 A, indicating the reduction in load on the Electric motor. which helps in Preserving the Battery SOC.
The Battery SOC had dropped steeply from 80 % to 68 % in just 22 sec. The Starting of the engine reduced the steepness of battery discarge, taking it to 50 % at the end of the WOT drive cyle at 50 sec.
However the Sharp braking causes the Regenerative braking to recharge the battery, in addition to that the generator also provides charging of the battery, as the engine no longer provides torque to the powertrain indicated by drop in engine torque. It can be seen that a very small amount of torque was provided by the engine to the drive train during acceleration, i.e about 34 Nm. most of the engine torque was used by the generator .
With the Help of the generator and Regenerative braking the SOC reached to 75% at the end of the 100 second simulation.
The regenerative braking has a minor contribution to the recharging of the battery compared to the generator. how ever the regenerative braking helps in improving the Fuel economy, as can be observed during the braking period in the fuel economy plot.
The fuel economy increases to 10.8 to 11.5 US MPG during the braking period.
The Overall Fuel economy of the Vehicle is 11 US MPG increasing to 12.36 when only the Electric Motor is running during the initial acceleration. the fuel economy drop to 10.7 when both the motor and engine runs indicating the Engine is less efficient compared to an electric motor.
Conclusion
Finally from the WOT analysis of the Hybrid model we can understand that the Electric motor is more fuel economical compared to the engine, however the Battery power and capacity is a limiting factor for driving an electric vehicle over long distance, this can be improved by using an engine to provide charging of the battery on the expense of slight reduction in fuel economy.
Part 2: Effect of environment on the HEV performance.
Now we will observe the effect of changing the grade angle and Wind velocity on the vehicle performance.
The grade angle and wind velocity is shown below.
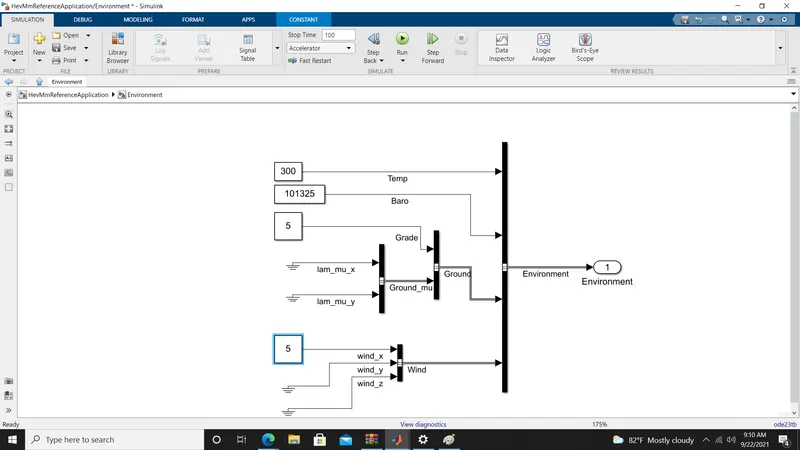
The grade angle and wind velocity was changed to 5 in the environment block .
The results shown below.
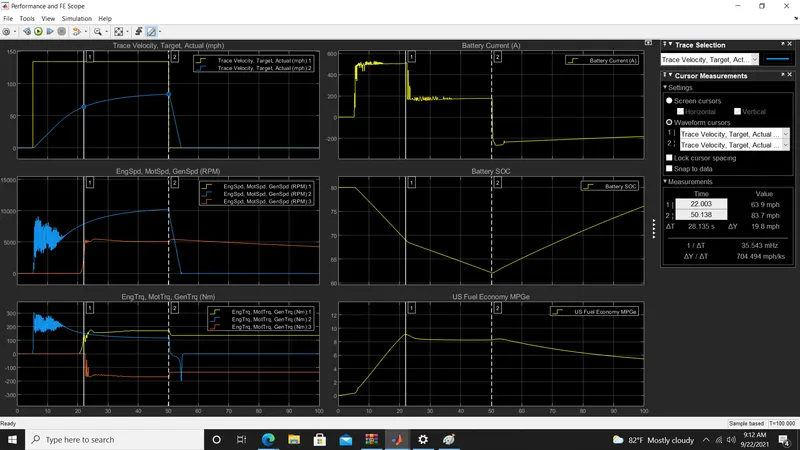
The obvious observation on the performance of the vehicle is the drop in speed. from 113 mph without environmental effect the speed has dropped to 63 mph at the end of 50 sec. There is also some drop in motor speed, but the torque, battery current and SOC discharge remains similar.
The other major drop is in the fuel economy, which drop to 8.2 MPG on average and 9 MPG when the Motor is running.
It can be observed that the limitation to the Battery current doesnt allow the Vehicle to generate extra torque during hill climbing and in harsh windy situation, thus reducing engine performance.
Q4. Keeping all other parameters same, compare the simulated results of hybrid and pure electric powertrains.
To compare the hybrid and Pure electric vehicle we will use the WOT analysis on the same environmental condition of 5 wind speed and a grade angle of 5.
The Result of Hybrid power train is put below.
The Result of the Electric Power Train
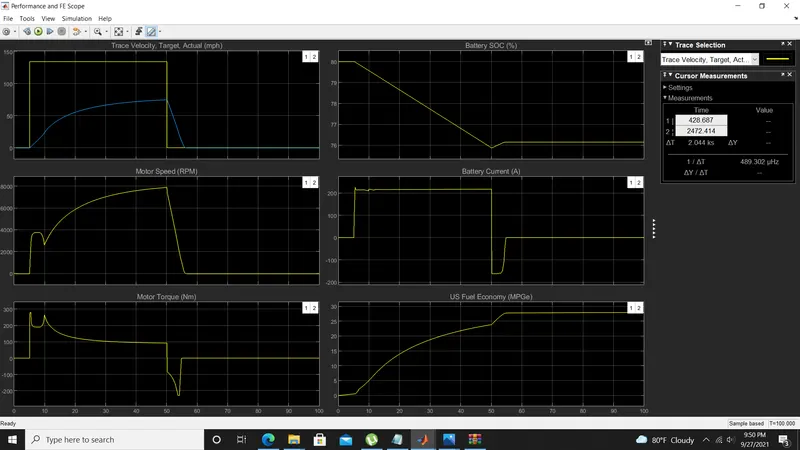
For the Pure Electric power train, the Speed is 74 compared to 63 at the end of 50 sec. This indicates the speed of the Electric power train is slightly more than the Hybrid Power train.
The motor RPM is slightly more than that of Hybrid Power train. And the torque produced by electric vehicle is much higher than that of the hybrid power train.
The most significant Difference between the Hybrid and Pure electric vehicle is the Battery SOC.
In the electric Power train the Battery SOC drops and during acceleration but is not recovered much compared to the hybrid power train, which recovers the battery SOC by recharging the battery using the Engine.
The regenerative braking does provide some Charge Recovery but its not very high. this indicates the distance travelled by an Electric Car compared to Hybrid is lesser.
How ever the fuel economy of the Electric Vehicle is better compared to the Hybrid Electric Vehicle.