Week-4 Challenge WOT Condition Part-2
AIM:
- To list the difference between the mapped and dynamic model of engine, motor and generator and explain how the model type can be changed.
- To explain how the model can be calculated in miles per gallon and factors that are considered to the model fuel flow.
- To run the HEV ReferenceApplication with WOT drive cycle and to change the grade and wind velocity in the environment block.
- To compare the simulated results of hybrid and pure electric powertrains, keeping all other parameters same.
BODY OF CONTENT:
1. Differeence between the mapped and dynamic model of engine, motor and generator:
Mapped model:
A mapped model which is also called as static model is a 2D plotted graph between the data of independent variable and dependent variable parameters. If the data of motor is known, the data is mapped as the input to the simulation.
Mapped model runs the simulation at faster rate which takes the data from the lookup table.
Mapped model of an engine:
Mapped engines represent macro engine behavior as a set of lookup tables as functions of commanded load and measured engine speed. Model uses a set of steady-state lookup tables to characterize engine performance.
The tables provide overall engine characteristics, including actual torque, fuel flow rate, BSFC, and engine-out exhaust emissions.
It is used when
-
If you have engine data from a dynamometer or a design tool like GT-POWER.
-
For quasi steady-state engine simulations.
Mapped engine models are suitable for analysis and design activities that do not require engine subsystem dynamic characteristics, for example, in engine and transmission powertrain matching analysis for fuel economy, emissions, and performance tradeoffs.
Mapped model of motor:
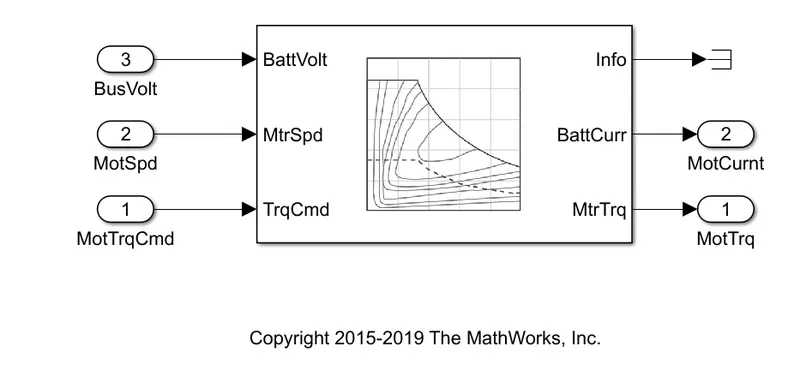
The block for mapped model of motor is seen in motor block from electric plant sub-system.
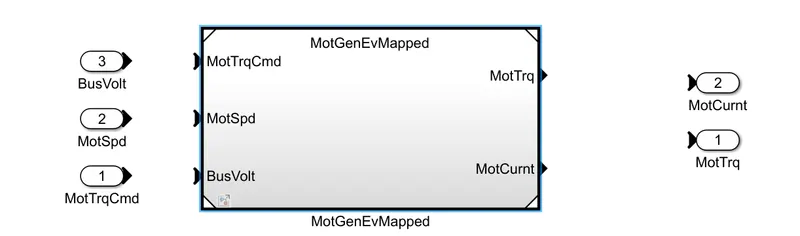
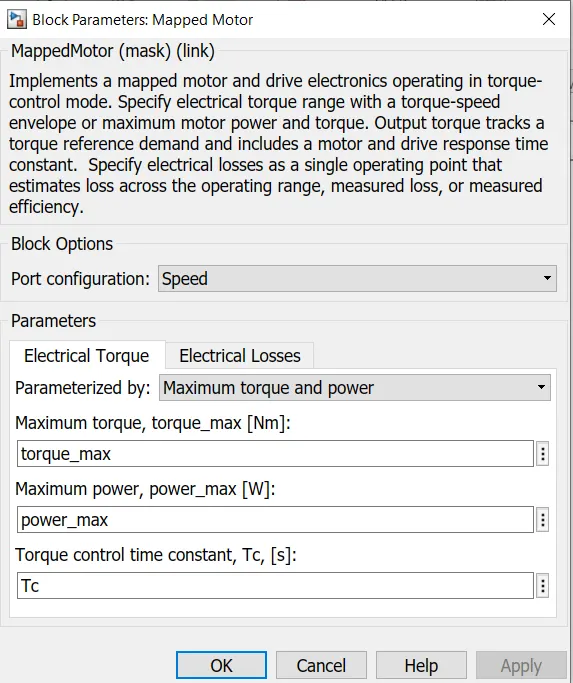
Mapped model of motor for the given model is as shown below which displays the data of maximum torque and power for respective speed values.
Dynamic Model:
Dynamic model which is the actual model that represents the actual components of the system/model.
Dynamic model of an engine:
Dynamic model decomposes the engine behavior into engine characteristics that are separated into lower-level components. By combining components in this way, the models capture the dynamic effects, most notably intake airflow and turbocharger dynamics.
It is used when
-
If you need a more detailed dynamic model and have component-level data.
-
To analyze the impact of individual engine components on the overall performance.
Dynamic engine models are suitable for designing control, estimator, and diagnostic algorithms that depend on dynamic subsystem states, for example, in closed-loop AFR control algorithm development.
Dynamic model of a motor:
The dynamic model of motor is also given below the mapped model to run the simulation in dynamic mode.
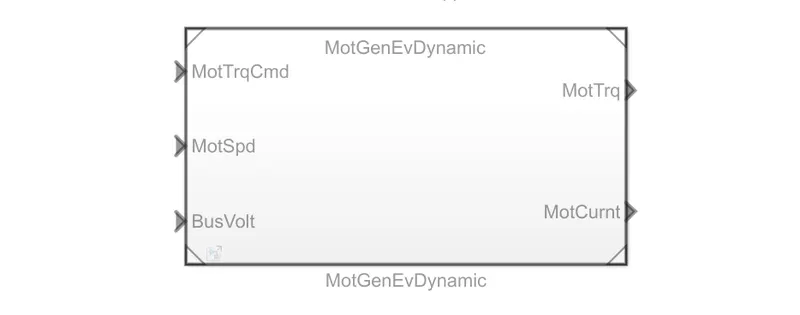
The dynamic model is as shown below.
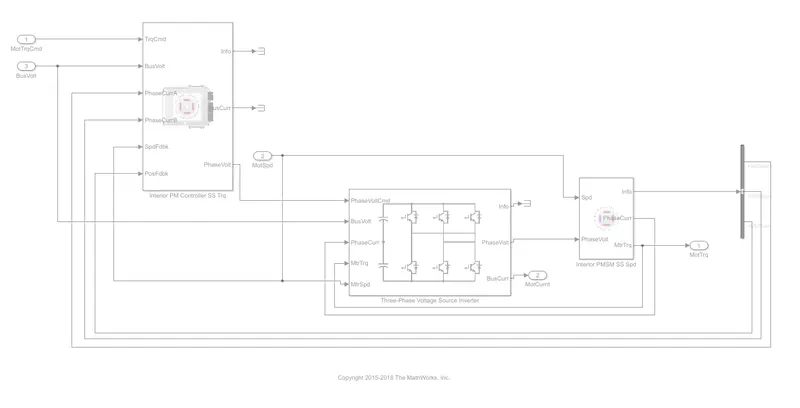
Since the simulation is made to run in mapped model, it is not highlighted properly.
It takes the feedback from the results and simulation is done which has no pre-defined inputs.
Switching between the model types:
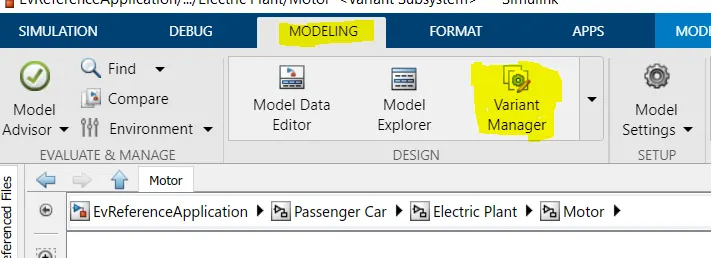
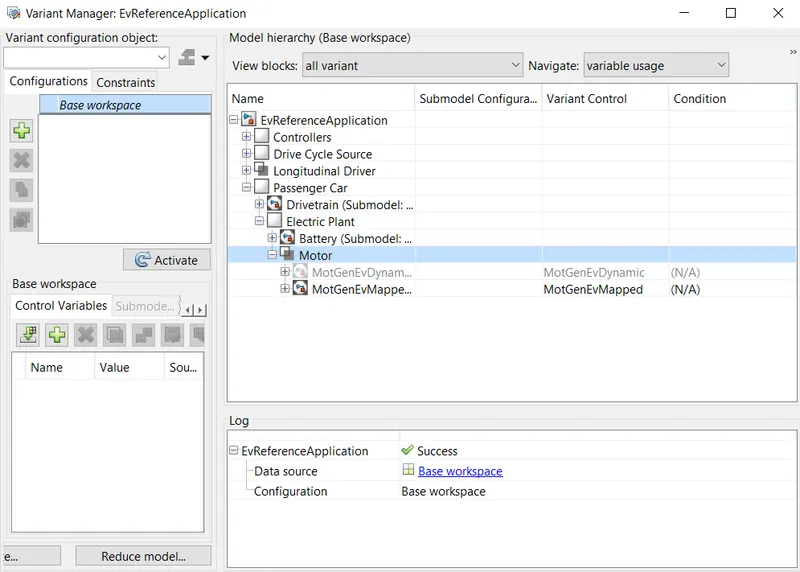
To switch the simulation from mapped model to dynamic model, go to modelling. Then select variant manager. Now you can switch the model from mapping to dynamic and vice versa.
2. Calculation of miles per gallon by the model:
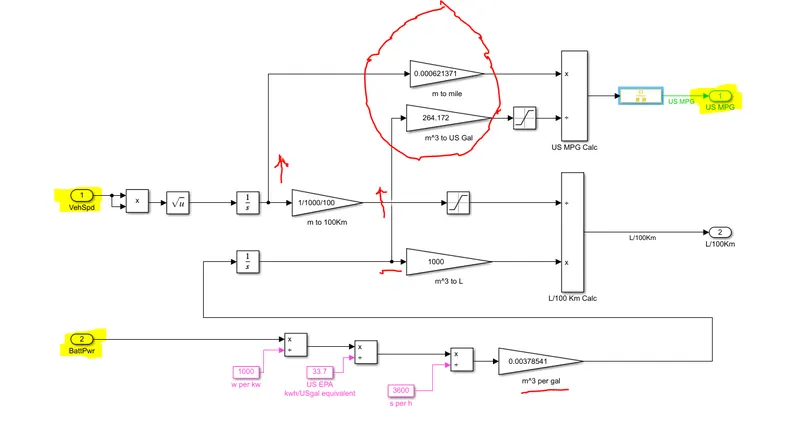
The model calculates how much miles per gallon of equivalant energy of battery is used which represents the fuel efficiency. In pure EV, this value is high. MPG or miles per gallon, is the distance measured in miles, that a car can travel per gallon of fuel. MPG is also the primary measurement of a car's fuel efficiency generally used in US.
1 gallon of gasoline produces 33.7 kWhr of energy. Therefore inorder to convert the energy consumed by the battery in kWhr to gallon divide it by 33.7.
Thus, by dividing distance in miles into number of gallons of fuel consumed, we get miles per gallon.
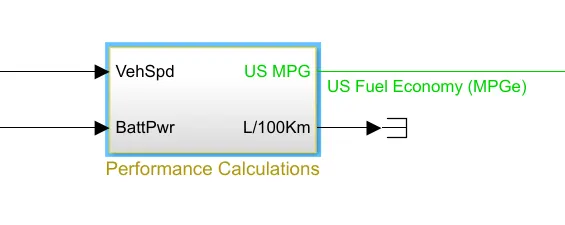
It takes battery power and vehicle speed as inputs to convert kWhr to miles per gallon as output.
Factors considered to model fuel flow:
Fuel specific gravity
Fuel calorific value
Rate of injection of fuel
Stoichiometric air-fuel ratio
3. Run the HEV Reference Application with WOT drive cycle. Change the grade and wind velocity in the environment block. Comment on the results:
To open HEV Reference application, go to help section and type powertrain blockset. In powertrain blockset go to 'Get started with powertrain blockset' and select 'Explore the hybrid and electric vehicle multimode reference application' and select open model. The model for 'HEV Reference Application' will open.
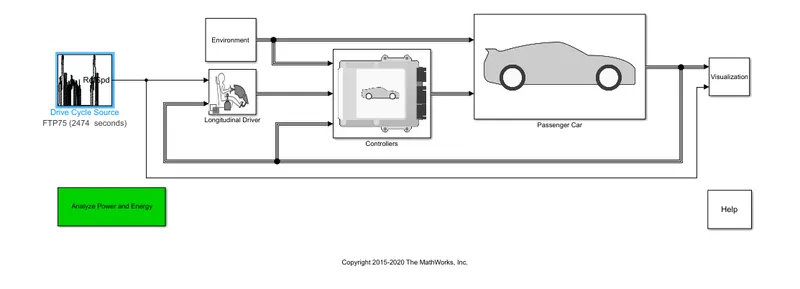
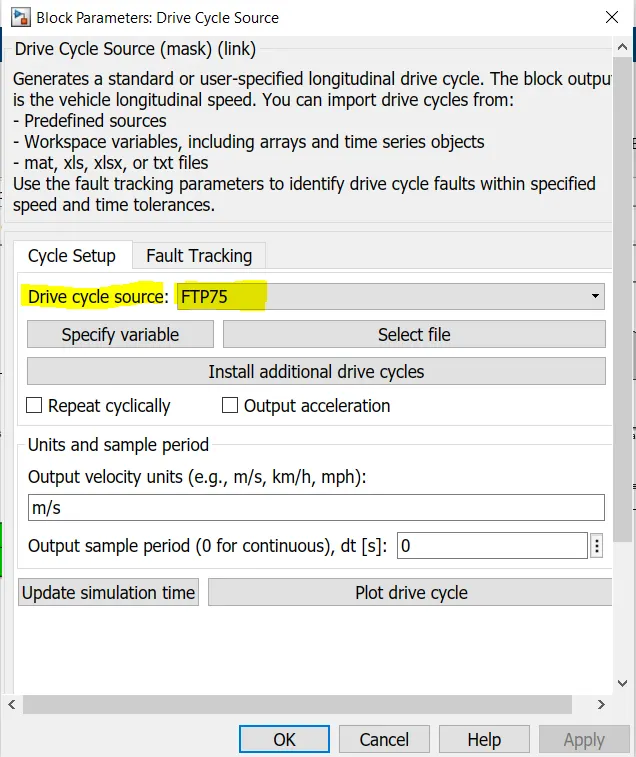
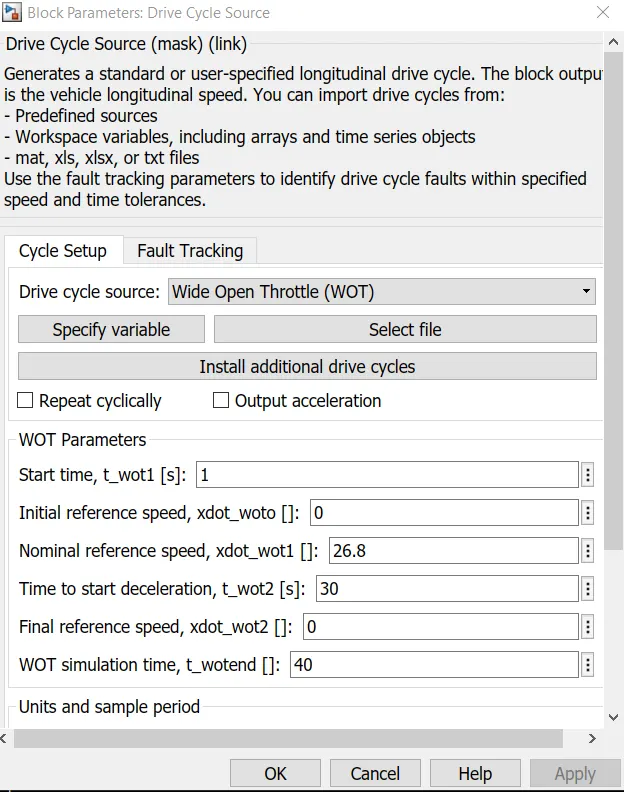
Now change the drive cycle source from 'FTP75' to 'WOT' by double clicking the tab.
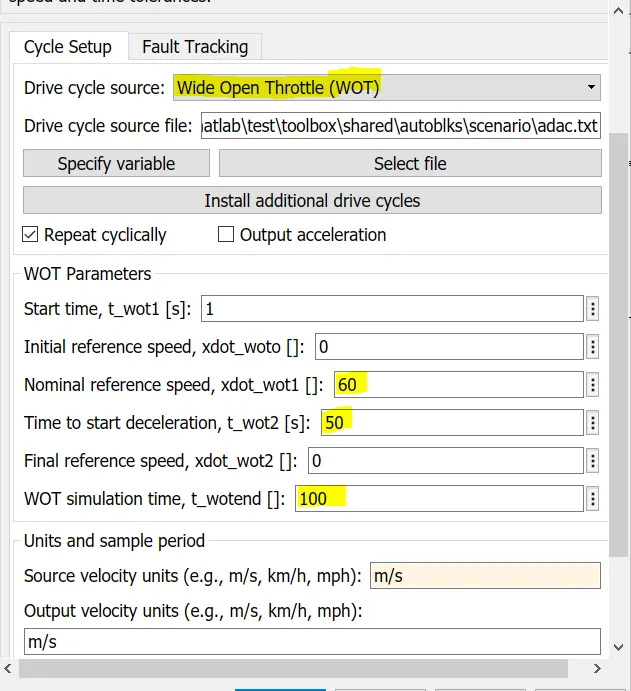
Nominal reference speed, time to start deceleration and simulation time is entered.
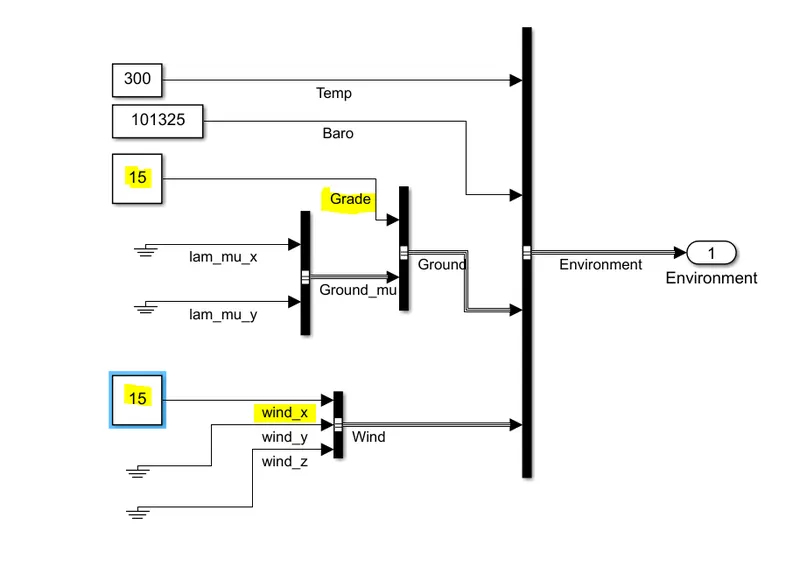
The environment conditions are entered where the grade and speed values are assumed to be zero.
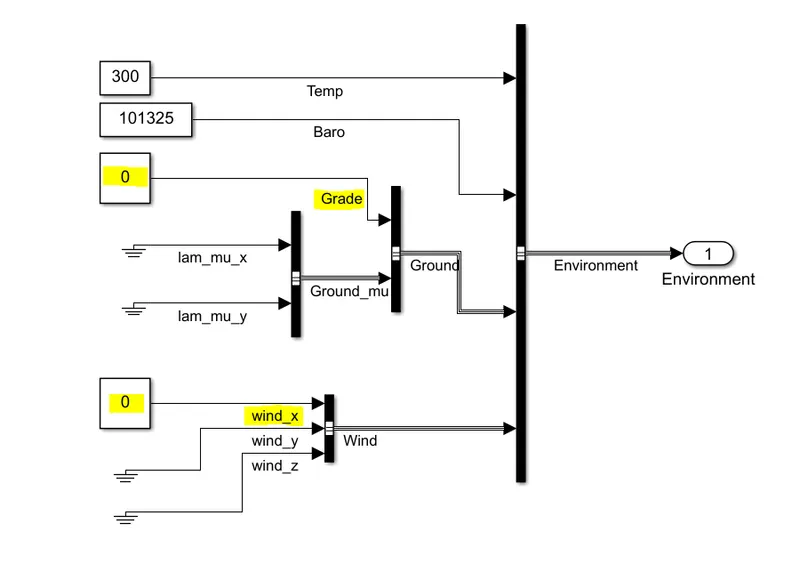
Now the simulation is made to run and results are observed.
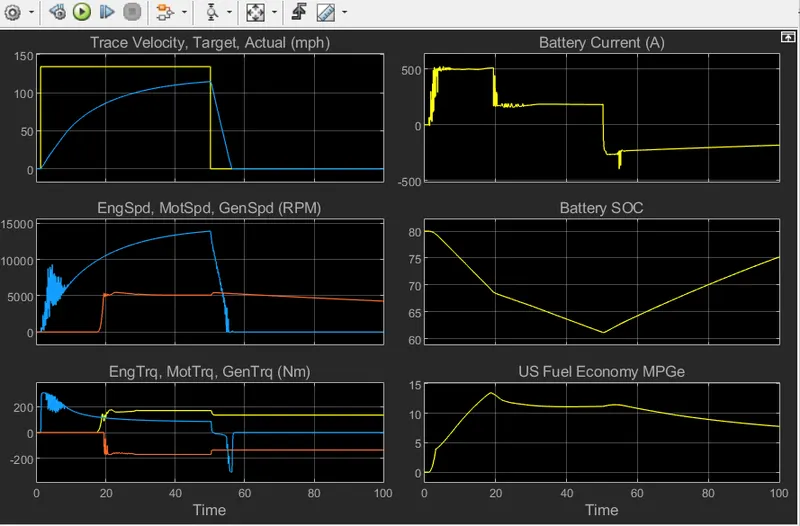
Grade = 0 and wind velocity = 0:
Grade = 10 degree and wind velocity = 5 m/s:
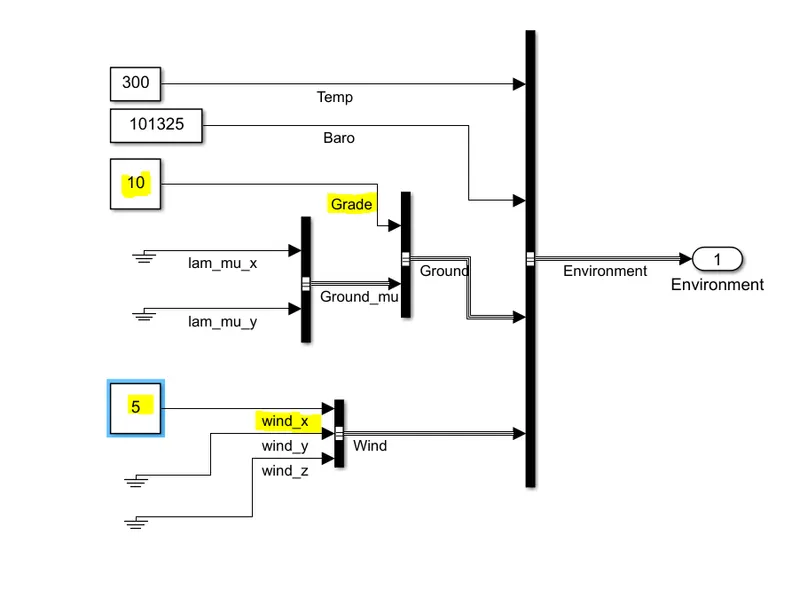
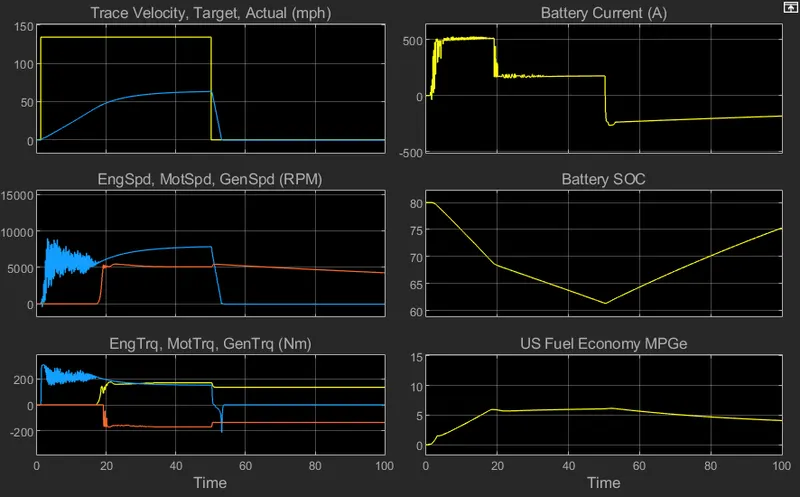
Result:
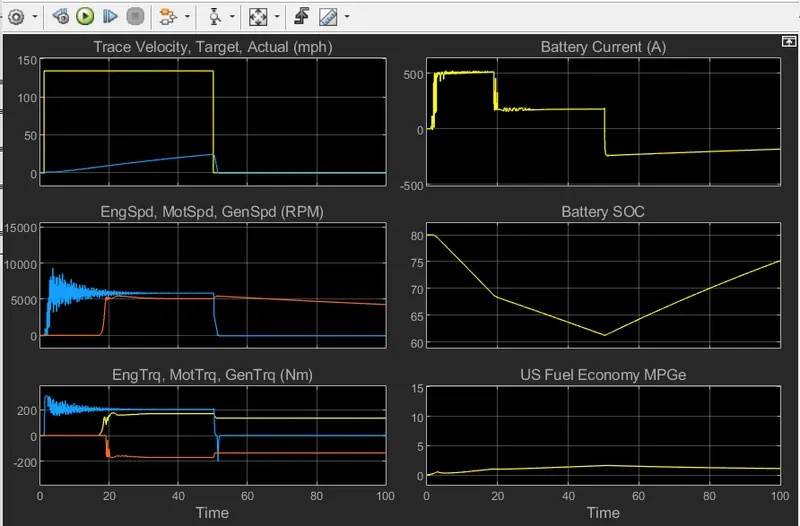
Grade = 15 degree and wind velocity = 15 m/s
Result:
Observations:
- It is observed that as the grade and wind velocity increases, the peak velocity decreases.
- The fuel consumed becomes less as the gradeability and wind force increases since the distance travelled is less as the velocity is low.
- The battery current consumption takes peak value as the acceleration is applied and drops during deceleration.
- As the wind velocity and grade increases, the accleration is reduced thus deceleration is also reduced. So decelerating time is reduced. Thus charging capacity of the battery is also reduced.
- The battery SOC remains same irrespective of the environment conditions.
- Motor RPM is higher than engine RPM during accleration and decreases as the gradeability and wind velocity increases and motor torque also decreases as the environmental factors increases.
4. Comparision of the simulated results of hybrid and pure electric powertrains, keeping all the other parameters same:
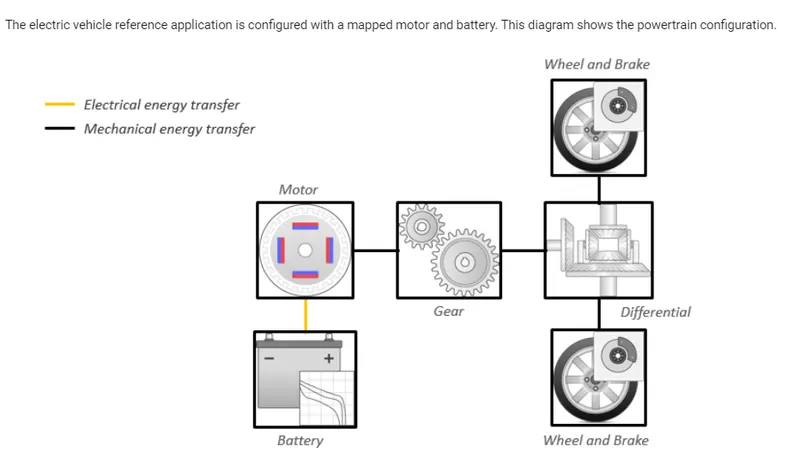
Open EV model from help section. The EV model configuration is as shown below.
Now run the simulation with wide open throttle condition leaving the other parameters same.
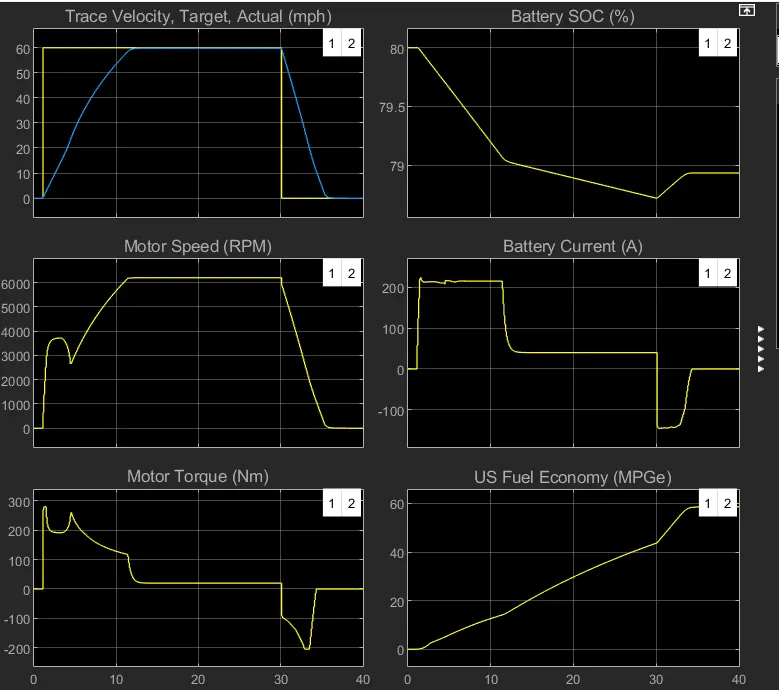
Simulation result of EV Reference application:
HEV Multimode reference application:
Configuration of HEV:
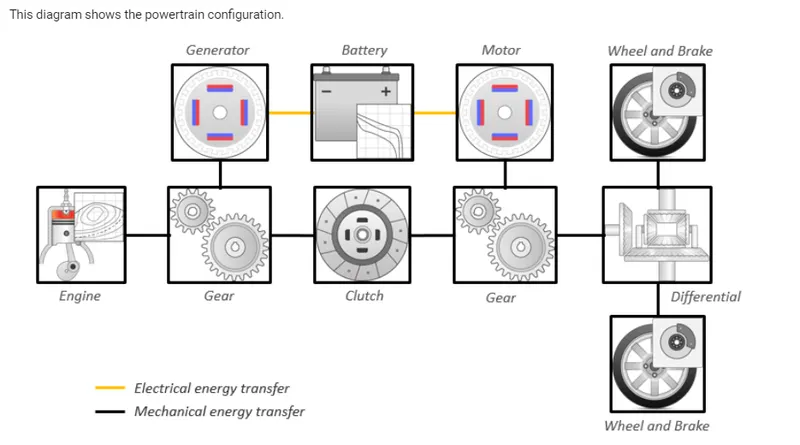
In HEV also, the drive cycle source is changed to WOT by keeping the other parameters same as for EV powertrain.
Then, the simulation is made to run.
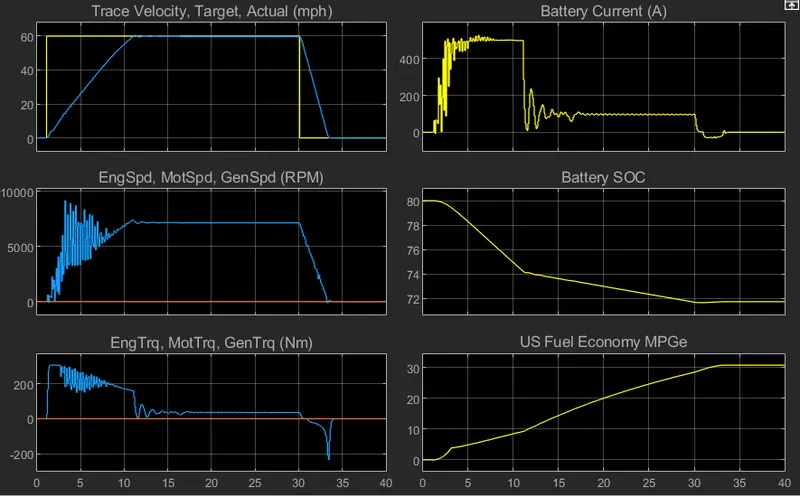
Simulation result of HEV Reference application:
Comparision:
HEV EV
Observations:
- The battery SOC is higher for EV compared to HEV since the HEV has engine and battery both which makes the system bulky. So more power is needed to reach the peak velocity. Whereas EV lesser in weight of the system requires less energy to reach the peak value.
- The current consumption from battery by the EV is less than the HEV. More the energy consumption implies more the current consumption.
- MPGa calculates how much miles per gallon of equivalant energy of battery is used. The US fuel economy (MPGa) is higher for EV compared to HEV since the EV runs the vehicle purely electric. But in HEV, it run partially by engine, thus the MPGa value is low.
- The deceleration time for HEV is more since it has more moving parts and the mass of the system is higher compared to EV. So due to higher moment of inertia, it takes more time to decelerate.
CONCLUSION:
- Thus the difference between the mapped and dynamic model of engine, motor and generator is listed and switching the model type is explained.
- Thus the calculation of the model in miles per gallon is explained and the factors that are considered to the model fuel flow is listed.
- The HEV ReferenceApplication with WOT drive cycle is made to run and the grade and wind velocity in the environment block is changed and compared. It is concluded that aerodynamic drag force and gradeability force plays a vital role in reaching peak velocity and fuel consumption.
- The simulations of hybrid and pure electric powertrains is made to run and the results are compared. It can be concluded that
1. EV powertrain has better battery capacity than HEV.
2. In HEV top speed is more than pure EV since it uses two modes of powertrain (Engines and battery).
3. Overall, EV is efficient than HEV.