Project 1 - Parsing NASA thermodynamic data
AIM:
To write a function that extracts the 14 co-efficients and calculate the enthalpy, entropy and specific heats for all the species in the NASA Thermodynamic data file and to calculate the molecular weight of each species and display it in the command window.
PARSING:
The process of "parsing" can be described as reading in a data stream of some sort and building an in-memory model or representation of the semantic content of that data, in order to facilitate performing some kind of transformation on the data.
GOVERNING EQUATIONS:
- Cp = R*((a1) + (a2)*(T) + (a3)*(T).^2 + (a4)*(T).^3 + (a5)*(T).^4);
- H = R*(T)*((a1) + (a2)*(T)/2 + ((a3)*((T).^2)/3) + ((a4)*((T).^3)/4) + ((a5)*((T).^4)/5) + (a6)/(T));
- S = R*(a1*(log(T)) + a2*T + a3*(T.^2)/2 + (a4*(T)^3)/3 + (a5*(T)^4)/4 + a7);
where,
Cp = Specific heat [kJ/kgK]
H = Enthalpy [kJ/kg]
S = Entropy [kJ/kg]
a1,a2,a3,a4,a5,a6,a7 = high temperature co-efficients
a8,a9,a10,a11,a12,a13,a14 = low temperature co-efficients
T = Temperature [K]
OBJECTIVES OF THE PROJECT:
- To write a function that extracts the 14 co-efficients and calculate the enthalpy, entropy and specific heats for all the species in the NASA thermodynamic data file and to calculate the molecular weight of each species and display it in the command window.
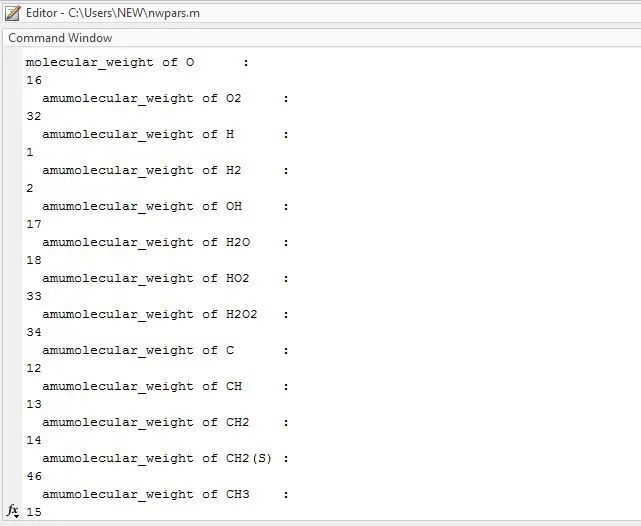
- To calculate the molecular weight of each species and display it in the command window.
- To plot the Cp, Enthalpy and Entropy for the local temperature range (low temperature : high temperature) specific for each species.
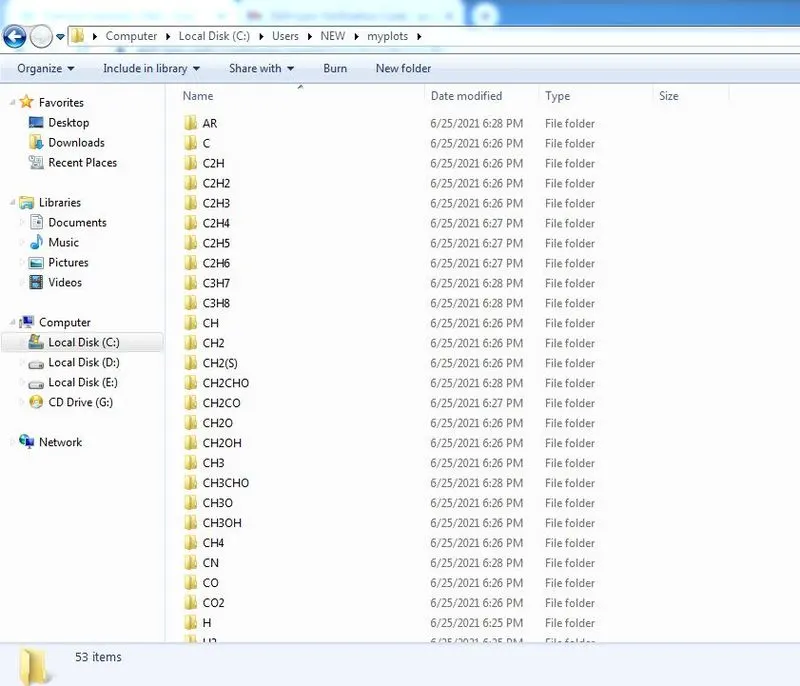
- To save the plots as images with appropriate names and dump them in separate folders for each species with suitable name.
- To take the screenshot of the window where all the folders are saved.
- To submit the plots for O2, N2 and CO2.
BODY OF CONTENT:
Main program for file parsing:
close all
clear all
clc

f1 = fopen('THERMO.dat','r');

% finding the number of lines
no_line = fgetl(f1);
 ct = 1;
while strcmp(no_line,'END') == 0;
    no_line = fgetl(f1);
    ct = ct+1;
end
% finding no of species
n_iteration = (ct-6)/4;
frewind(f1)
% skipping the above unwanted data
a = fgetl(f1);
a = fgetl(f1);
a = fgetl(f1);
a = fgetl(f1);
a = fgetl(f1);

for i = 1:n_iteration

% finding the required line
line6 = fgetl(f1);

% finding the required position of 'G'
G = findstr(line6,'G');

% (G position = 45)
% starting position of local temperature = G+3 position( = 45+3=48)
% finding the local temperature as a string
t = line6(48:end-5);

% finding the position of the species name
species_name = line6(1:7);
%mol_wei(i) = mol_wt_fn(species_name);

% finding the molecular weight
species = upper(species_name);
constituents = {'H', 'C', 'S', 'O', 'N', 'A'};
atomic_weight = [1 12 32 16 14 40];

molecular_weight = 0;
for i = 1 : length(species);
    for j = 1:length(constituents);
        if strcmp(species(i),constituents(j));
            molecular_weight = molecular_weight + atomic_weight(j);
            u = j;
        end
    end

    n = str2double(species(i));
    if n > 1
        molecular_weight = molecular_weight + atomic_weight(u)*(n-1);
    end
end

fprintf('molecular_weight of %s: \n',species_name);
fprintf('%d \n',molecular_weight);
fprintf('  ');
fprintf('amu');

% finding local temperature as a number
temp = strsplit(t,'  ');
t1 = str2num(temp{1});
t2 = str2num(temp{2});
t3 = str2num(temp{3});

% finding temperature position
Tlow = t1;
Tmid = t3;
Thigh = t2;

%finding the coefficients
line7 = fgetl(f1);
E = findstr(line7,'E');

a1 = line7(1:E(1)+3);
a2 = line7(E(1)+4:E(2)+3);
a3 = line7(E(2)+4:E(3)+3);
a4 = line7(E(3)+4:E(4)+3);
a5 = line7(E(4)+4:E(5)+3);


a1 = str2num(a1);
a2 = str2num(a2);
a3 = str2num(a3);
a4 = str2num(a4);
a5 = str2num(a5);

line8 = fgetl(f1);
E1 = findstr(line8,'E');

a6 = line8(1:E1(1)+3);
a7 = line8(E1(1)+4:E1(2)+3);
a8 = line8(E1(2)+4:E1(3)+3);
a9 = line8(E1(3)+4:E1(4)+3);
a10 = line8(E1(4)+4:E1(5)+3);

a6 = str2num(a6);
a7 = str2num(a7);
a8 = str2num(a8);
a9 = str2num(a9);
a10 = str2num(a10);


line9 = fgetl(f1);
E2 = findstr(line9,'E');

a11 = line9(1:E2(1)+3);
a12 = line9(E2(1)+4:E2(2)+3);
a13 = line9(E2(2)+4:E2(3)+3);
a14 = line9(E2(3)+4:E2(4)+3);


a11 = str2num(a11);
a12 = str2num(a12);
a13 = str2num(a13);
a14 = str2num(a14);


T = linspace(Tlow,Thigh,1000);

for j = 1 : length(T)

% here 'R' = universal gas constant
R = 8.314;

if T(j) > Tmid

    % finding Enthalpy,Entropy,Specific heat
    Cp(j) = R*((a1) + (a2)*(T(j)) + (a3)*(T(j)).^2 + (a4)*(T(j)).^3 + (a5)*(T(j)).^4);

    H(j) = R*(T(j))*((a1) + (a2)*(T(j))/2 + ((a3)*((T(j)).^2)/3) + ((a4)*((T(j)).^3)/4) + ((a5)*((T(j)).^4)/5) + (a6)/(T(j)));

    S(j) = R*(a1*(log(T(j))) + a2*T(j) + a3*(T(j).^2)/2 + (a4*(T(j))^3)/3 + (a5*(T(j))^4)/4 + a7);

else

    Cp(j) = R*((a8) + (a9)*(T(j)) + (a10)*(T(j)).^2 + (a11)*(T(j)).^3 + (a12)*(T(j)).^4);

    H(j) = R*(T(j))*((a8) + (a9)*(T(j))/2 + ((a10)*((T(j)).^2)/3) + ((a11)*((T(j)).^3)/4) + ((a12)*((T(j)).^4)/5) + (a13)/(T(j)));

    S(j) =R*(a8*(log(T(j))) + a9*T(j) + a10*(T(j).^2)/2 + (a11*(T(j))^3)/3 + (a12*(T(j))^4)/4 + a14);


end

end

mkdir(['C:\Users\NEW\myplots\',species])

figure(1)
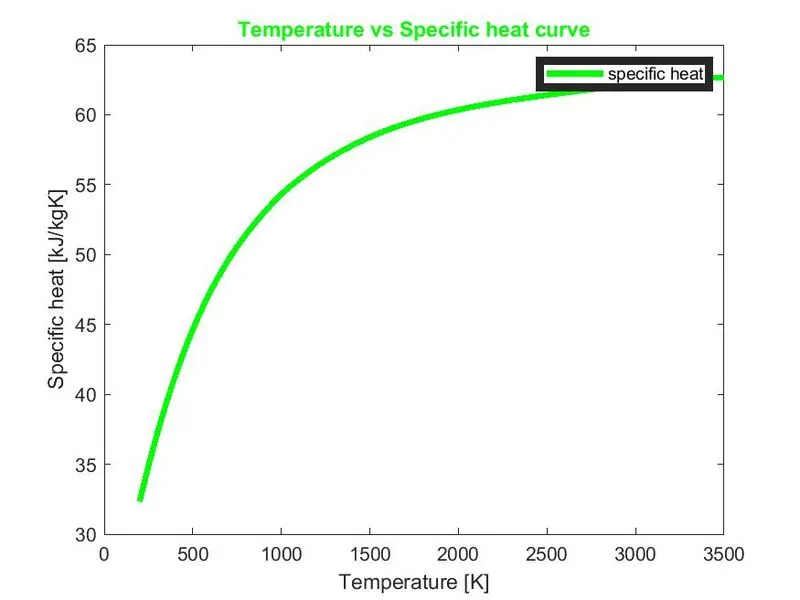
plot(T,Cp,'color','g','linewidth',3)
title('Temperature vs Specific heat curve','color','g','linewidth',6)
xlabel('Temperature [K]')
ylabel('Specific heat [kJ/kgK]')
legend('specific heat','color','g','linewidth',4)


figure(2)
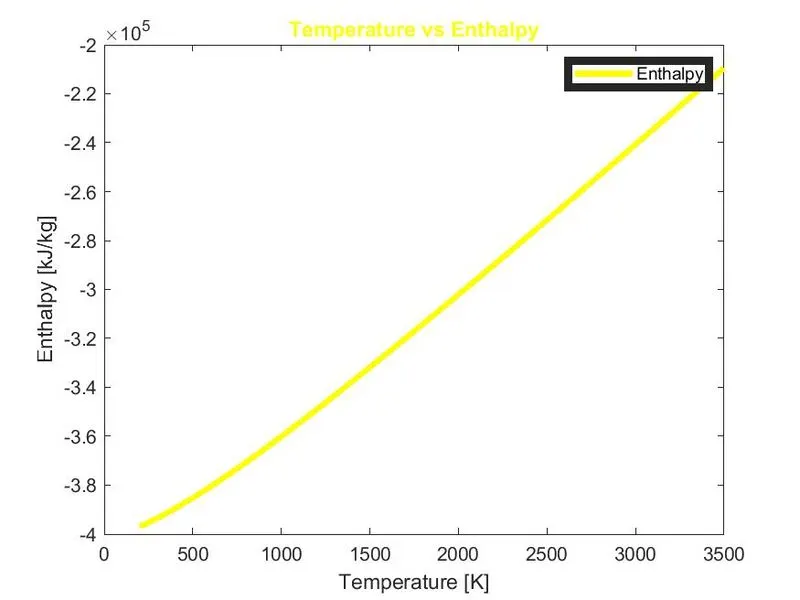
plot(T,H,'color','y','linewidth',3)
title('Temperature vs Enthalpy','color','y','linewidth',6)
xlabel('Temperature [K]')
ylabel('Enthalpy [kJ/kg]')
legend('Enthalpy','color','y','linewidth',4)


figure(3)
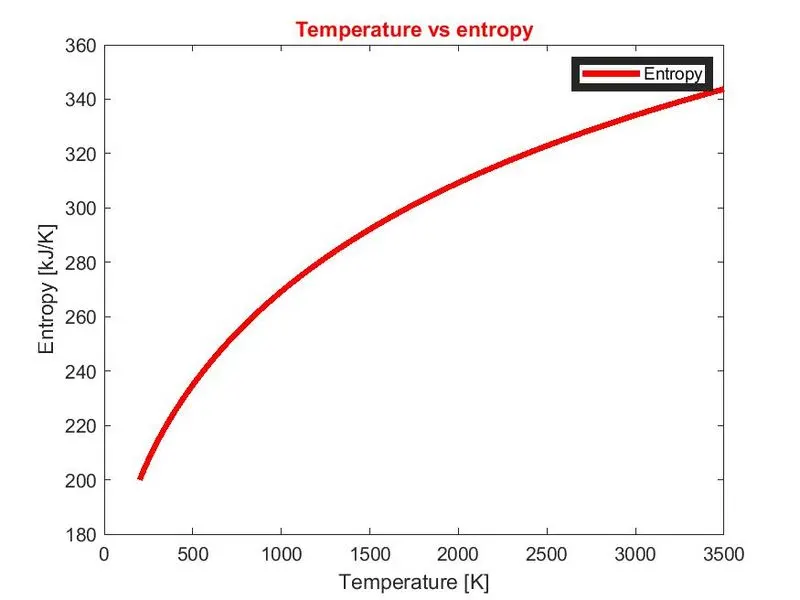
plot(T,S,'color','r','linewidth',3)
title('Temperature vs entropy','color','r','linewidth',6)
xlabel('Temperature [K]')
ylabel('Entropy [kJ/K]')
legend('Entropy','color','r','linewidth',4)

cd(['C:\Users\NEW\myplots\',species])

saveas(1,'T vs Cp','jpg');
saveas(2,'T vs H','jpg');
saveas(3,'T vs S','jpg');

end
Explanation:
Extracting the data:
The primary objective of this code is to extract the thermodynamic data from the given NASA thermodynamic data file. To open the file, use ‘fopen’ command.
Syntax: fileID = fopen(filename,permission)
The first 5 lines just display the content and heading of the thermodynamic data file which is not required in the present project. So in order to skip those lines, use ‘fgetl’ command.
Syntax: tline = fgetl(fileID)
Finding no of species:
To identify the number of iterations required to extract the data for each species, first the number of lines has to be found. The given thermodynamic data follows a specific pattern of arrangements of the data for each species in which each species has exactly equal to 4 lines. So the total number of iterations can be calculated by the formula as shown below.
number of iterations = ((number of lines) – 6)/4
Finding the number of lines:
Here there are 6 unwanted lines. So ‘6’ is subtracted from the total number of lines. To find the number of lines present in the file, first ‘fgetl’ command is used to take the location to the first line of the data. Then the variable ‘ct’ is initiated as 1 which is counted as first line of the file. The last line of the file consists of the string ‘END’ which is end of the file and this string is nowhere located in the file. The ‘strcmp’ command is used to compare 2 variables/strings. It is a comparative operator.
Syntax: tf = strcmp(s1,s2)
So each line is compared with ‘END’ string inside a while loop and counter is added by ‘1’. The moment when it reaches the last line, the string ‘END’ is found and the loop is stopped. The total number of lines is the counted value and it is substituted in the formula to get the number of iterations.
Then ‘frewind’ command is used to take the location of the pointer to the first line.
Syntax : frewind(fileID)
Skipping the unwanted data:
Now the first 5 unwanted lines are skipped using ‘fgetl’ command and the ‘for’ loop is generated from the 6th line starting from the 1st iteration to the number of iteration that is calculated above.
Finding the local temperature data as a string:
Now to extract the local temperature ranges, its location has to be traced in the 6th line which is next to the string ‘G’. The location of the string ‘G’ is found by using ‘findstr’ command.
Syntax : k = findstr(str1, str2)
Converting the string to numbers:
Now the local temperature data are extracted which starts from 3rd position from the location of string ‘G’. But the extracted data is stored in the form of strings even though they are numbers. This has to be converted as numbers to the MATLAB using ‘str2num’ command.
Syntax : X = str2num(chr)
Then ‘t1’ is saved as ‘Tlow’, ‘t3’ is saved as ‘Tmid’, ‘t2’ is saved as ‘Thigh’.
Finding the position of the species name:
Now the position of the species name is to be found which is the starting position of the array in that particular line. So the 1st 7 position of the ‘line6’ is to be extracted as species name.
Calculating the molecular weight of each species:
Then molecular weight of the species has to be found. The characters of the species has to be converted to upper case using ‘upper’ command.
Syntax : newStr = upper(str)
There are totally 6 elements that is mentioned in the given species of data. The elements and its molecular weight are given as array separately. Then the species and the elements are compared using ‘strcmp’ command inside the ‘for’ loop. If the comparison matches, then it moves to the next line which contains molecular weight of that particular element in that particular position in the array which the MATLAB extracts the data from it and assigns the value for that respective element in the species. Then its iteration value is noted as ‘u’ . If there is any numerical operator which is greater than 1 for a particular element, the following formula has to be applied inside the loop.
molecular_weight = molecular_weight + atomic_weight(u)*(n-1)
Then the species name and molecular weight has to be displayed using ‘printf’ command.
Extracting the coefficients:
The coefficients of the particular species is extracted using ‘findstr’ command and it has to be converted into number using ‘str2num’ command as explained in previous process. This loop is repeated for all the 53 species.
Finding Enthalpy,Entropy,Specific heat:
Enthalpy, Entropy and Specific heat are calculated using the above governing equations. But it has to be calculated for each species. Enthalpy, entropy and Specific heat are the function of temperature and constants.
So ‘linspace’ command is given for low temperature to high temperature values. 1st 7 co-efficient are for high temperature co-efficient and for the rest low and mid temperature co-efficient. So a loop is generated using ‘if’ statement where if ‘T>Tmid’, first 7 coefficients are used.
Saving the plots in folder:
The plots for ‘Cp vs T’,’H vs T’ and ’S vs T’ are plotted using ‘plot’ command for each species and saved in a directory using ‘mkdir’ command.
Syntax : mkdir(___)
Then after saving the plots for each species in a separate folder, the next folder has to be created for storing the plots for the next iteration. This is done using ‘cd’ command.
Syntax : cd(newFolder)
Then the plots in the folder is saved using ‘saveas’ command.
Syntax : saveas(fig,filename,formattype)
Then finally the loop is ended. Then it proceed for next iterations.
Errors faced:
- While making the directory for dumping all the plots in a folder with the sub folder for each species, the ‘\’ is missed while entering the path of the folder at the end as shown below.
mkdir(['C:\Users\NEW\nw plots',species]) instead of
mkdir(['C:\Users\NEW\nw plots\',species]). This resulted in saving the plots outside the folder. - The plots for ‘T vs Cp’,’T vs H’ and ’T vs S’ are coded outside the loop initially. So while executing the code, only the plots for the 1st iteration is displayed. Then the code for plots for all species is executed inside the loop and corrected.
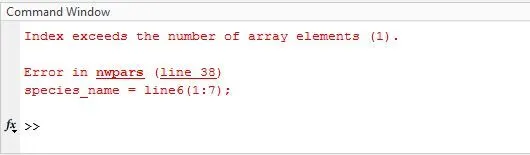
- While executing the code for Cp,H and S, in the formula the scalar single value is given whereas in the ‘if’ condition, for ‘T’ values array of elements is compared as ‘linspace’ command is used. So the command window displayed the error that ‘Unable to perform the assignment because the indices on the left is not compatible to the size on the right side.’ Then it has been corrected.

- While calculating the number of iterations required, the ‘frewind’ command is failed to enter at the end of ‘while’ loop. So the system calculated the number of iterations required using the formula entered but it couldn’t pick the correct lines in the data file as mentioned in the program and thus it couldn’t proceed further. Then the command is entered and the results for all the species is executed.
Folder containing plots for Temperature variation with respect to Enthalpy, Entropy and Specific heat for each species:
RESULT:
Molecular weight for each species in command window:
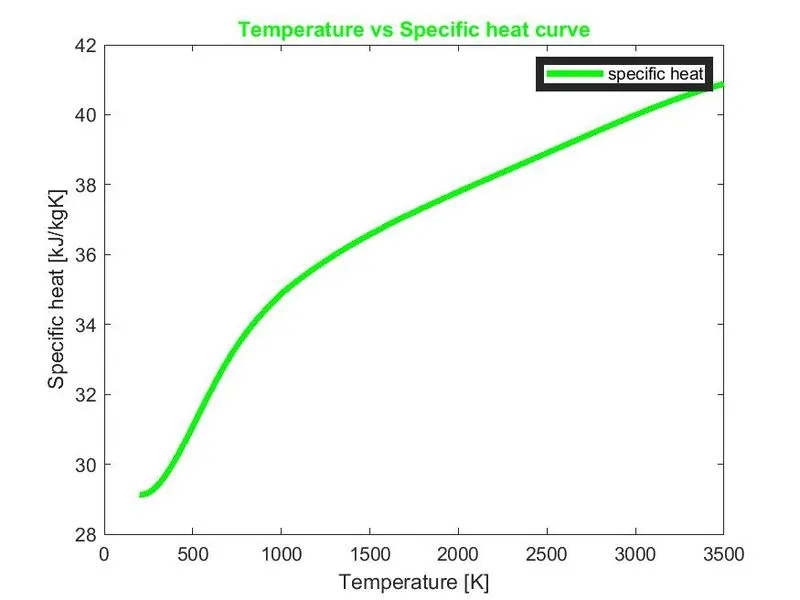
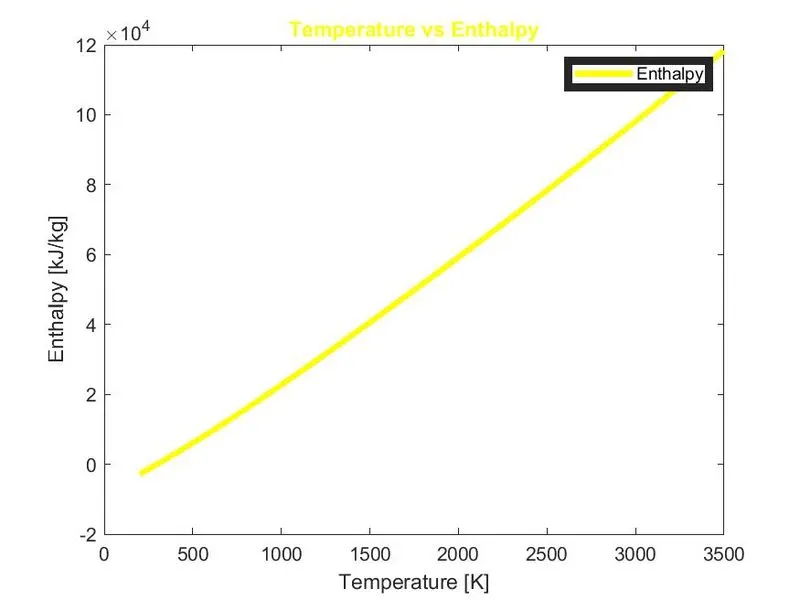
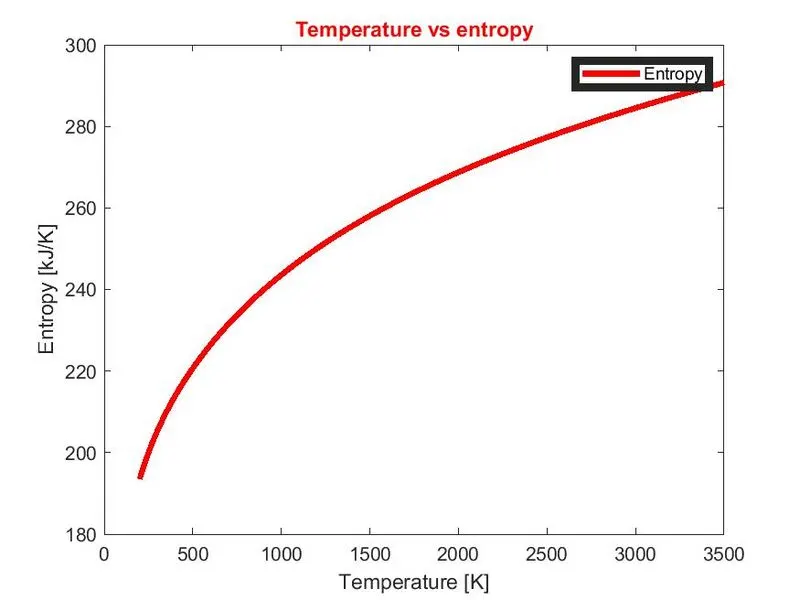
Plots for O2 :
Temperature vs Specific heat:
Temperature vs Enthalpy:
Temperature vs Entropy:
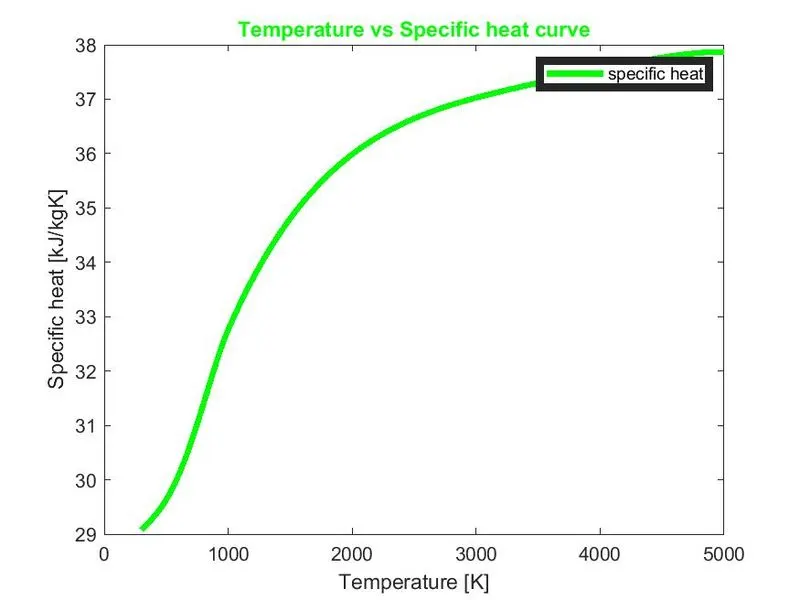
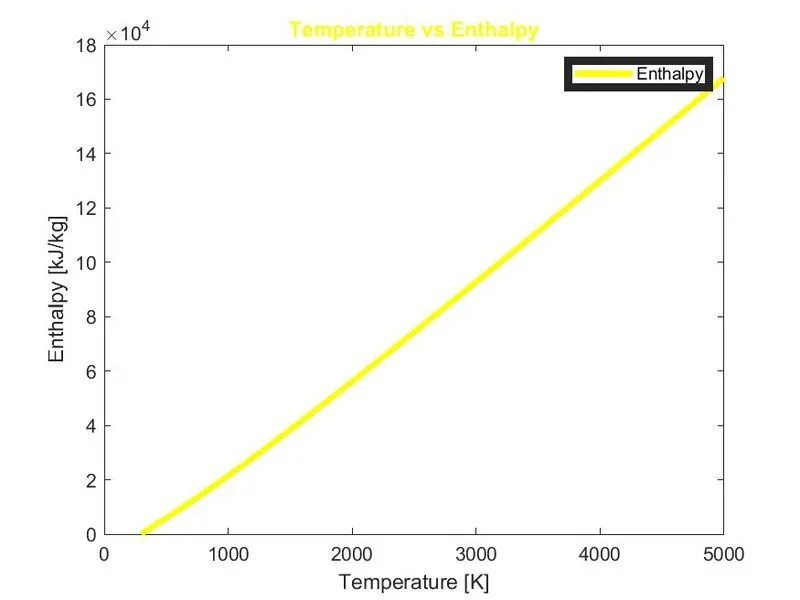
Plots for N2 :
Temperature vs Specific heat:
Temperature vs Enthalpy:
Temperature vs Entropy :
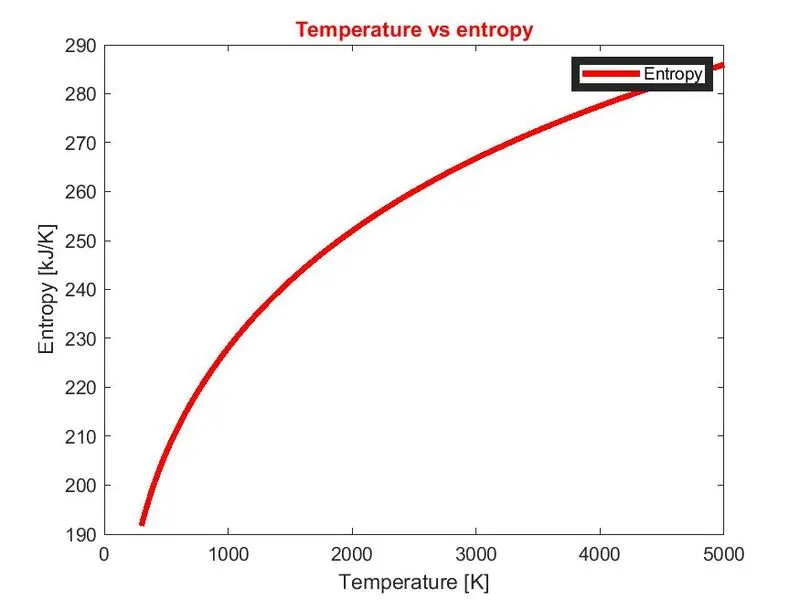
Plots for CO2:
Temperature vs Specific heat:
Temperature vs Enthalpy:
Temperature vs Entropy :
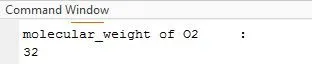
Molecular weight of N2,O2 and CO2


CONCLUSION:
Thus, the data from the NASA Thermodynamic data file is extracted and the Enthalpy,Entropy and the Specific heat is calculated for each species from the given extracted data which contains coefficients and local temperature ranges which is unique for each species and graph for the Temperature ranges vs Enthalpy, Entropy and Specific heat is plotted and saved in a folder which contains plots for each species in a sub folder.
It is noted from the plots that the graph for the enthalpy line is almost linear for most of the species. It is concluded that the contents from the file can be extracted from any data file using MATLAB coding and calculations can also be performed from those extracted data without any manual input and effort using MATLAB inspite the data content is long enough in a short span of time.
REFERENCE:
- https://drive.google.com/file/d/1AikCHDlz9s_fu8whE81qee_GD4AyYpCP/view?usp=sharing
- http://matlab.izmiran.ru/help/techdoc/ref/frewind.html
- https://www.mathworks.com/help/matlab/ref/cd.html#:~:text=cd%20displays%20the%20current%20folder,%C2%AE%20finishes%20executing%20the%20function.
- https://www.mathworks.com/matlabcentral/answers/106320-make-a-loop-to-calculate-molecular-weight
- https://www.mathworks.com/support/search.html?q=mkdir&page=1