Project 2 - Rankine cycle Simulator
AIM:
To create a Rankine Cycle Simulator using MATLAB and to make T-s and h-s plots for the given set of inputs.
GOVERNING EQUATIONS:
- Dryness fraction: [x]
x = (s2 - sf)/(sg - sf)
where,
s2 = Entropy at the exit of the turbine [kJ/kg]
sf = Saturated liquid Entropy [kJ/kg]
sg = Saturated vapour entropy [kJ/kg] - Entropy of superheated steam
s = sg + Cp*(ln(T/Tsat)
where,
s = Entropy of superheated steam [kJ/kg]
sg = Saturated vapour entropy [kJ/kg]
Cp = Specific heat of superheated steam [kJ/kg-K]
T = Temperature of superheated steam [°C (or) K]
Tsat = Saturated temperature of vapor for that particular pressure [°C (or) K] - Pump work [Wp]
Wp = v3*(p4-p3) [kJ/kg]
where,
v3 = specific volume at the inlet to the pump [m3/kg]
p4 = Pressure at the exit of the pump [bar]
p3 = Pressure at the inlet of the pump [bar] - Turbine work [Wt]
Wt = h1 – h2 [kJ/kg]
where,
h1 = Enthalpy at inlet to turbine [kJ/kg]
h2 = Enthalpy at exit to turbine [kJ/kg] - Net work [Wnet]
Wnet = Wt -Wp - Heat Supplied [Qs]
Qs = h1 – h4 [kJ/kg]
where,
h1 = Enthalpy at inlet to turbine [kJ/kg]
h4 = Enthalpy at exit to pump [kJ/kg] - Back work ratio [bwr]
bwr = Wp/Wt - Thermal efficiency [η]
η = (Wnet)/Qs - Specific Steam Consumption [SSC]
SSC = 3600/( Wnet) [kg/kW-hr]
OBJECTIVES OF THE PROJECT:
- To create a Rankine cycle Simulator using MATLAB.
- To calculate the state points of the Rankine cycle based on user inputs.
- To plot the corresponding T-s and h-s plots for the given set of inputs.
- To make a report explaining the working of a Rankine cycle simulator.
BODY OF CONTENT:
Rankine cycle:
The Rankine cycle is an idealized thermodynamic cycle describing the process by which certain heat engines, such as steam turbines or reciprocating steam engines, allow mechanical work to be extracted from a fluid as it moves between a heat source and heat sink.
Heat energy is supplied to the system via a boiler where the working fluid (typically water) is converted to a high pressure gaseous state (steam) in order to turn a turbine. After passing over the turbine the fluid is allowed to condense back into a liquid state as waste heat energy is rejected before being returned to boiler, completing the cycle. Friction losses throughout the system are often neglected for the purpose of simplifying calculations as such losses are usually much less significant than thermodynamic losses, especially in larger systems.
Assumptions in Rankine cycle:
- The flow in Rankine cycle is assumed to be a Steady flow.
- Kinetic energy and potential energy changes are neglected.
Processes in Rankine cycle:
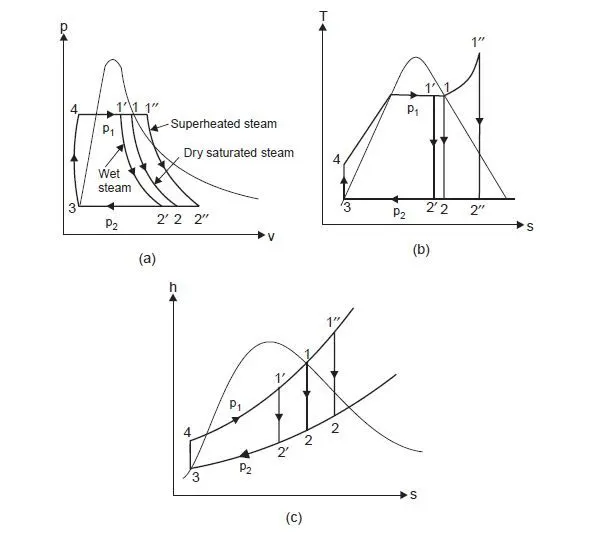
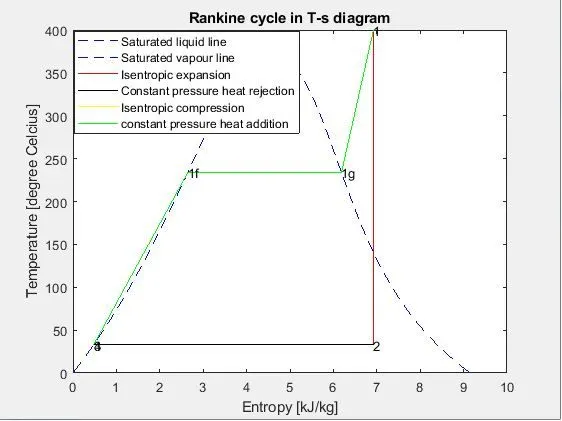
There are four processes in the Rankine cycle. The states are identified by numbers (in brown) in the T-S diagram
- Process 1-2: The dry saturated vapour expands through a turbine, generating power. This decreases the temperature and pressure of the vapour, and some condensation may occur. The output in this process can be easily calculated using the chart or tables noted above.
In other words, Process 1-2 is [Isentropic expansion]
Wt = h1 – h2 [kJ/kg]
where,
h1 = Enthalpy at inlet to turbine [kJ/kg]
h2 = Enthalpy at exit to turbine [kJ/kg]
- Process 2-3: The wet vapour then enters a condenser, where it is condensed at a constant pressure to become a saturated liquid.
In other words, Process 2-3 is [Constant pressure heat rejection in condenser]
Qr = h2 – h3
where,
Qr = Heat rejection in [kJ/kg]
h2 = Enthalpy at exit to turbine [kJ/kg]
h3 = Enthalpy at exit to condenser [kJ/kg]
- Process 3-4: The working fluid is pumped from low to high pressure. As the fluid is a liquid at this stage, the pump requires little input energy.
In other words, Process 3-4 is [Isentropic compression]
Pump work [Wp = vdP]
Wp = v3*(p4-p3) [kJ/kg]
where,
v3 = specific volume at the inlet to the pump [m3/kg]
p4 = Pressure at the exit of the pump [bar]
p3 = Pressure at the inlet of the pump [bar]
- Process 4-1: The high-pressure liquid enters a boiler, where it is heated at constant pressure by an external heat source to become a dry saturated vapour. The input energy required can be easily calculated graphically, using an enthalpy-entropy chart(h-s chart, or Mollier diagram), or numerically, using steam tables or software.
In other words, Process 4-1 is [Constant pressure heat addition in boiler]
Heat Supplied [Qs]
Qs = h1 – h4
where,
h1 = Enthalpy at inlet to turbine [kJ/kg]
h4 = Enthalpy at exit to pump [kJ/kg]
Rankine Flow chart:
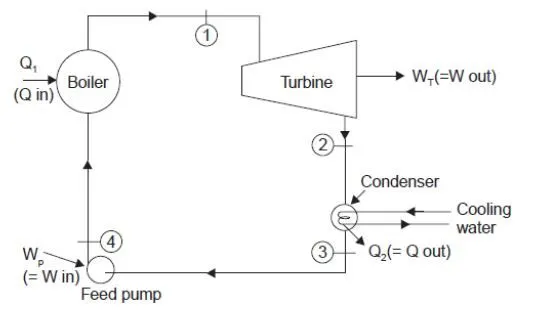
Rankine cycle in p-v, T-s and h-s chart :
Program:
close all
clear all
clc

%input of the state variables
t1 = input('Enter the inlet turbine temperature in degree celcius');
p1 = input('Enter the inlet turbine  pressure in bar');
p2 = input('Enter the turbine exit pressure in bar');

%invalid input condition
if t1 == 0;
    fprintf('The cycle cannot have %f as an input temperature for inlet to turbine');
else
    if p1 == 0;
        fprintf('The cycle cannot have %f as an input pressure for inlet to turbine');
    else

%specific heat at constanat pressure of super heated vapour at t1 [kJ/kg]
Cp1 = XSteam('Cp_pT',p1,t1);

%properties at state point 1
s1 = XSteam('s_pT',p1,t1);
t1sat = XSteam('Tsat_p',p1);
h1sat = XSteam('hV_p',p1);
h1 = XSteam('h_pT',p1,t1);
hf1 = XSteam('hL_p',p1);

sf1 = XSteam('sL_p',p1);
sg1 = XSteam('sV_p',p1);

fprintf('At state point 1:  \n')
fprintf('P1 is :%f bar \n',p1)
fprintf('T1 is :%f degree celcius \n',t1)
fprintf('S1 is :%f kJ/kg \n',s1)
fprintf('H1 is :%f kJ/kg \n',h1)
fprintf(' \n')

%properties at state point 2
t2sat = XSteam('Tsat_p',p2);
sg2 = XSteam('sV_p',p2);
hg2 = XSteam('hV_p',p2);
sf2 = XSteam('sL_p',p2);
hf2 = XSteam('hL_p',p2);
Cp2 = XSteam('CpV_p',p2);
s2 = s1;
%dryness fraction at state point 2
x = (s2-sf2)/(sg2-sf2);

%finding the exit temperature of turbine
if x>1
    t2 = (exp((s2-sg2)/Cp2))*(t2sat+273);
    t2 = t2-273;
else
    t2 = t2sat;
end

%Enthalpy at state point 2
h2 = hf2 + x*(hg2-hf2);

fprintf('At state point 2:  \n')
fprintf('P2 is :%f bar \n',p2)
fprintf('T2 is :%f degree celcius \n',t2)
fprintf('S2 is :%f kJ/kg \n',s2)
fprintf('H2 is :%f kJ/kg \n',h2)
fprintf('x2 is :%f \n',x)
fprintf(' \n')

%properties at state point 3
p3 = p2;
t3 = XSteam('Tsat_p',p2);
h3 = XSteam('hL_p',p2);
s3 = sf2;
v3 = XSteam('vL_p',p3);

fprintf('At state point 3:  \n')
fprintf('P3 is :%f bar \n',p3)
fprintf('T3 is :%f degree celcius \n',t3)
fprintf('S3 is :%f kJ/kg \n',s3)
fprintf('H3 is :%f kJ/kg \n',h3)
fprintf(' \n')

%properties at state point 4
p4 = p1;
s4 = s3;
v4 = XSteam('vL_p',p4);

%STATEMENTS for T4
t4 = XSteam('T_ps',p4,s4);

%pump work
Wp = (v3*(p4-p3))*100;
h4 = h3+Wp;

fprintf('At state point 4:  \n')
fprintf('P4 is :%f bar \n',p4)
fprintf('T4 is :%f degree celcius \n',t4)
fprintf('S4 is :%f kJ/kg \n',s4)
fprintf('H4 is :%f kJ/kg \n',h4)
fprintf(' \n')

%turbine work
Wt = h1 - h2;

%net work
Wnet = Wt - Wp;

%Back work ratio
bwr = (Wp)/(Wt);

%heat supplied
Qs = h1 - h4;

%thermal efficiency
eff = (Wnet)/Qs;

%Specific steam consumption
SSC = 3600/(Wnet);

fprintf(' \n')
fprintf('Wt is :%f kJ/kg \n',Wt)
fprintf('Wp is :%f kJ/kg \n',Wp)
fprintf('efficiency is :%f \n',eff)
fprintf('Wnet is :%f kJ/kg \n',Wnet)
fprintf('SSC is :%f kg/kW-hr \n',SSC)
fprintf(' \n')

%plotting
%extracting the saturated entropy and enthalpy values for respective temperature
temp = linspace(1,t1,5000);
for i = 1:length(temp);
    S_L(i) = XSteam('sL_T',temp(i));
    S_G(i) = XSteam('sV_T',temp(i));
    H_L(i) = XSteam('hL_T',temp(i));
    H_G(i) = XSteam('hV_T',temp(i));
end

figure(1)
%plotting saturated line in T-s diagram
plot(S_L,temp,'color','b','linestyle','--')
hold on
plot(S_G,temp,'color','b','linestyle','--')
hold on

%plotting Rankine cycle in T-s diagram

if x>1
   plot([s1 s2],[t1 t2],'color','r')
hold on
plot([s2 sg2],[t2 t2sat],'color','c')
hold on
plot([sg2 sf2],[t2sat t3],'color','k')
hold on
plot([s3 s4],[t3 t4],'color','y')
hold on
plot([s4 sf1],[t4 t1sat],'color','m')
hold on
plot([sf1 sg1],[t1sat t1sat],'color','m')
hold on
plot([sg1 s1],[t1sat t1],'color','m')
hold on

text(s1,t1,'1')
text(s2,t2,'2')
text(sg2,t2sat,'2s')
text(sf2,t3,'3')
text(s4,t4,'4')
text(sf1,t1sat,'1f')
text(sg1,t1sat,'1g')

title('Rankine cycle in T-s diagram')
xlabel('Entropy [kJ/kg]');
ylabel('Temperature [degree Celcius]')
legend('Saturated liquid line','Saturated vapour line','Isentropic expansion','heat rejected in the heat exchanger','Constant pressure heat rejection','Isentropic compression','constant pressure heat addition')

else

plot([s1 s2],[t1 t2],'color','r')
hold on
plot([s2 sf2],[t2sat t3],'color','k')
hold on
plot([s3 s4],[t3 t4],'color','y')
hold on
plot([s4 sf1],[t4 t1sat],'color','g')
hold on
plot([sf1 sg1],[t1sat t1sat],'color','g')
hold on
plot([sg1 s1],[t1sat t1],'color','g')
hold on

text(s1,t1,'1')
text(s2,t2,'2')
text(sf2,t3,'3')
text(s4,t4,'4')
text(sf1,t1sat,'1f')
text(sg1,t1sat,'1g')

title('Rankine cycle in T-s diagram')
xlabel('Entropy [kJ/kg]');
ylabel('Temperature [degree Celcius]')
legend('Saturated liquid line','Saturated vapour line','Isentropic expansion','Constant pressure heat rejection','Isentropic compression','constant pressure heat addition')
end

figure(2)
%plotting saturated line in h-s diagram
plot(S_L,H_L,'color','b','linestyle','--')
hold on
plot(S_G,H_G,'color','b','linestyle','--')
hold on

%plotting Rankine cycle in h-s diagram

if x>1
   plot([s1 s2],[h1 h2],'color','r')
hold on
plot([s2 sg2],[h2 hg2],'color','c')
hold on
plot([sg2 sf2],[hg2 h3],'color','k')
hold on
plot([s3 s4],[h3 h4],'color','y')
hold on
plot([s4 sf1],[h4 hf1],'color','m')
hold on
plot([sf1 sg1],[hf1 h1sat],'color','m')
hold on
plot([sg1 s1],[h1sat h1],'color','m')
hold on

text(s1,h1,'1')
text(s2,h2,'2')
text(sg2,hg2,'2s')
text(sf2,h3,'3')
text(s4,h4,'4')
text(sf1,hf1,'1f')
text(sg1,h1sat,'1g')

title('Rankine cycle in h-s diagram')
xlabel('Entropy [kJ/kg]');
ylabel('Enthalpy [kJ/kg]')
legend('Saturated liquid line','Saturated vapour line','Isentropic expansion','heat rejected in HX during expansion','Constant pressure heat rejection','Isentropic compression','constant pressure heat addition')

else

plot([s1 s2],[h1 h2],'color','r')
hold on
plot([s2 sf2],[h2 h3],'color','k')
hold on
plot([s3 s4],[h3 h4],'color','y')
hold on
plot([s4 sf1],[h4 hf1],'color','g')
hold on
plot([sf1 sg1],[hf1 h1sat],'color','g')
hold on
plot([sg1 s1],[h1sat h1],'color','g')
hold on

text(s1,h1,'1')
text(s2,h2,'2')
text(sf2,h3,'3')
text(s4,h4,'4')
text(sf1,hf1,'1f')
text(sg1,h1sat,'1g')


title('Rankine cycle in h-s diagram')
xlabel('Entropy [kJ/kg]')
ylabel('Enthalpy [kJ/kg]')
legend('Saturated liquid line','Saturated vapour line','Isentropic expansion','Constant pressure heat rejection','Isentropic compression','constant pressure heat addition')
end

    end
end
Explanation:
This program is written using ‘XSteam’ which is similar to steam table. The values that is required to this Rankine simulation is taken from the ‘XSteam’ for the required condition.
First the inputs are entered using ‘input’ command such as inlet turbine temperature, inlet turbine pressure and turbine exit pressure.
Then the Specific heat at ‘p1’ and ‘t1’ is calculated in the superheated region using ‘XSteam’ data.
Then the properties at state point 1 are extracted. The values of ‘t1sat’,’h1sat’,’h1’,’sf1’,’sg1’,’s1’ are extracted from the XSteam. Then the values of those are displayed in the command bar using ‘fprintf’ command.
Similarly, the properties at state point 2 are extracted as above. The values of ‘t2sat’,’hg2’,’h2’,’sf2’,’sg2’,’s2’,’hf2’,’Cp2’ are extracted. At state point 2, the dryness fraction is calculated using the above given formula. Using the dryness fraction the enthalpy at exit of turbine is calculated. Similarly the values are displayed using ‘fprintf’ command.
The above properties are calculated at the state point 3 and 4 also and displayed in the command window.
After extracting all the state point values, the other parameters such as net work, turbine work, pump work, thermal efficiency, specific steam consumption, heat supplied and back work ratio is calculated using the above mentioned equation.
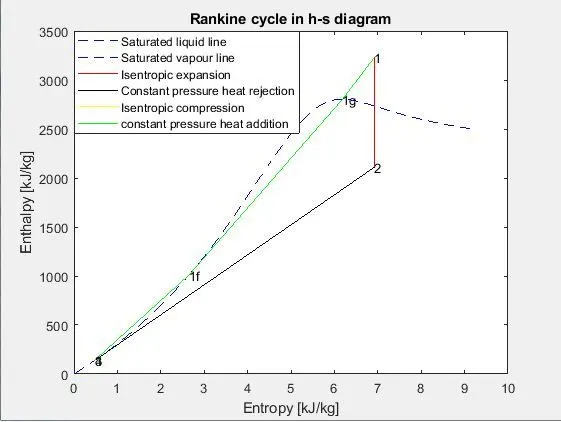
Finally the diagram of the Rankine cycle in T-s and h-s plots is done using ‘plot’ command. The axes labels, title and legend is inserted for those graphs.
For the saturated liquid and vapor line, the entropy and enthalpy values for all the temperature values from 0 to maximum is obtained using ‘linspace’ command and then the plot is done between the saturated liquid and vapor entropy and the temperature.
Inputs given in the command window:
The following inputs are to be entered as per the question.
Turbine Inlet temperature = 400° C
Turbine Inlet Pressure = 30 bars
Turbine Outlet Pressure = 0.05 bars = Condenser Inlet Pressure
Output displayed in the command window:
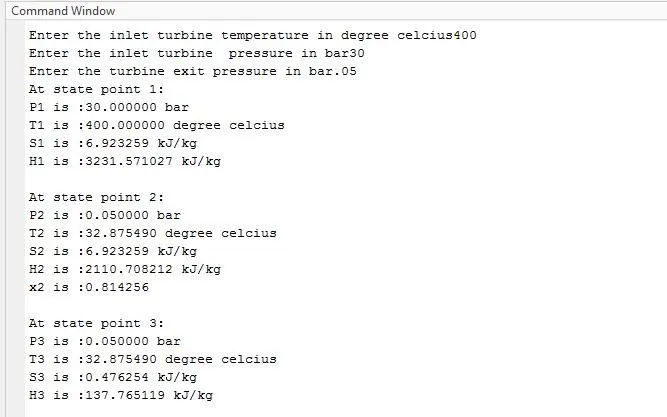
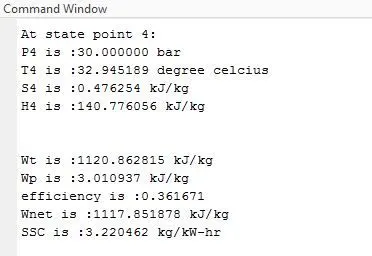
RESULTS:
T-S diagram for the given input:
H-S diagram for the given input:
Problems encountered:
After struggling for some time for getting saturated liquid and saturated vapour line, with the guidance from technical support in Skill-lync the curve is plotted in T-s and h-s diagram.
CONCLUSION:
Thus the Rankine cycle simulator is obtained using MATLAB by writing simple code where the values are extracted using 'XSteam' steam table and the result is obtained for the given values of input. From the output obtained above, the following points are concluded.
- As the Turbine work increases, the net work increases and pump work has negligible role to play in the net work output as well as efficiency.
- As the net work output increases, the Specific steam consumption increases resulting in reducing the size of the boiler.
Thus from the MATLAB, the state points for all the processes can be obtained for any value of inputs in addition with calculating the other parameters as well.
REFERENCE: