Week-4 Challenge WOT Condition Part-2
1)Difference between Mapped model and dynamic model of an engine ,motor & generator And how to change the model Type :
Mapped Model:
- The mapped model uses lookup tables to characterize the engine ,motor & generator performance .
- The lookup table provides overall Engine Motor & Generator characterestics such as actual torque, fuel flow rate& exhaust emission rate.
- It is used for quassi steady state Engine ,motor & generator Simulations.
Dynamic Model:
- The dynamic model converts the behaviour of the Engine ,motor & generator into Characterestics That are seperated into two lower level components.
- By combining the two lower level components the model captures the dynamic effects.
- It is used where a detailed model is needed and have component level datas.
- To analyze the impact of individual Engine,motor&generator components on the overall performance.
2) How does the model calculates the miles per gallons,& What are the factors considered to model fuel flow:
From the fuel flow volume it is conerted into cubic metres to gallons and the speed of the vehicle is converted from meter to miles and thus the miles per gallons is calculated in the model.
On the other hand the charge from the battery is been converted from ampere hours to watt hours and compared with the speed and thus 33.75 kilowatt hour of battery power is considered as equivalent to 1 gallons of gasoline.
Thus the miles per gallon is calculated in the model.
Factors considered to model fuel flow :
Fuel injection pressure and fuel injection timings are the main factors considered to model fuel flow volume.
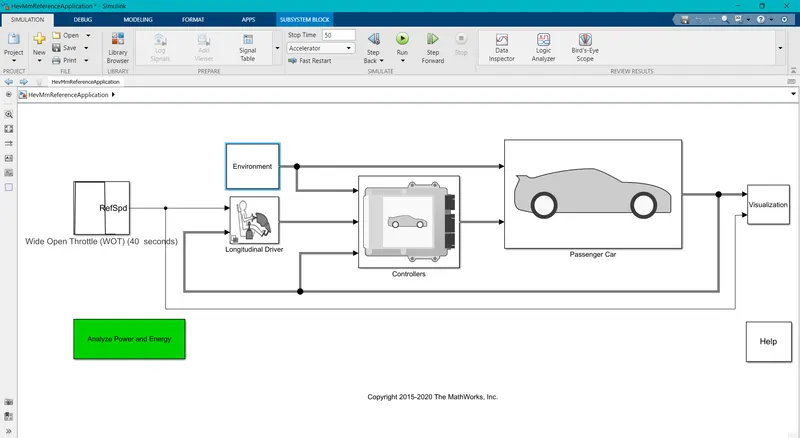
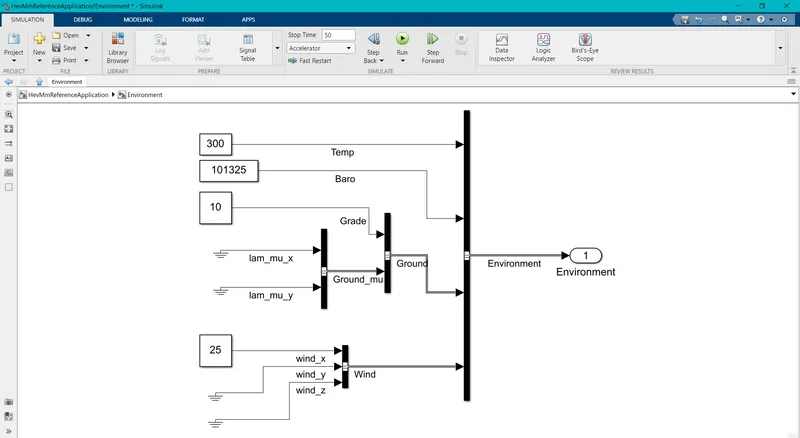
3) Aim:To run the HEV Reference Application with WOT drive cycle & Change the grade and wind velocity in the environment block and visualize the output graphs.
Hev reference application:
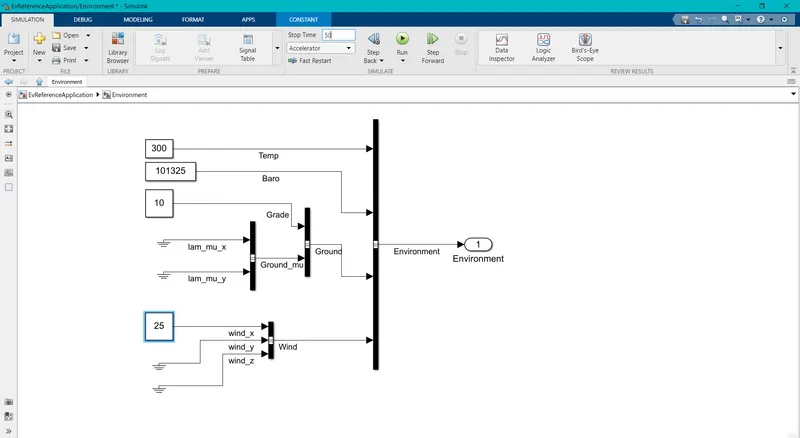
Change in grade and wind velocity in enviroinment block:
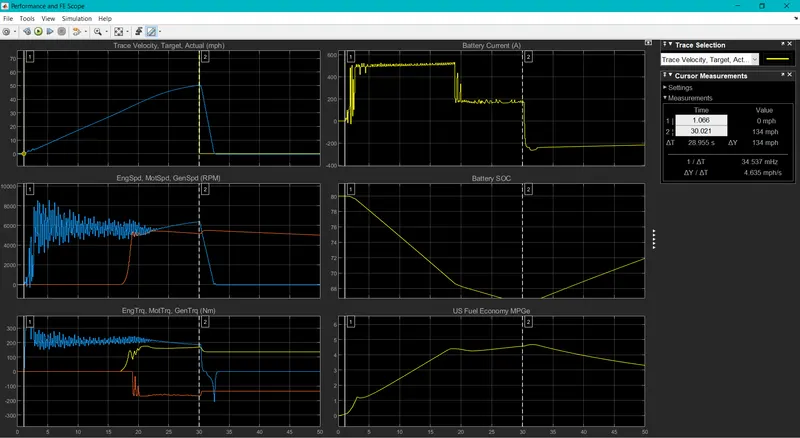
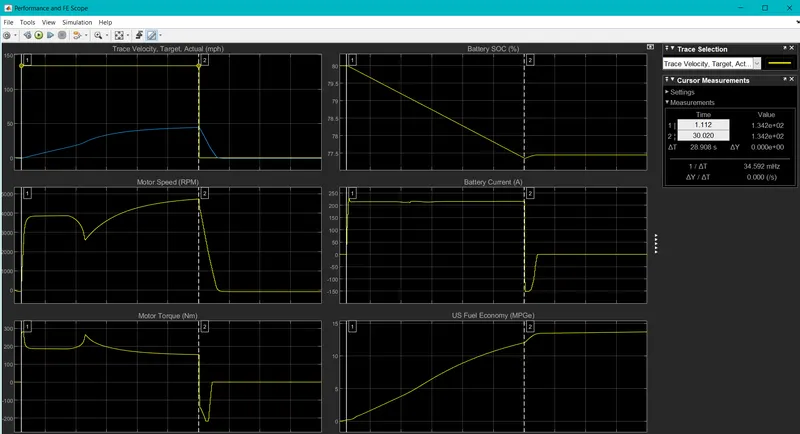
FE Scope output from the visualisation block:
4) Aim:Compare the results of Hybrid and pure Electric powertrains:
Pure EV reference application:
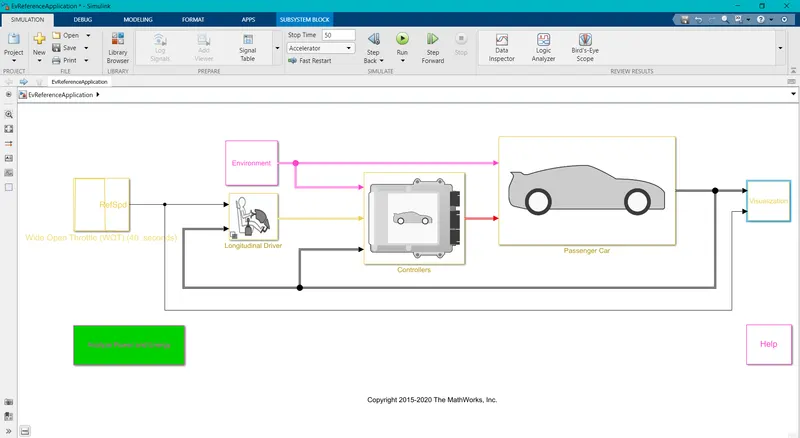
Changing the Grade and Wind velocity in the enviroinmental block:
FE Scope output from visualisation block:
Comparison of HEV powertrain and pure EV Powertrain using WOT condition:
- By comparing both the outputs the HEV attains the maximum top speed of 134 miles per hour and the EV attains the maximum top speed of 123 miles per hour.
- The battery current drawn in the HEV is more than the Electric vehicle as the battery power is only the source in the Electric vehicle.
- The Battery SOC reduces from 80% to 65% In HEV and in Pure EV the Battery SOC reduces from 80% to 77.4%
Thus the HEV powertrain and Pure EV powertrain is been Compared.