Week-4 Challenge WOT Condition Part-2
1.What is the difference between mapped and dynamic model of engine, motor and generator? How can you change model type?
Answer:
Introduction to Powertrain blokset:
- Powertrain Blockset provides fully assembled reference application models of automotive powertrains, including gasoline, diesel, hybrid, and electric systems.
- It includes a component library for simulating engine subsystems, transmission assemblies, traction motors, battery packs, and controller models.
- Powertrain Blockset also includes a dynamometer model for virtual testing. MDF file support provides a standards-based interface to calibration tools for data import.
- Powertrain Blockset provides a standard model architecture that can be reused throughout the development process.
- You can use it for design tradeoff analysis and component sizing, control parameter optimization, and hardware-in-the-loop testing.
- You can customize models by parameterizing components in a reference application with your own data or by replacing a subsystem with your own model.
Powertrain blockset generally provides two types of machine(Engine,generator and model) model.
1) Mapped model
2) Dynamic model
The main difference between mapped and dynamic model is that,
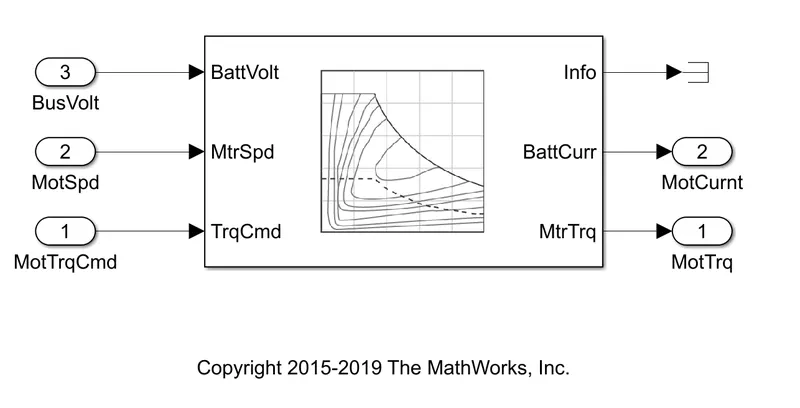
- Incase of mapped model, the machine data is taken from a lookup table data.
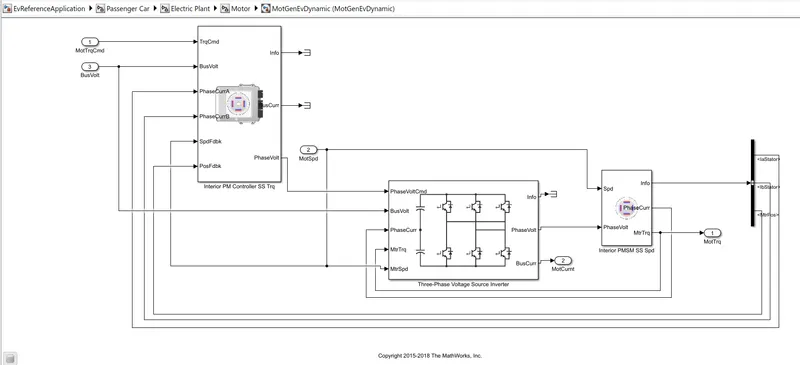
- Incase of dynamic model, the macchine data is taken from available machine data.
| Mapped model type | Dynamic model type |
| It represents macro engine behivour as a set of lookup tables as functions of commanded load and measured speed. | Model decomposes engine behivour individual component models that account for engine dynamics. |
| Suitable for analysis and design purpose that do not require machine subsystem characteristics. | Suitable for designing control,estimator, and diagostic algorithms that depend on dynamic subsystems. |
| Example: engine and transmission powertrain matching analysis for fuel economy,emissions and performance tradeoffs. | Example: Closed-loop AFR(Air:Fuel ratio) control algorithm development. |
Mapped model type:
Dynamic model type:
How to change the model type:
- First select type of powertrain blockset(HEV or pure EV).
- Open Passenger car then go to Electric plant.
- Open Motor then right click anywhere in model.
- Choose Variant -> Label mode active choice ->.
- Then two options available as "MotGenEvDynamic" and "MotGenEvMapped".
- Select the option you want to operate.
Conclusion:
- The difference between two types mpped and dynamic explained in table form.
- THe steps for how to change the model type is also explained.
2.How does the model calculate miles per gallon? Which factors are considered to model fuel flow?
Answer:
- "Miles per gallon(MPG)" is the distance measured in miles, that a car can travel per gallon of fuel.
- It's value may change according to type of fuel we use (like gasoline,petrol, diesel etc).
- It is the measurement of vehicle fuel efficiency.The higher a vehicle's MPG,the more fuel efficient.
- Since vehicle can be hybrid,conventional or pure electric type, here we considered HEV model as it consists both battery and fuel.
- According to type of vehicle calculations, may change little bit.
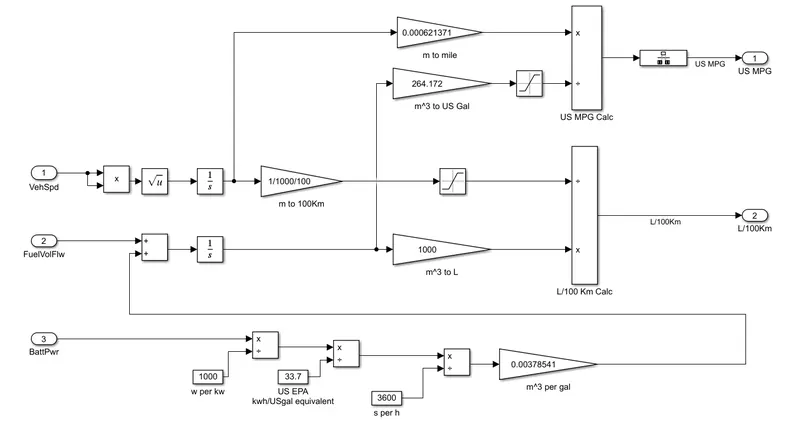
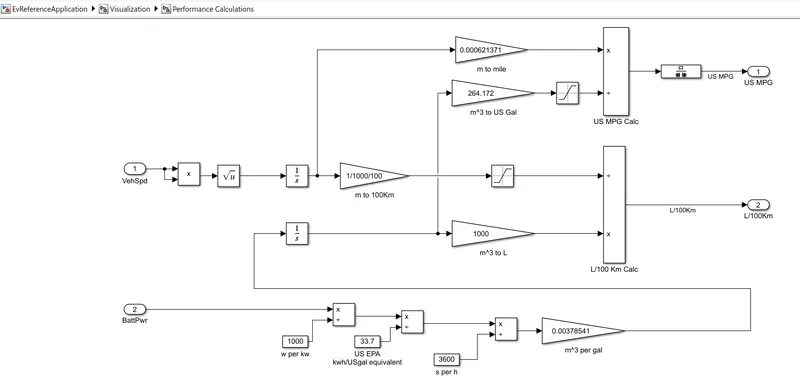
HEV model for MPG calculation Pure EV model for MPG calculation
First let us consider HEV model(both battery and fuel) for miles per gallon calculation. So battery power converted into litre by some calculations (as below) and also fuel flow(engine fuel) is also taken while doing the calculation of MPGe.
- So,we can observe that main parameters required to calculate MPG are Battery power,Fuel and vehicle speed.
- so battery power(Watthour) converted into Kilo watthour. ( 1Kilowatt hour=1000 watthour).
- According to EPA (Environmental Protection Agency)'s formula, 1 gallon of fuel= 33.7KWh.
- So this KWh is converted into gallon by (KWh/33.7).
- We know 1 gallon = 0.00378541 cubic meter. Now this gallon value is converted into cubic meter by (gallon/0.00378541).
- Then integrator is used to take all the values for the entire simulation time.
- Again this accumulated cubicmeter value is converted to cubic gallon by (cubic meter * 264.172). As (1 cubic meter = 264.172 gallon).
- Now velocity is taken and integated to obtain distance (Meter).
- Now this distance is converted to miles by (meter/0.000621). As (1 meter = 0.000621 mile).
- Finally MPG is calculated by (Miles/Gallon).
Example: A 29Kwh vehicle travelled a distance of 100 miles, then MPG is __?
In this model, we didn't consider some of the blocks like sqaure, sauare root as we are considering here only values at particular instant of time.
100 miles=160934.4 meters.
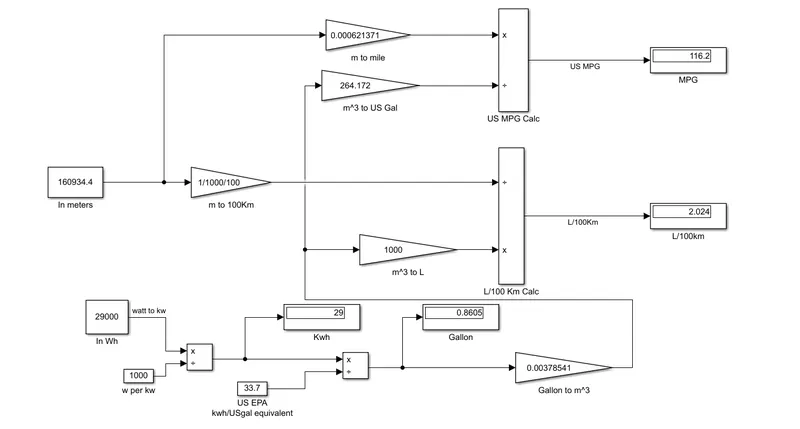
Therefore MPG of given vehicle is 116.2 miles/gallon.
Factors considered to model fuel flow:
1.For HEV model type,
- we need to consider amount of fuel(liquid in m^3 or litre) and rating of the battery(in KWh) to model fuel flow.
- Then this fuel value converted into gallon (1 gallon=3.78541 litres) and Kwh value converted into gallon(1 gallon = 33.7 KWh).
2.For Pure EV model type,
- We need to consider only rating of battery (in KWh) to model fuel flow.
- Then this Kwh value converted into gallon(1 gallon = 33.7 KWh).
Conclusion:
- The steps for calculation of MPG is explained.
- The Factors considered to model fuel flow is discussed.
3.Run the HEV ReferenceApplication with WOT drive cycle. Change the grade and wind velocity in the environment block. Comment on the results.
Answer:
Here we have taken HEVMultimode reference application model.
Main model:
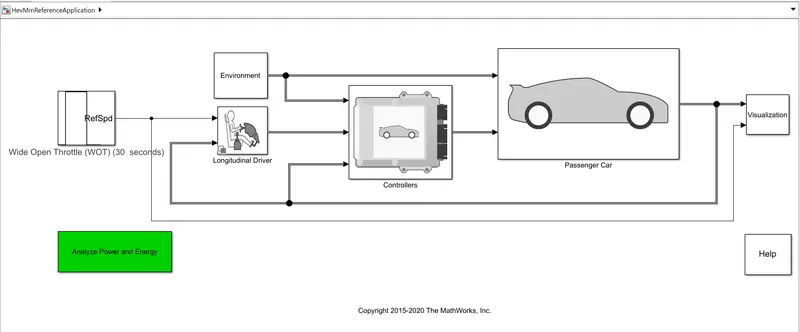
Case i) All default conditions with WOT drive cycle:
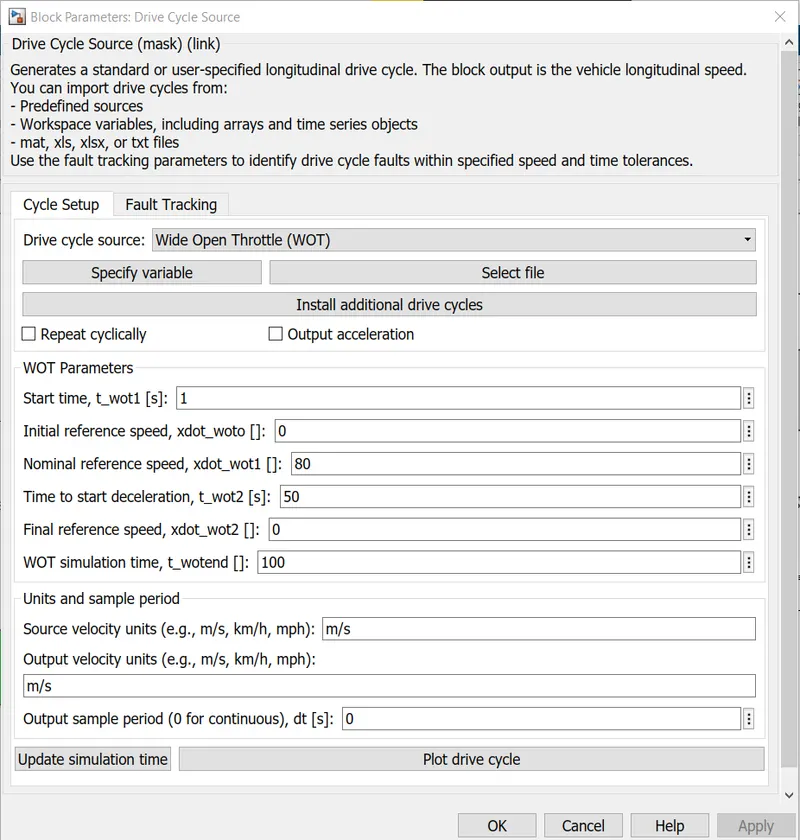
Drive cycle: WOT drive cycle
Grade : 0 percentage
Wind velocity :0 m/sec and all other parameters also remaining same.
Drive cycle:
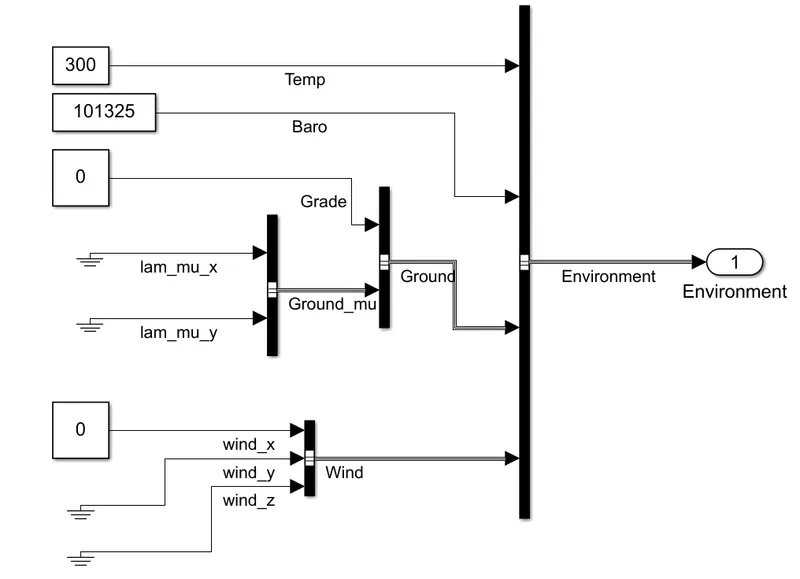
Environmental block:
- In this block we can change Temperature, Pressue,Grade and Wind Velocity.
- Here the default conditions are Temperature (300 degree centigrade), Pressure (101325 Pascal),Grade(0) and Wind velocity (0).
Output:
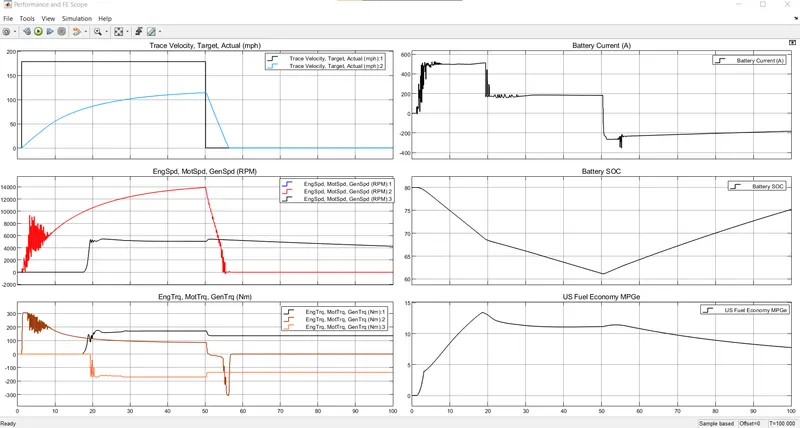
So we got 6 output plots as shown above. Total simulation time is 100 seconds.
Plot1: This is the graph of drive cycle and the actual vehicle speed(mph) versus time.
Maximum vehicle speed = 114.9mph and the time taken by vehicle to decelerate to 0 speed is 6.383 seconds.
Plot2: This is the graph of engine,motor and generator speed(RPM) versus time.
The maximum engine speed = 5447 RPM
The maximum motor speed = 13940 RPM
The maximum Generator speed = 5447 RPM
Plot3: This is the graph of engine,motor and generator torqueN-m) versus time.
The maximum engine torque = 174.9 N-m
The maximum motor torque = 307 N-m
The maximum generator torque = 53.63 N-m
Plot4: This is the graph of battery current (A) versus time.
Maximum discharge current from the battery = 521.8 A
Maximum charging current to the battery = 353.5 A (since negative sign).
Plot5: This is the graph of SOC (%) of battery versus time.
The battery SOC is decreased from 80% to 61.35% in 48 seconds.
Plot6: This is the graph of US fuel economy(MPG) versus time.
The maximum distance that the vehicle travel per gallon is 13.85 miles.
Emissions:
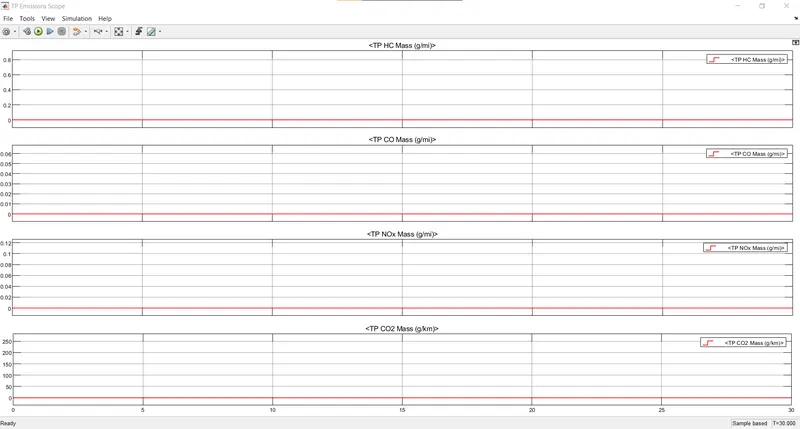
- From the emissions graph, we can observe that there were no emissions.
Case ii) Same model as above with change in grade and wind velocity:
Drive cycle: WOT drive cycle
Grade : 10 percentage
Wind velocity :20 m/sec and remaining parameters kept same.
Drive cycle:
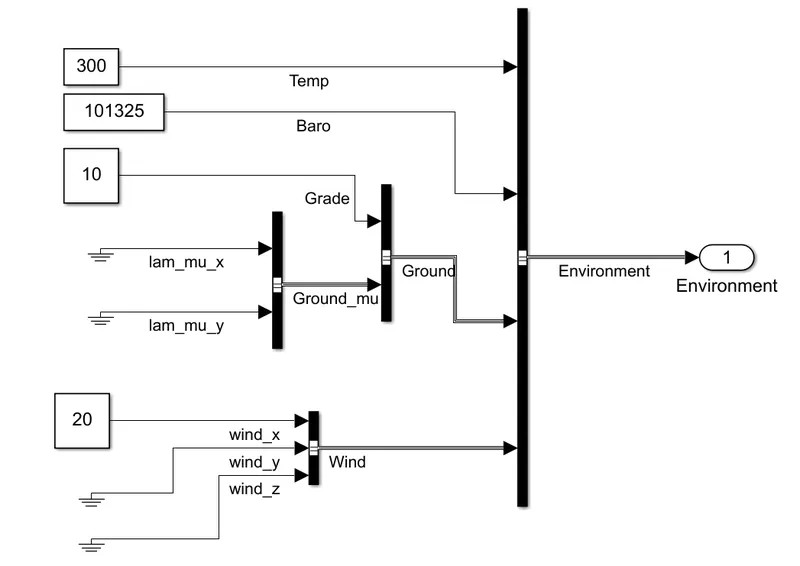
Environment block:
- In this block we can change Temperature, Pressue,Grade and Wind Velocity.
- Here we considered Grade value to 10 and Wind value to 20 and all other are default.
Output:
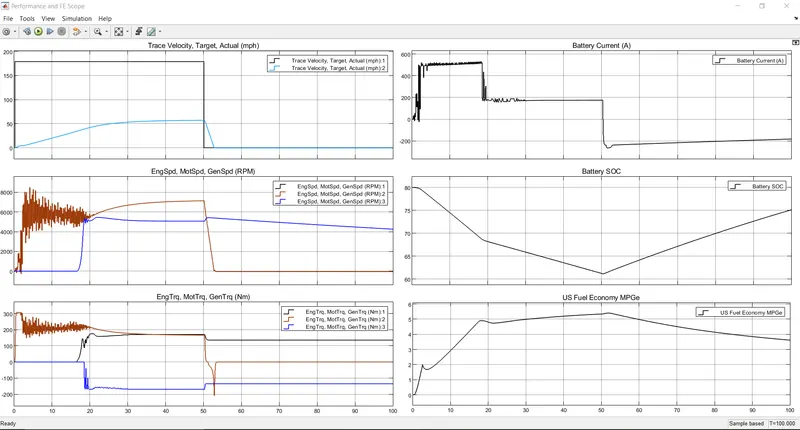
So we got 6 output plots as shown above. Total simulation time is 100 seconds.
Plot1: This is the graph of drive cycle and the actual vehicle speed(mph) versus time.
Maximum vehicle speed = 57.04mph and the time taken by vehicle to decelerate to 0 speed is 2.797 seconds.
Plot2: This is the graph of engine,motor and generator speed(RPM) versus time.
The maximum engine speed = 5451 RPM
The maximum motor speed = 8484 RPM
The maximum Generator speed = 5451 RPM
Plot3: This is the graph of engine,motor and generator torque(N-m) versus time.
The maximum engine torque = 174.9 N-m
The maximum motor torque = 307.2 N-m
The maximum generator torque = 40.28 N-m(Negative sign)
Plot4: This is the graph of battery current (A) versus time.
Maximum discharge current from the battery = 529.99 A
Maximum charging current to the battery = 353.5 A (since negative sign).
Plot5: This is the graph of SOC (%) of battery versus time.
The battery SOC is decreased from 80% to 61.2% in 48 seconds.
Plot6: This is the graph of US fuel economy(MPG) versus time.
The maximum distance that the vehicle travel per gallon is 5.4 miles.
Emissions:
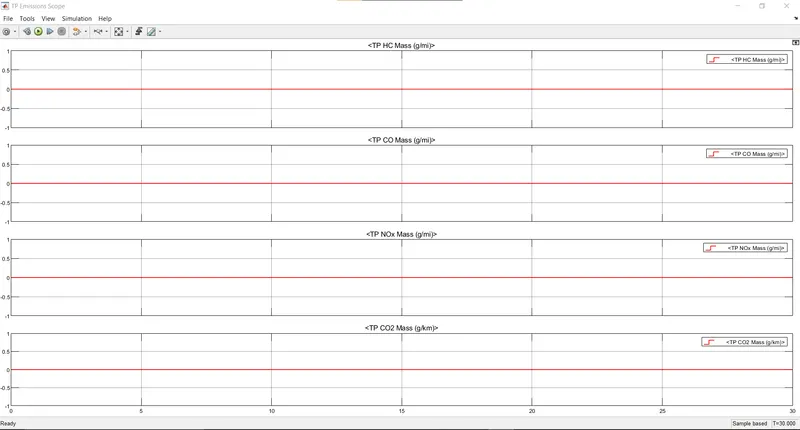
- From the emissions graph, we can observe that there were no emissions.
Comparision:
Here we are comparing HEV reference model between default parameter (with WOT drive cycle) and changed parameters (with WOT drive cycle).
| Parameters/Components | HEV (with default parameter) | HEV(with changed parameter) |
| Drive cycle | WOT drive cycle | WOT drive cycle |
| Grade(%) | 0 | 10 |
| Wind velocity(m/sec) | 0 | 20 |
| main components | Engine,motor and generator | Engine,motor and generator |
| Maximum vehicle speed (mph) | 114.9 | 57.04 |
| Time taken to decelerate from top speed to zero speed (Seconds) | 3.383 | 2.797 |
| Maximum engine speed (RPM) | 5447 | 5451 |
| Maximum motor speed(RPM) | 13940 | 8484 |
| Maximum generator speed(RPM) | 5447 | 5451 |
| Maximum engine torque(Nm) | 174.9 | 173.4 |
| Maximum motor torque(Nm) | 307 | 307.2 |
| Maximum generator torque(Nm) | 53.63 | 40.28 |
|
Maximum discharge current from the battery(A) |
521.8 | 529.99 |
|
Maximum charging current to the battery(A) |
353.5 | 230.5 |
|
State of charge(%) |
decreased from 80% to 61.35% in 48 seconds | decreased from 80% to 61.2% in 48 seconds |
|
Miles per gallon (MPG) |
13.85 | 5.4 |
Conclusion:
- Therefore from the table above, the hybrid model with default conditions perform better than the same model with changed parameters.
4.Keeping all other parameters same, compare the simulated results of hybrid and pure electric powertrains.
Answer:
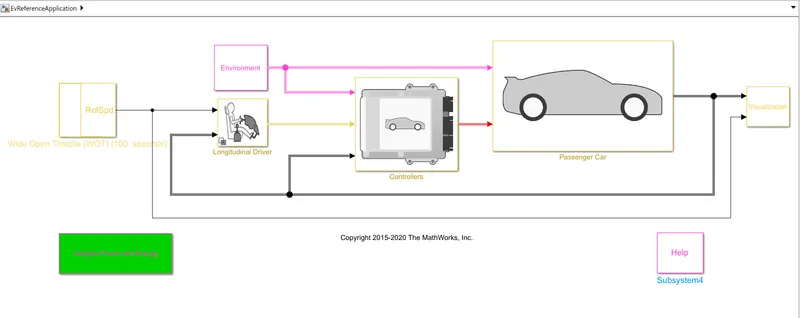
As we have already simulated the hybrid model in previous question lets simulate the Pure electric model and then comapre.
Drive cycle: WOT drive cycle
Grade : 10 percentage
Wind velocity :20 m/sec and remaining parameters kept same.
Model:
Drive cycle:
Environmental block:
- In this block we can change Temperature, Pressue,Grade and Wind Velocity.
- Here we considered Grade value to 10% and Wind value to 20 m/sec and all other are default.
Output:
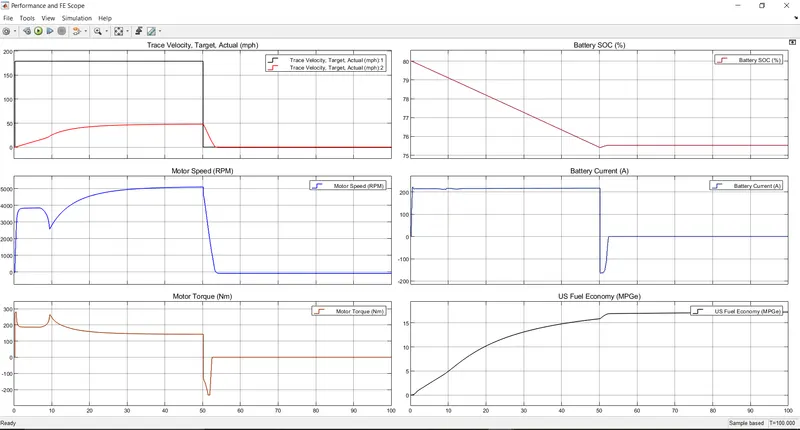
So we got 6 output plots as shown above. Total simulation time is 100 seconds.
Plot1: This is the graph of drive cycle and the actual vehicle speed(mph) versus time.
Maximum vehicle speed = 47.75mph and the time taken by vehicle to decelerate to 0 speed is 3.201 seconds.
Plot2: This is the graph of motor speed(RPM) versus time.
The maximum motor speed = 5098 RPM
Plot3: This is the graph of motor torque(N-m) versus time.
The maximum motor torque = 280 N-m
Plot4: This is the graph of SOC (%) of battery versus time.
The battery SOC is decreased from 80% to 75.42% in 50 seconds.
Plot5: This is the graph of battery current (A) versus time.
Maximum discharge current from the battery = 222.3 A
Maximum charging current to the battery = 164.5 A (since negative sign).
Plot6: This is the graph of US fuel economy(MPG) versus time.
The maximum distance that the vehicle travel per gallon is 15.5 miles.
Comparision of hybrid and pure electric vehicles with same parameters:
| Parameters/Components | Hybrid electric vehicle | Pure electirc vehicles |
| Drive cycle | WOT drive cycle | WOT drive cycle |
| Grade(%) | 10 | 10 |
| Wind velocity(m/sec) | 20 | 20 |
| main components | engine,motor/generator | motor/generator |
| Maximum vehicle speed(mph) | 57.04 | 47.75 |
| Time taken to decelerate from top speed to zero speed(seconds) | 2.797 | 3.201 |
|
Maximum engine speed(RPM) |
5451 | ------- |
| Maximum motor speed(RPM) | 8484 | 5098 |
| Maximum generator speed(RPM) | 5451 | ------- |
| Maximum engine torque(Nm) | 174.9 | ------- |
| Maximum motor torque(Nm) | 307.2 | 280 |
| Maximum generator torque(Nm) | 40.28 | ------- |
| Maximum discharge current from the battery (A) | 529.99 | 222.3. |
| Maximum charging current to the battery (A) | 230.5 | 164.5 |
| State of charge(%) | decreased from 80 to 61.2 in 48 seconds | decreased from 80 to 75.42 in 50 seconds |
| Miles per gallon | 5.4 | 15.5 |
Conclusion:
- From the above table, the performance of hybrid vehicle is better than pure electric vehicle.
- So for better performance we have to motor speed, motor torque and battery capacity.
References:
- https://in.mathworks.com/help/autoblks/getting-started-with.html
- https://en.wikipedia.org/wiki/Gasoline_gallon_equivalent#:~:text=The%20ratings%20are%20based%20on,tests%20simulating%20varying%20driving%20conditions.
Note: All the required models are attached in "attach file" section.