Week-3 Challenge: ADVISOR Tool
1) For EV_defaults_in file, if cargo mass is 500 kg with all other default conditions, can the vehicle travel for 45 km with FTP drive cycle? Conclude your observations.
Answer:
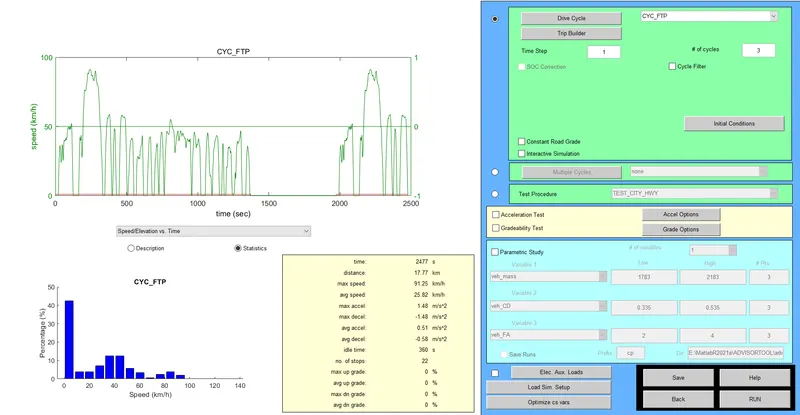
Main model: This is modelled with EV_defaults_in with cargo mass 500 kg and FTP drive cycle and all other default conditions as shown below:
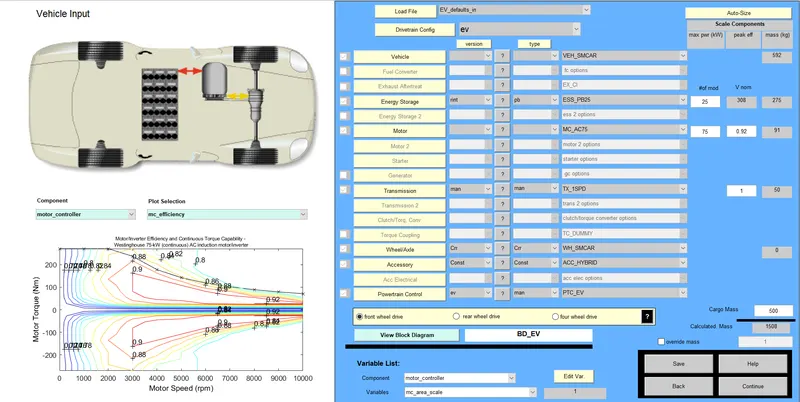
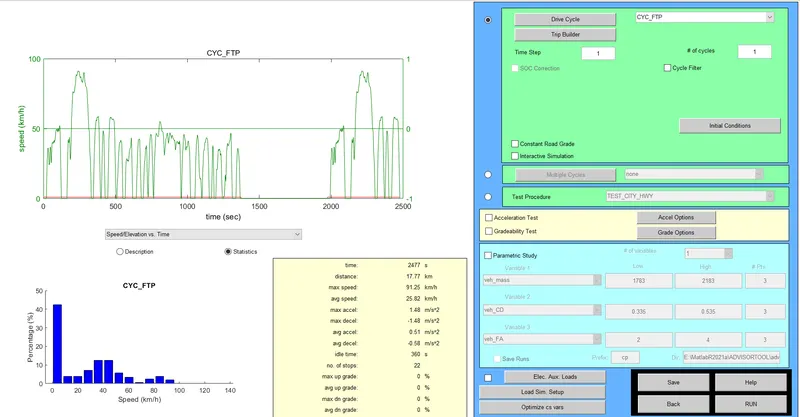
Drivecyle and other parameters setup:
a) If only single FTP drive cycle used:
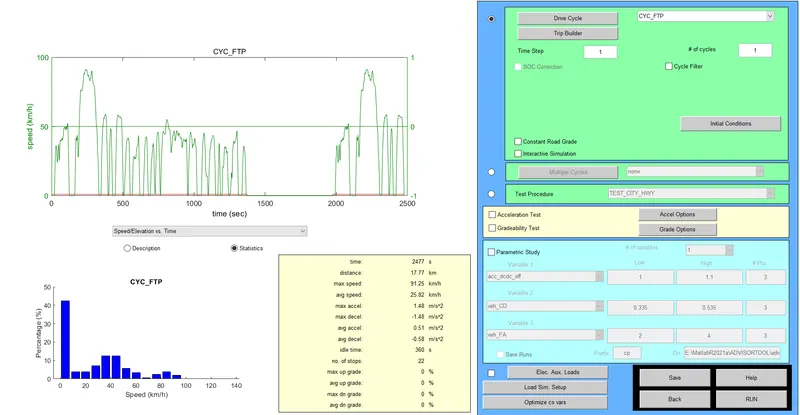
Output:
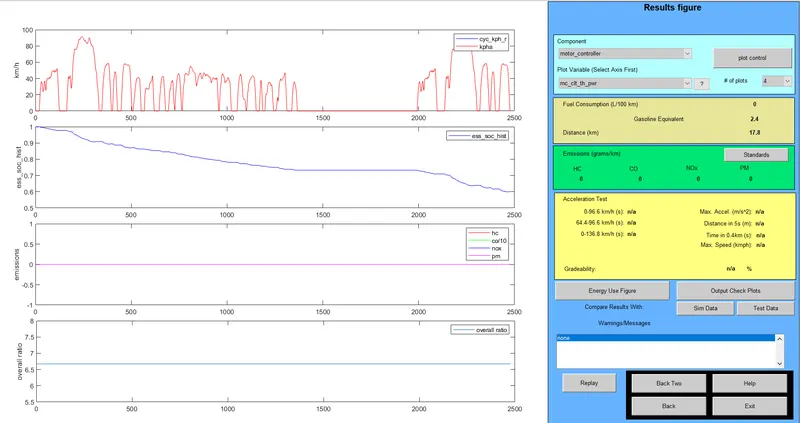
- From figure above, the distance covered by vehicle under given conditions for single drive conditions is only 17.8 kms.
b) If three FTP drive cycle are used:
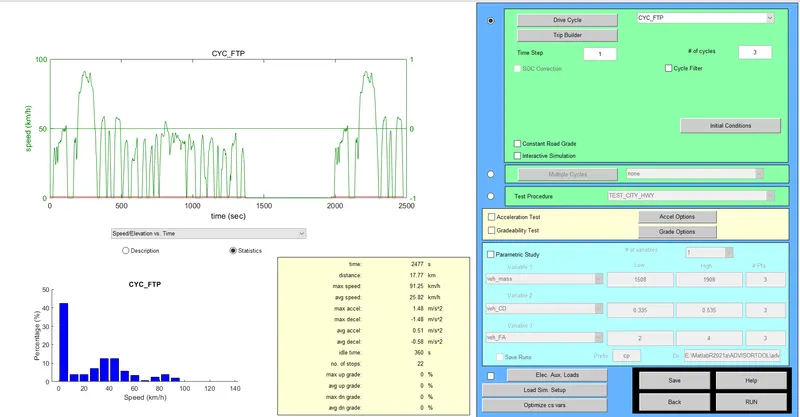
Output:
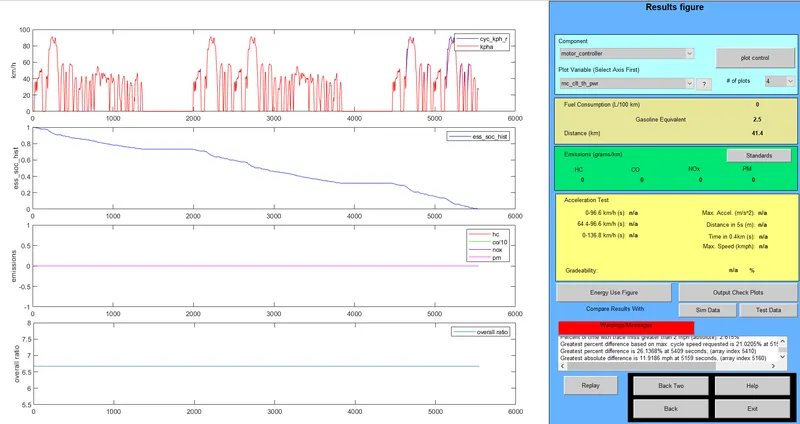
- From figure above,the distance covered by vehicle under given conditions for single drive conditions is only 41.4 kms.
Conclusion:
- Therefore, if we use three drive cycles the vehicle will not cover 45 kms because the state of charge becomes zero after 41.4 kms.
- So, the vehicle will mot cover 45 km with FTP drive cycle.
2. In the above case, try changing the battery capacity and repeat the simulation.
Answer:
Main model: The battery capacity increased from 308V(25 modules) to 493V(40 modules) and all other parameters remains same as first model.
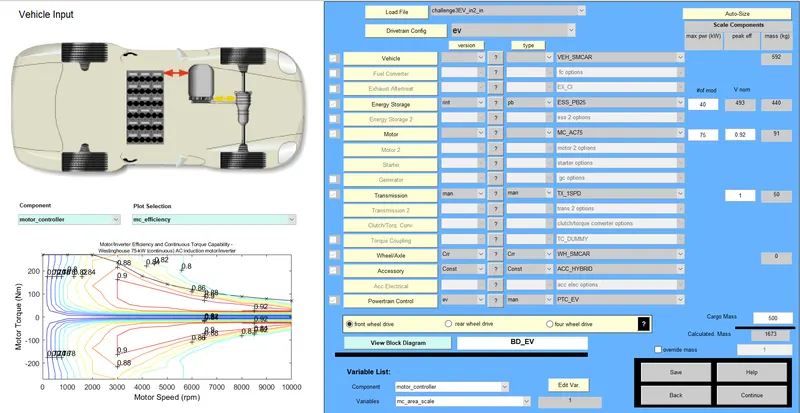
Drivecyle and other parameters setup:
- In this model we use FTP drive cyle.
a) If only single FTP drive cycle used:
Output:
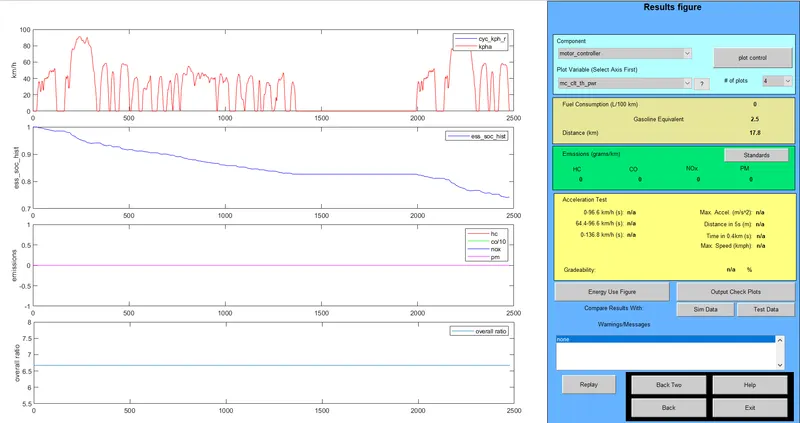
- From figure above, the distance covered by vehicle under given conditions for single drive conditions is only 17.8 kms. That is here only battery capacity increased.
- So, the performance of vehicle will be same as the first model.
- Only the difference is that state of charge(SOC).
- In this case the state of charge will decrase slowly comapred to the first case.
b) If three drive cycle FTP are used:
Output:
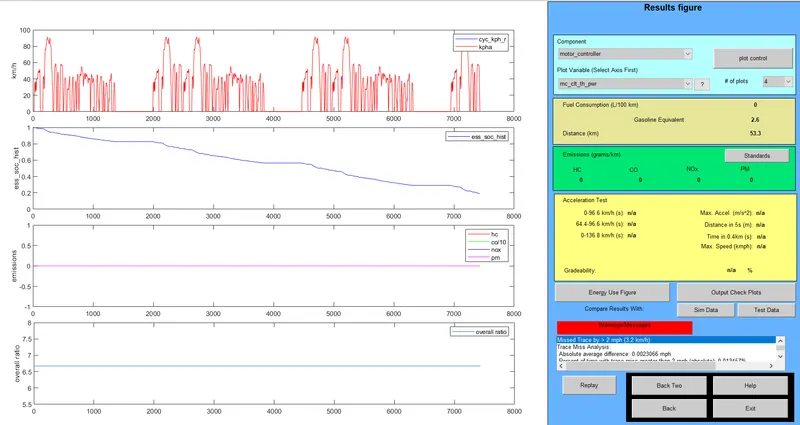
Conclusion:
- Therefore, if battery capacity increased and use three drive cycles, the vehicle will cover nearly 54 km.
3) Perform gradeability test with PRIUS_Jpn_defaults_in file and Compare your results in table and conclude.
Answer:
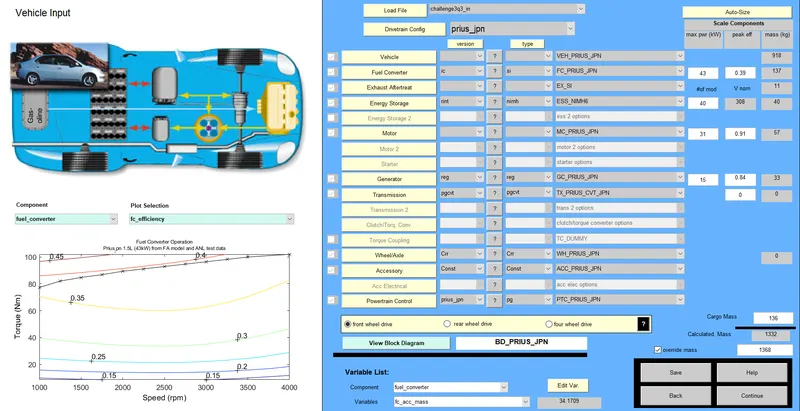
Main model: The model shown below is PRIUS_jpn_defaults_in and it is simulated with all default conditions and enabled gradeability test.
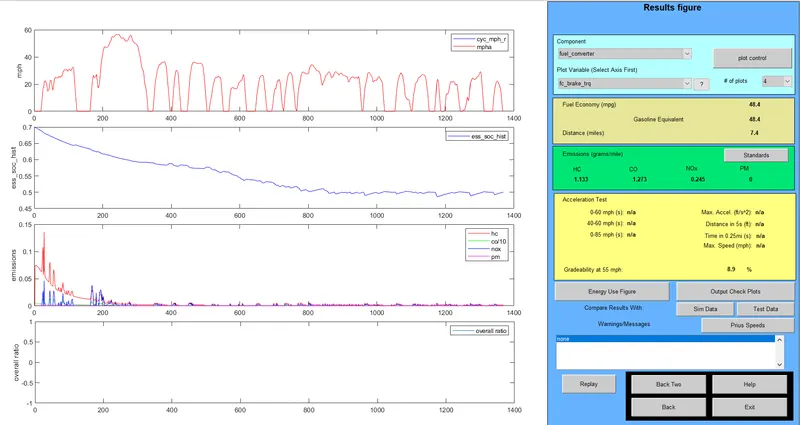
Gradeability test: This test is performed to know the % gradeability at a givren speed.
i) when speed = 55 mph
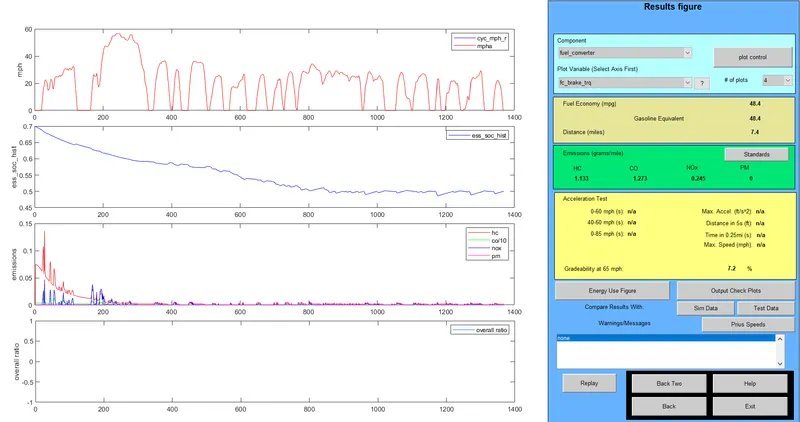
ii) when speed = 65 mph
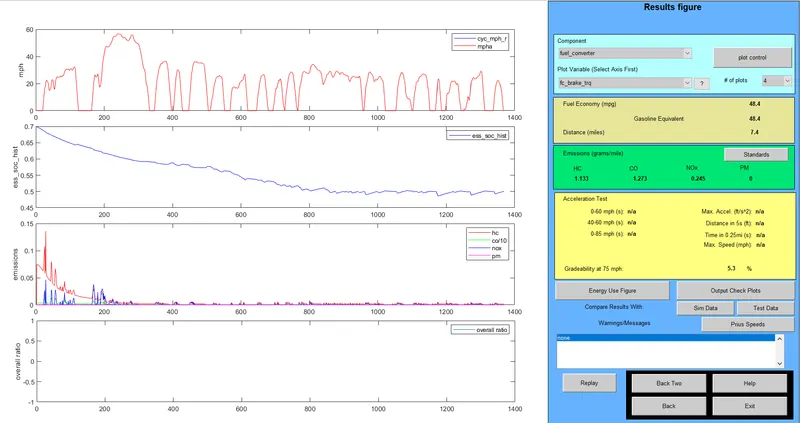
iii) when speed = 75 mph
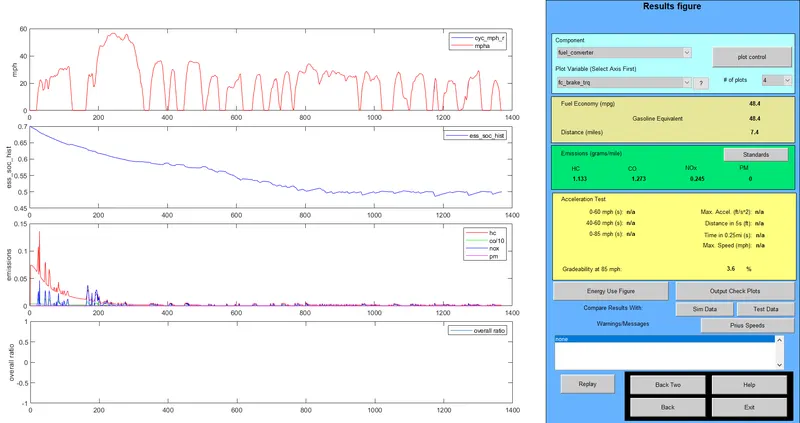
iv) when speed = 85 mph
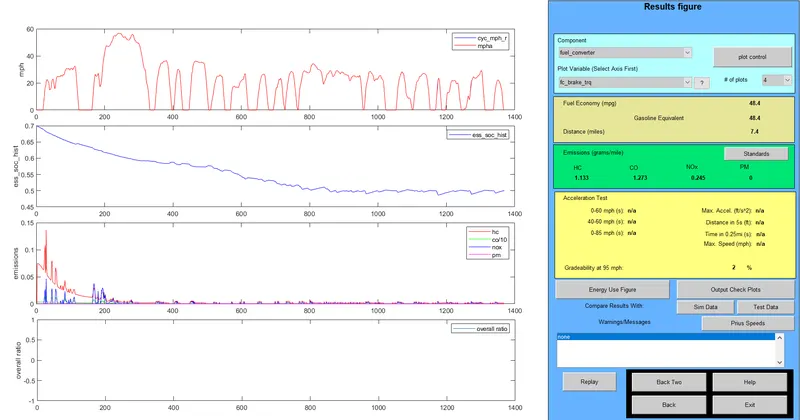
v) when speed = 95 mph
vi) when speed = 100 mph
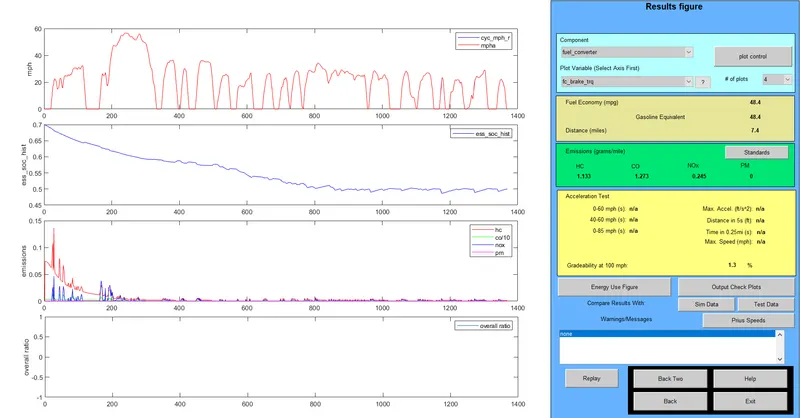
Comparison:
| Speed (mph) | Gradeability (%) |
| 55 | 8.9 |
| 65 | 7.2 |
| 75 | 5.3 |
| 85 | 3.6 |
| 95 | 2.0 |
| 100 | 1.3 |
Conclusion: From the results obtained we can conclude that as speed increases, the percentage gradeability decreases. We can understand through waveform also.
Speed ∝ 1/(percentage gradeability)
- For plotting speed vs Percentage gradeability we consider matlab code as shown below.
Matlab code:
clc
Vel=[55 65 75 85 95 100];
Grad=[8.9 7.2 5.3 3.6 2 1.3];
stem(Vel,Grad)
title('comparision speed vs Gradability');
xlabel('Speed');
ylabel('Gradeability');
grid on;
Output:
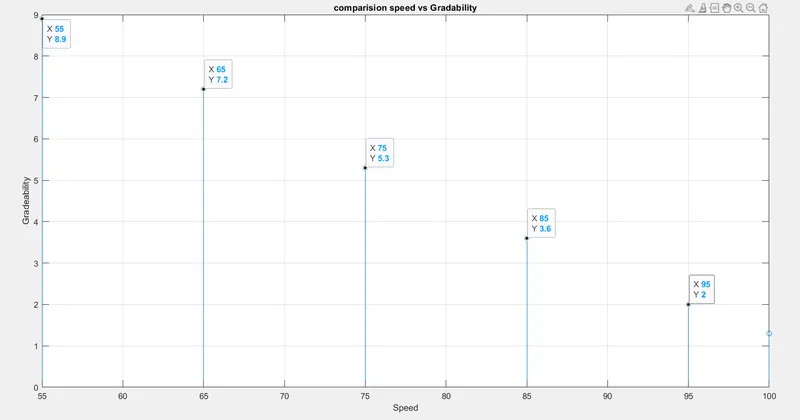
- From discrete plot above, speed is speed is inversely proportional to percentage gradeability.
Note: All the .m files are attached in "attach file" section.