Basics of Probability and Statistics Week 1 Challenge
1.Why there is a difference in the formula of variance for population and sample?
Answer:
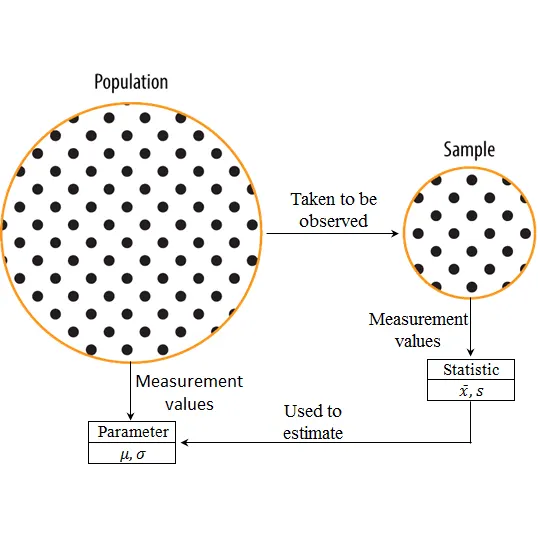
First lets understand difference between Population and Sample.
Population:
It is a set containing all the elements(occurences,prices etc) of a specified group.It is a whole group.
Sample:
- It is a part of population that is used to describe the characteristics(eg:mean,standard deviation etc) of the population.
- The size of the sample can be less than 1%, or 10% or 80% of the population, but it is never the whole population.
Pouplation Varaince:
σ^2 = ∑((Xi-μx)^2)/N
Population Standard Deviation:
- So to explain simply,(N-1) is a smaller than N. When you divide by a smaller number you get a larger number.
- Therefore when you divide by (N−1) the sample variance will be a larger number.
- If the sample variance is larger, there is a greater chance that it captures the true population variance.
- That is why when you divide by (N−1) we call that an unbiased sample estimate. Whereas dividing by 'N' is called a biased sample estimate.
- Because we are trying to get information about a population by calculating the variance from a sample set we probably do not want to underestimate the variance.
- Basically by just dividing by 'N' we are underestimating the true population variance, that is why it is called a biased estimate.
Biased VS Unbiased:
- An "unbiased" estimator is an accurate statistic that's used to approximate a population parameter.
- “Accurate” in this sense means that it's neither an overestimate nor an underestimate.
- If an overestimate or underestimate does happen, the mean of the difference is called a “biased” estimator.
Example:
Population data: 10,20,30,40,50,60,70,80.
Mean=360/8=45
Deviations= -35,-25,-15,-5,5,15,25,35
Squares of deviations=1225,625,225,25,25,225,625,1225.
Variance=3975/8=496.875
Standard deviation =22.2906
Sample data:10,30,50,70
Mean=160/4=40
Deviations=-30,-10,10,30
Squares of deviations=900,100,100,900
Variance= 2000/3 = 666.6666667
Standard deviation=25.82
Conclusion:
- The differecne in the formula of variance for population and sample is explained.
2.Difference between stratified and clustered sampling.
Answer:
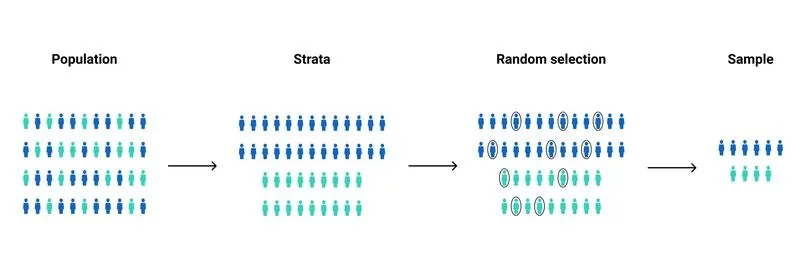
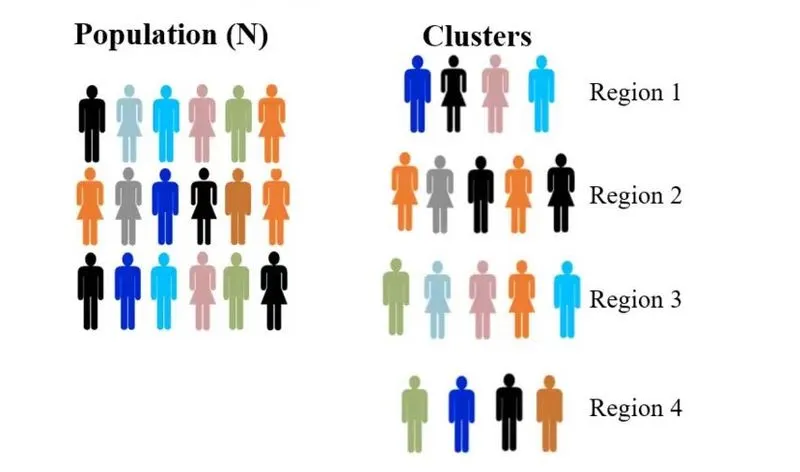
| Stratified sampling | Clustered Sampling |
| Population divided into few subgroups | Population divided into many subgroups. |
| Homogeneity with in the groups | Heterogeneity with in the group |
| Heterogeneity between subgroups | Homogeneity between subgroups |
| Choice of elements from within each subgroup | Random choice of subgroups |
| To increase precision and representation | To reduce cost and increase efficiency |
Stratified sampling:
Clustered sampling:
Conclusion:
- Difference between stratified and clustered sampling is explained.
3. How many different samples can be created out of population of size n ?
Answer:
We know sample size must not be equal to size of population.So Maximum sample size is n-1.
Now let sample size as n,
n C r =[n!/(n-r)!×r!]
If n=1, number of samples=nC1
if n=2, number of samples =nC2
if n=3, number of samples=nC3
-
-
-
-
if n=n-1,number of samples=nC(n-1).
Total number of different samples = nC1+nC2+nC3+---------nC(n-1)
we know nC1+nC2+nC3+---------nCn= (2^n)-1------------------------(1)
=>if we subtract nCn from (1) then, we get the required answer.
as nCn=1
=> nC1+nC2+nC3+---------nC(n-1)=(2^n)-2.
Therefore total number of different samples can be created out of population size n =(2^n)-2
Example:
let population size n=4 (A,B,C,D)
sample size=1 or 2 or 3
if sample size = 1:
A,B,C,D ----- 4 samples
if sample size = 2:
(A,B),(B,C),(A,C),(A,A),(B,B),(C,C)------6 samples
if sample size = 3:
(A,B,C),(B,C,D),(A,C,D),(A,B,D).
Total number different samples= 4+6+4=14
By formula,
=>(2^4)-2
=> 14.
Conclusion:
- Therefore Total number of different samples can be created out of population size n =(2^n)-2
4.What is the probability of drawing 2 jacks from a pack of card?
Answer:
First let us understand what is pack of card.
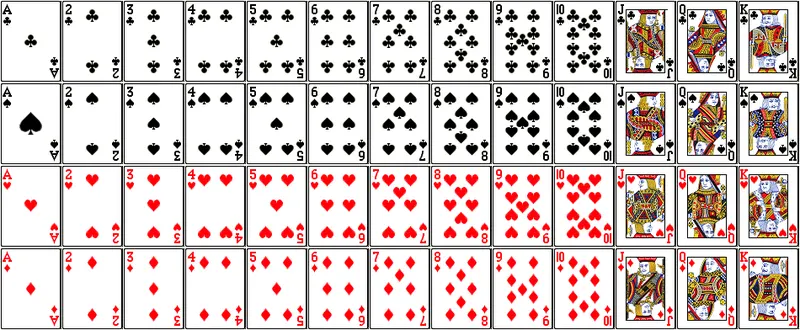
So there 52 cards. Among which 26 are black and 26 are red.
Black cards(26): 13 clubs(♣) and 13 spades(♤).
13 clubs(♣): 2,3,4,5,6,7,8,9,10,Ace,jack,Queen,king.
13 spades(♠️):2,3,4,5,6,7,8,9,10,Ace,jack,Queen,king.
Red cards(26): 13 Hearts(♥) and 13 diamonds(♦).
13 Hearts(♥): 2,3,4,5,6,7,8,9,10,Ace,jack,Queen,king.
13 diamonds(♦): 2,3,4,5,6,7,8,9,10,Ace,jack,Queen,king.
- Number of number cards:9×4=36(18 Black + Red)
- Number of facial cards(4 Jack,4 Queen,4 King)=3×4=12(6 black + 6 Red)
- Number of non-facial cards:52-12=40 (20 Black + 20 Red).
Now,
Probabaility = Favourable events/Total possible events.
a) Without replacement:
Favourable events = 4C2= 6 ways (Since there are 4 jacks).
Total possible events = 52C2=1326.
So probability = 6/1326=1/221
Therefore required probability =1/221
b) With replacement:
Favourable events = 4×4=16 ways
Total Possible events = 52×52=2704=
So probability = 16/2704
Therefore required probability = 1/169
Conclusion:
- Therefore required probability for without replacement=1/221
- Therefore required probability for with replacement =1/169.
5.What is the probability that both the numbers on dice are same while rolling 2 dice?
Answer:
we know a standard dice containg 6 faces with numbers 1 to 6.
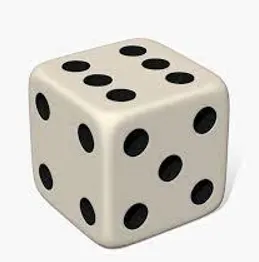
Standard dice
Now,
Probabaility = Favourable events/Total possible events.
Total Possible cases when dice dice roll at a time:
(1,1), (1,2), (1,3), (1,4), (1,5), (1,6)
(2,1), (2,2), (2,3), (2,4), (2,5), (2,6)
(3,1), (3,2), (3,3), (3,4), (3,5), (3,6)
(4,1), (4,2), (4,3), (4,4), (4,5), (4,6)
(5,1), (5,2), (5,3), (5,4), (5,5), (5,6)
(6,1), (6,2), (6,3), (6,4), (6,5), (6,6).
=> So probability = 6/36 = 1/6.
Therefore total number of favourable cases =6 (highlighted)
Conclusion:
- Therefore,required probability = 1/6.
6. Why standard deviation when variance can measure the dispersion in data?
Answer:
We know that units for a parameter a has great importance.
Let us have look at formulae for variance and standard deviation.
Pouplation Varaince:
σ^2 = ∑((Xi-μx)^2)/N
Population Standard Deviation:
So, Variance is the average of squared deviations and Standard deviation is the square root of Variance.
For example, we have a data of vehicle speed for cerain duration.
| Time(hr) | 9am to 10am | 10 am to 11 am | 11 am to 12 pm | 12pm to 1pm | 1pm to 2pm |
| Speed(Kmph) | 45 | 55 | 60 | 70 | 80 |
Then Variance =?
Average speed = 310/5 = 62 kmph
Deviations= -17 kmph, -7 kmph, -2 kmph, 8 kmph, 18 kmph
Variance = (289+49+4+64+324)/5=146 kmph^2
Standard deviation=√146 = 12.08 kmph. This is the amount of actual dispersion.
So,we can observe that Variance has unit interms of square of the dispersion. But Standard deviation has same unit as parameter we are calculating.
- So Standard deviation is best measure of dispersion.
- Variance is the best measure for statistical analysis.
Conclusion:
- Therefore reason for standard deviation calculation when variance can measure dispersion is explained.