Week-4 Challenge WOT Condition Part-2
1.What is the difference between mapped and dynamic model of engine, motor and generator? How can you change model type?
PowerTrain blockset:It is used for analysis,modelling and designing of electric vehicles and hybrid electric vehicles.
Mapped model:Mapped model also called as a static model.It refers to the model with a precalculated dataset for which the values are readily availabel for the correspondings inputs.We get a fixed output value for a fixed input value like a lookup table.This mapped datpoints are calculated using a actual dynamic model.
Dynamic model:A dynamic model performs a real time simulation of components that actually takes place in an original system to generates a output depending upon the input values randomly changing.it uses the real time input variables for the simulation.
Both the models gives the same output variable for the same input variable but the difference is how the output is generated in each case.
Below we can see both the model in the same subsystem but we can activated either one of it or simulated at a time.The motor block consists of this mapped and dynamic model.
The outlook of a mapped and dynamic block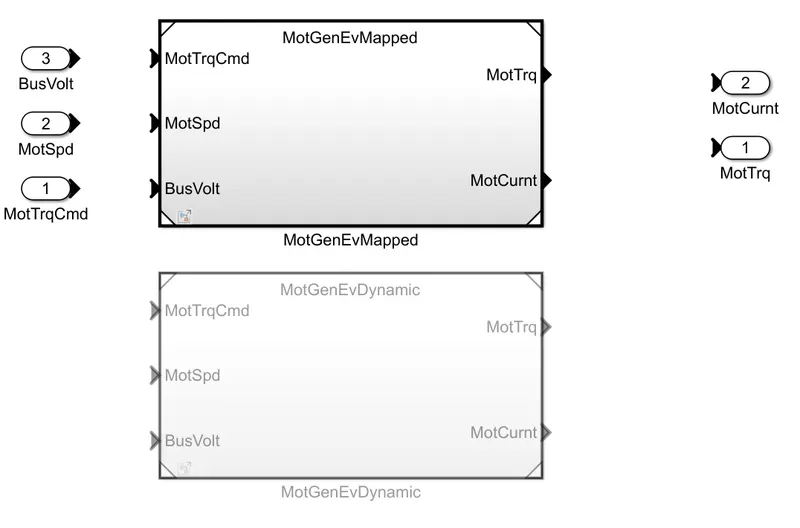
Figure1
In the figure 1 we can see the both mapped and dynamic model both the models are co-existing in the motor block set,by this we came to know which one model is activated , in this figure mapped model is activated means only one model is participated during the simulation and the inactive model is dynamic model.
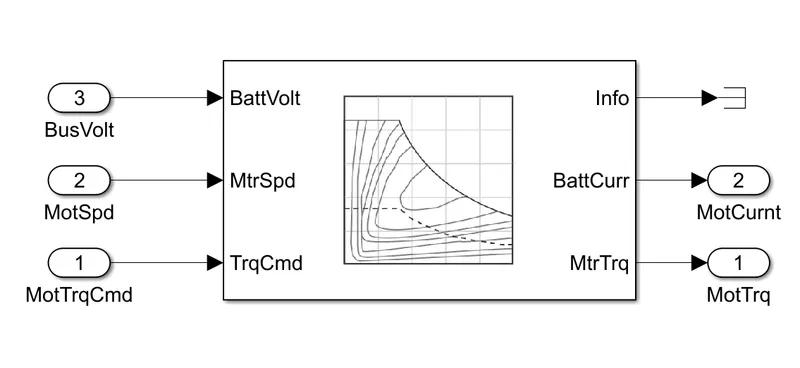
Figure2
In this figure we can see the mapped model inside it all these input specifications taken by the lookup table for the required information for to simulate the output.
If we use dynamic model then the output values display for random input values in real time simulation.
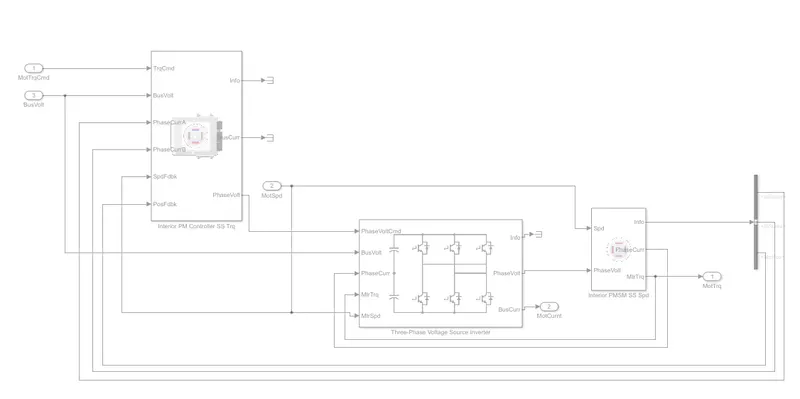
Figure 3
In this figure it shows the dynamic model setup of the motor block, the current model is simulated based on the mapped model of the motor block and one can change to dynamic model and switch between the two.
Figure4
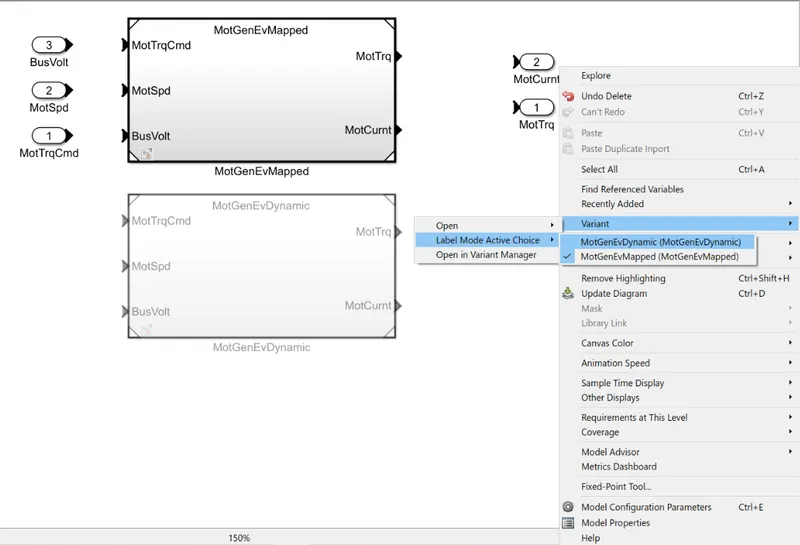
In this figure we can switch to other model using these options.For generator or the engine same methods are used to switch to other.
Conclusion: We saw the difference between both mapped and dynamic model.
2.How does the model calculate miles per gallon? Which factors are considered to model fuel flow?
Miles per gallon is the miles covered by a vehicle per 1 gallon(3.8lts) of fuel it is in the case of IC engine vehicles.When we come to the electric vehicle number of miles is covered into the equivalent to the range of vehicle which depends on the battery capacity.But the HEV uses both the battery and engine depends on the torque and power requirement.
Go to Power traain blockset in the documentation and then Hybrid Electric vehicle input power split reference applications. Now the path is to find out the fuel economy is HEVipsReference application then go toVisualization then go to performancve calculation this block consists of every parameters with their units.
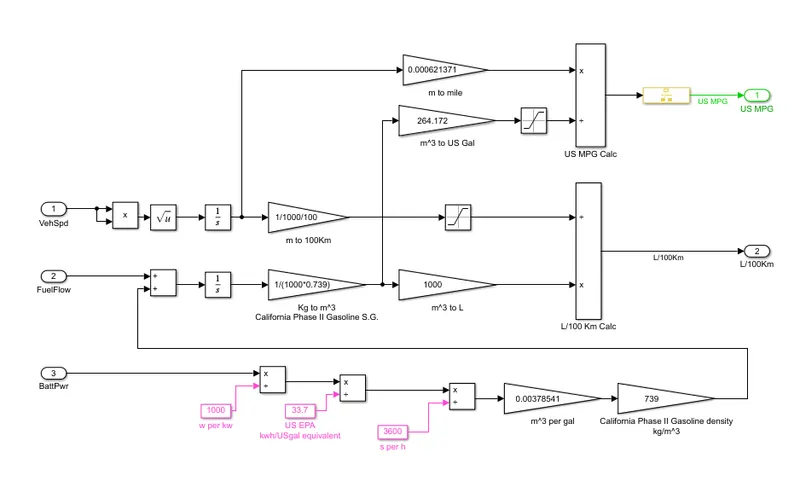
This model calculates the miles per gallon
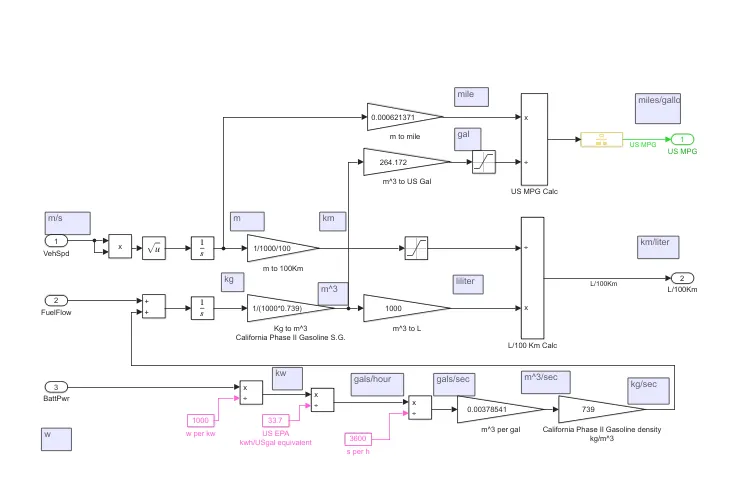
From this figure with the heip of three inputs we get a output in mileage but it has two different units.The three inputs are vehicle speed it is in m/s ,fuel flow it is in kg/sec and battery power is in watts all these gives the output as fuel economy or mileage.
Here it is a Hybrid electtric vehicle both the fuel and the battery is contributed to cover a capability of distance which is in mileage.The battery power is in watts it has to convert it into the kg/s which is of equivalent to California phaseII US Gasoline which is gives to power as the battery input when it is burned.Both these power sources are added to kg/sec and then it is integrated to find out the equivalent fuel consumed in kg which is then converted to volume consumed by it.The entire distance is again divided by the volume consumed for that distance.Since it is a hybrid electrical vehicle this model fuel flow requires a battery power consumption from watt to cubic meter per gallon.
This unit miles/gallon is a US stabndard unit.
Like the same process we have to do for EV also.
Conclusion:Here we can see how to calculate the miles per gallon and which the factors affect the fuel flow.
3.Run the HEV ReferenceApplication with WOT drive cycle. Change the grade and wind velocity in the environment block. Comment on the results.
To perform this task we have to go to the Hybrid Electric Vehicle Multimode Application Reference is simulated from the Power Train Block set to get the output result.
Go to drive source cycle and chane it to wide open throttle option.
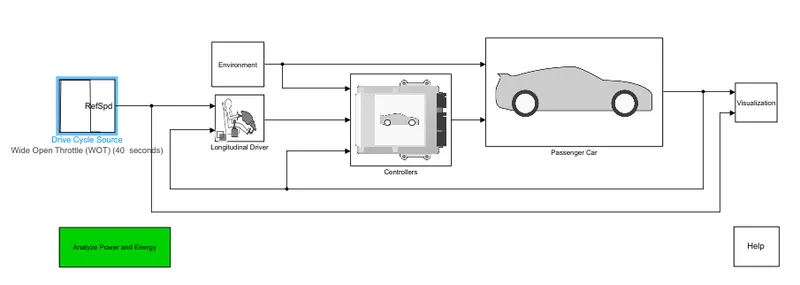
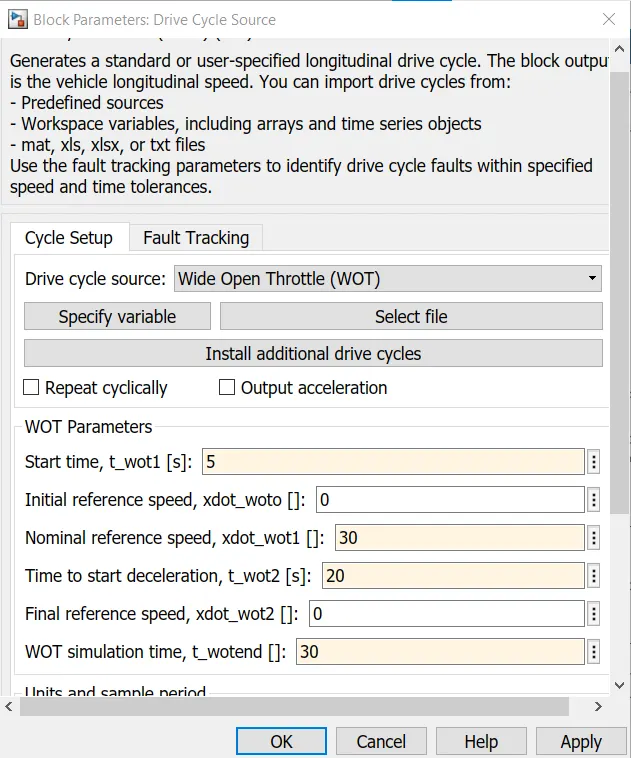
Now we have to change the parameters of wind and grade velocity.
To find this path go to the EV REFERENCE APPLICATION and then to the Environment.
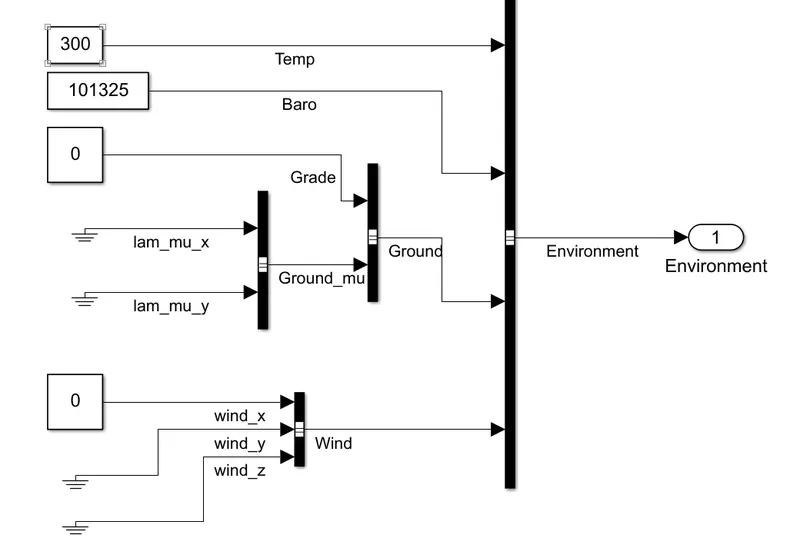
1.Grade=0,Wind Velocity=0
Go to the visualization block and open THE PERFORMANCE AND FUEL ECONOMY SCOPE FOR THIS DRIVE CYCLE
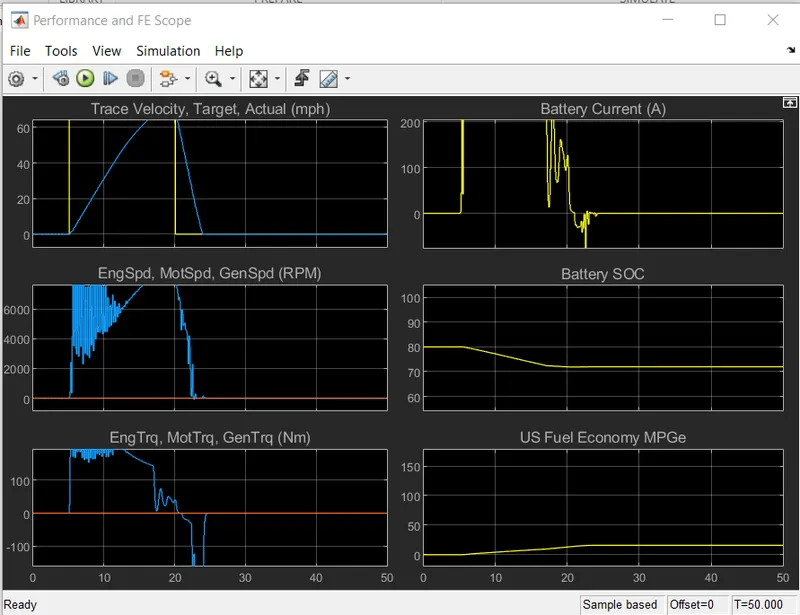
2.GRADE=5 ,WIND VELOCITY=10
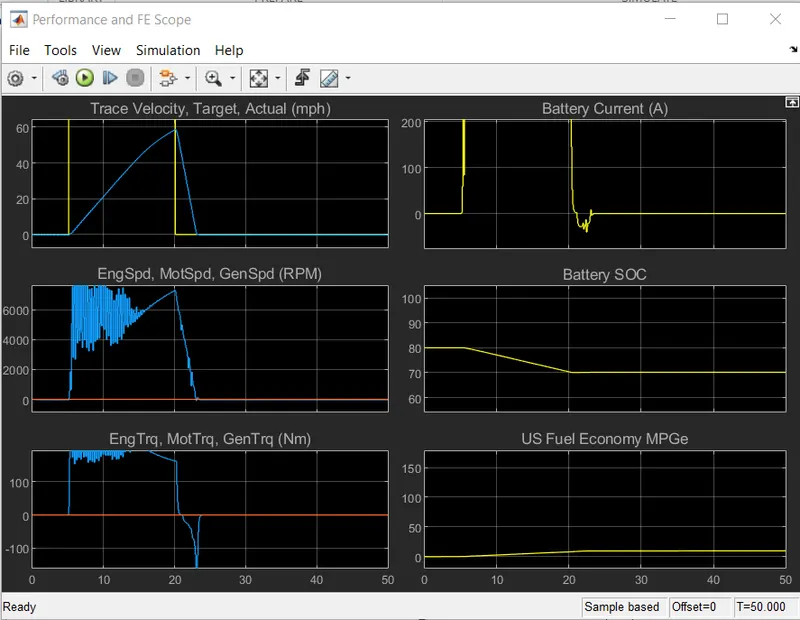
3.GRADE=10 ,WIND VELOCITY=5
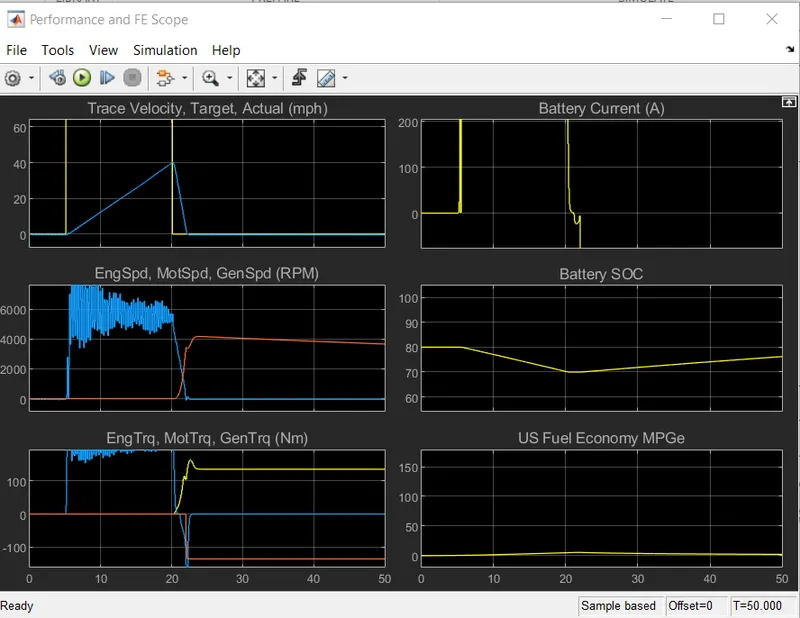
4.GRADE=10 ,WIND VELOCITY=10
5.GRADE=10 ,WIND VELOCITY=50
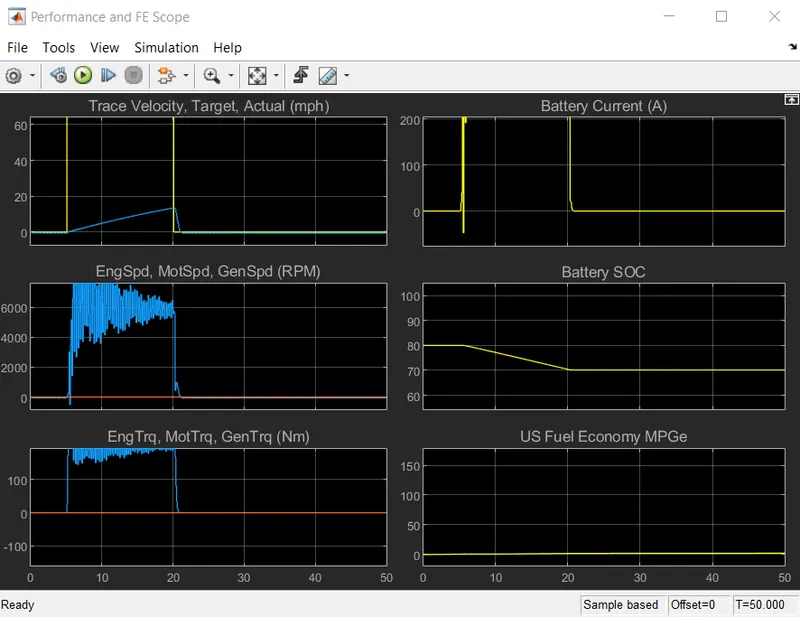
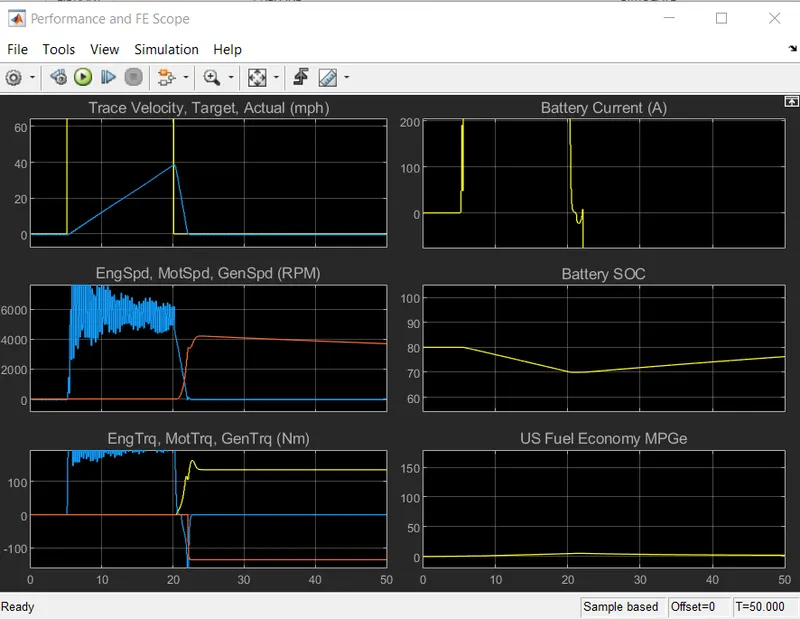
As we saw from all the different values of grade and wind velocity,we get different graphs of the simulation are velocity of the vehicle,speed of the engine motor generator,torque production of engine motor generator,battery current,battery soc and fuel economy.
Velocity of the vehicle will achieve a maximum value when the grade and wind velocity is minimum i.e 0.In this situation we can attain a maximum peak velocity.
Then in the second figure both the grade and velocity are present as grade=5 and wind velocity =10 at this situation battery and power requirements is not enough to meet these values ,so then the engine takes a extra power to maintain the vehicle speed,when the vehicle is accelerating this battery current also increases,when the velocity of the vehicle is constant then battery current is also constant.
When the vehicle decceleration starts the battery current goes in negative region indicating a regenerative braking.This battery SOC keep on decresing untill when regenerative braking starts i.e when the battery current is in the negative direction,afterwards battery SOC increases.Primary source of the power is battery and secondary source is engine which gets activated when there is SOC goes below than 70%.Now we can see the fuel economy goes on increasing up to nearly 30 afterwards it will decrease.
Fuel economy increase when the regenerative braking and charging of the battery is activated.
At the starting point,motor itself start the vehicle as the motor is high at the initial torque level.Then the generator keeps in charging the battery which is in red colour when this battery SOC comes below 70% so we can not seen the engine since it is always overlapped with the generator most of the situation.
In the next two graph plots we can see motor torque is high at the starting which is in blue line and then afterwards engine kicks which is in a yellow colour.As the battery gets charged genertor torque will be in negative which is in red colour.this indicates the vehicle is demanding more power to meet these grade and wind velocity values.
Increasing the values of grade and wind velocity,the vehicle feels very difficulty to maintain its desired speed path of the vehicle.So from the graph we can see that higher the values of grade and wind velocity then the slope of the road path also inclined then the vehicle can not reach these required values.So that the vehicle ends upwith not acheiving the desired velocity graph even if we apply also WOT condition.
If we change the grade value slightly we can observe a different graphs altogether.In the two graphs we gave a grade value same i.e 10 but wind velocity is differed i.e 5m/s and 10m/s to see the wind velocity performance.In the next i.e last graph we gave wind velocity value is 50m/s in this highest velocity value achieved by the vehicle during this simulation which is less than the above graph.
Conclusion:Here we can observe the Aerodynamic force and rolling resistance force,so these forces made the vehicle fuel and power,since we can see the high velocity of the vehicle when the grade and wind velocity are zero.
4.Keeping all other parameters same, compare the simulated results of hybrid and pure electric powertrains.
HEV(Hybrid electric vehicle):
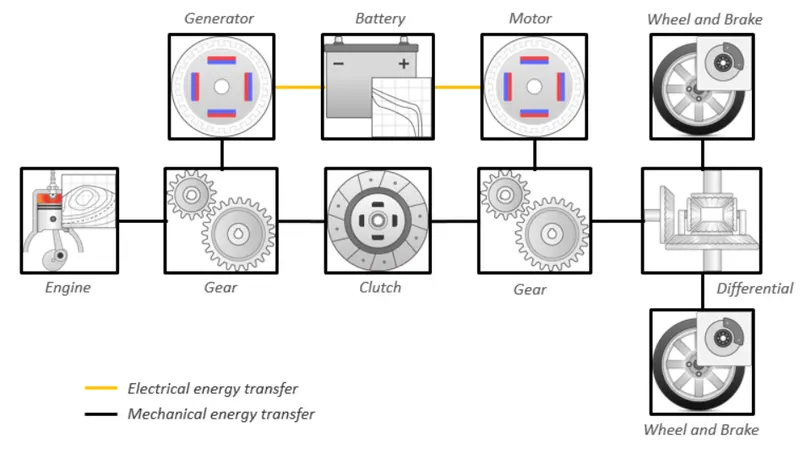
This hybrid vehicles combine both the combustional engine(ICE) and the electric propulsion system.The electric powertrain is present then we can achieve a better fuel economy.This degree of electric vehicle also variant.The common form EV is Hybrid electric vehicle is bus,car,trucks..This electric vehicles have one or more electric motors or traction motors for the propulsion.The ev vehicle may be get the power through a collector system by electricity from off vehicle source or may be self contained with a battery,solar panels,fuel cells or an electric motor or an generator to convert this fuel into electricity.
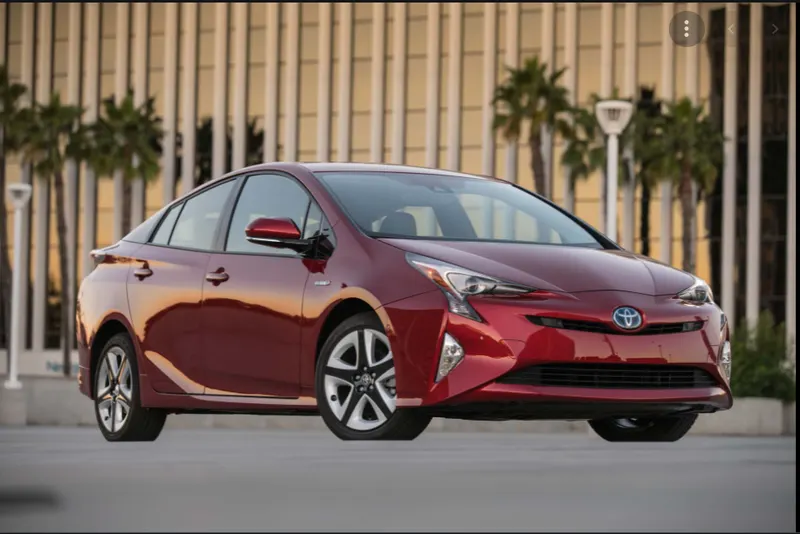
EV image with vehicle components involved:
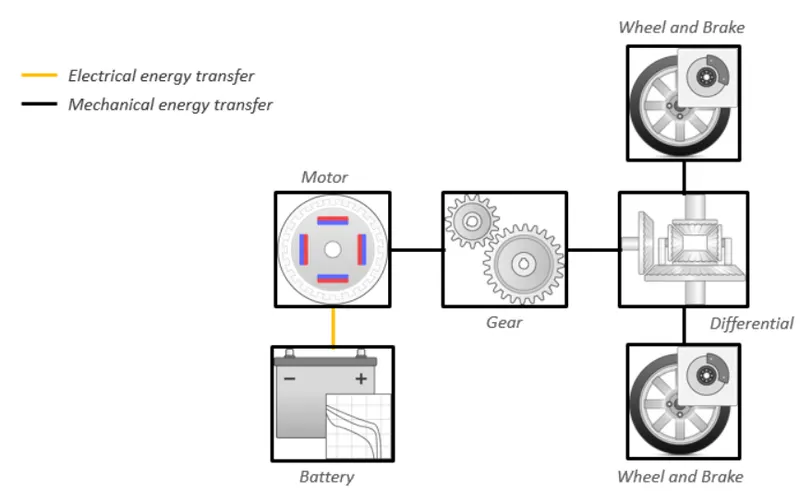
HEV image with vehicle components involved:
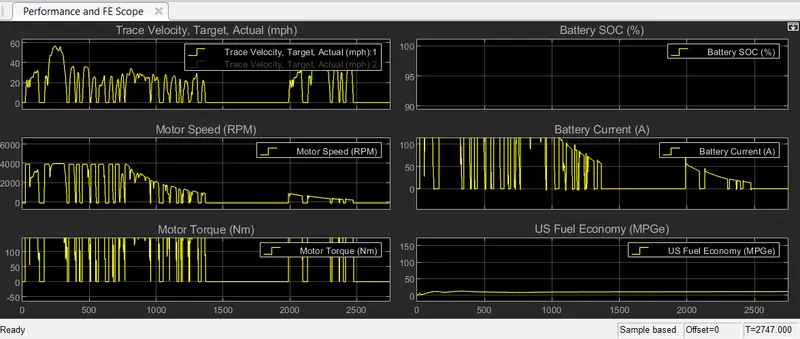
Output Simulation result of EV vehicle with FTP75 drive cycle as default keeping all the parameters are same:
Here we kept grade =15 degree and wind velocity =15m/s
Output Simulation result of HEV vehicle with FTP75 drive cycle as default keeping all the parameters are same:
Here we kept grade=15 degree and wind velocity =15m/s 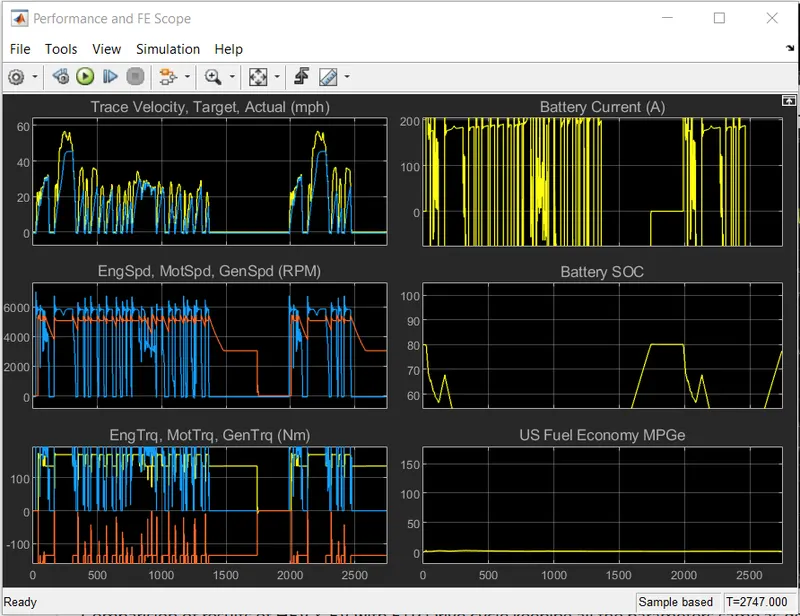
COMPARISION of Simulation result of EV and HEV vehicle with FTP75 drive cycle as default keeping all the parameters are same:
1.Both the trace velocity and target velocities are overlapping with each other following the FTP75 drive cycle for EV and HEV vehicles.
2.For EV,the maximum motor speed is 4400rpm and for HEV is the maximum motor speed is 7000rpm in the FTP75 drive cycle.But in the HEV the engine and generator speeds are overlapping with each other in this case the maximum value is 5500rpm might be used less to operate the vehicle compared to motor.
3.When the vehicle is at the initial stage at the starting speed is zero as per the input drive cycle FTP75 the torque is 130Nm.When the vehicle reaches maximum drive cycle torque is less when the vehicle starts deccelerating torque becomes zero and reaches to negative value after reaching negative value again it is able to reach its maximum value with the vehicle coming to zero speed
In the case of HEV,motor torque is maximum at the initial condition as the vehicle speed increases torque goes on decreasing except motor,engine and generator the vehicle operated with the drive cycle to meet the vehicle torque and power requirements but the torque value becomes positive and negative in all the time when the vehicle starts.
4.When the battery SOC goes on decreasing when it uses the battery power and it gets on charging when the vehicle starts deccelerating its called regenerative braking mode.
In the case of HEV,thermistor control method is used to operate the battery charging and discharging of the battery.the battery operation region is set to 80-70%.In this case we can use both the battery and fuel according to the vehicle power requirements.The vehicle can use either mode to consume the fuel or SOC of battery mode.When the vehicle is deccelerating then the battery gets charged again this is called as regenerating braking mode of the vehicle and also battery charging of the vehicle is supplied when it is running with the engine mode from the generator so the battery is charged in both the ways either in regenerative mode or the engine mode.
5.According to our vehicle acceleration requirement the vehicle takes a less,moderate or high current at any instant in the drive cycle,when the vehicle is operated in the EV mode but the battery current is increased again when the battery is recharged either from a regenerative braking mode or by engine generator mode.But the vehicle consumes fuel when it is in engine mode of 500amp to accelerate the vehicle as WOondition and the current value has come down to 180amp before the vehicle deccelerates starts from negative 250 to zero and after that starts battery charging through regenerative braking mode.
6.US Fuel economy almost closed to zero through out the period ,In HEV vehicle as per the battery operating region set by the controller the battery charging and discharging currents are in between -250 to 300 through out the cycle.
7.In the EV ,fuel economy starts from zero and reaches to maximum after it is continued in between 150 to180 as per the drive cycle pattern,so fuel economy depends on the drive cycle and almost remains conatant.
In the HEV,fuel economy able to reach 14 mpg and maintained from zero initialy since the vehicle is operated both with the battery and engine mode simultaneously and alternatively.
Conclusion:Here we can observe the maximum power and the torque requirement of the vehicle is satisfied only when the vehicle operated in HEV mode wher both engine and motor is operated in the same time but not in EV mode.