Week - 4
- Implement control logic of a “washing machine” using Stateflow as per given sequence:
- If the power supply is available, the system gets activated
- If the Water supply is not available, stop the process & indicate through LED
- Soaking time should be 200s followed by Washing time of 100s.
- Then rinsing happens for next 20s & dryer runs for 50s
After all the processes have completed turn on the finished LED
Control logic:
It is a logic which controls the operations of a program.It will responds for the conditions according to the user and performs the task, it has structured in the program.It can be modelled using a state diagram which is a hierarchial state machine.
Stateflow:
It is a graphical language which includes state transition diagrams,state transition table,flow chart and truth table.In this we can see how matlab algorithms and simulink model will react to the input signals, events and time conditions.It will have sequential design logic that can be simulated as a block with in a simulink model. Graphical representation tells about to analyze and debug the logic while it is running.
Working of the washing machine according to the condition given above:
1.First we have to put the clothes.
2.then we have to supply a power, here we have to check if the power supply is on then the system is ready to run if not it will not run.
3.Then we have to supply a water ,here we have to check if the water supply is on then the system is ready to run or else it will stop the process and indicate through the LED.
4.After the water is filled inside the machine according to the how much clothes were inside it,i.e high,medium,low.Then it will soak the clothes for 200sec, then wash the clothes for 100sec.
5.For soak and wash total timetaken by the machine is 300sec.
6.After washing the clothes,it will rinse for 20sec and remove all water out through drain.
7Then dry the clothes for 50sec.After this it will give sound as a completion of the process by indicating the LED.
Simulink model:
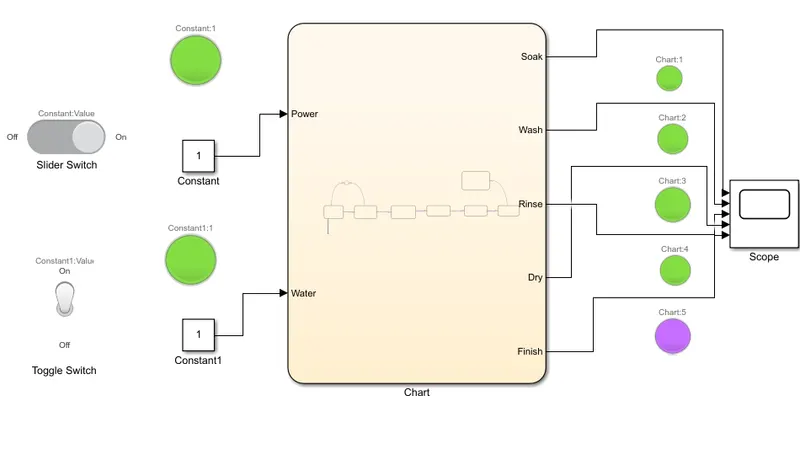
1.Take the two constant blocks for two inputs i.e Power supply and Water supply then connect it two the chart as input blocks.
2.Then take a slider switch to on and off for the power supply,toggle switch to on and off for water supply.
3.Connect two lamps for power and water supply,if they both supply on then the lamp displays green colour otherwise it will glow as red colour.
4.Take 5 outputs from the chart and connect it to scope for the plotting a graph.For each output take a lamp and connect it to eachother.
5. *Soak output will do the action upto 200sec and displays green colour in the lamp if not display red colour.
*Wash output will do the action upto 100sec and displays green colour in the lamp if not display red colour.
*Rinse output will do the action upto 20sec and displays green colour in the lamp if not display red colour.
*Dry output will do the action upto 50sec and displays green colour in the lamp if not display red colour.
*Finish output will do the action upto 370sec and displays purple colour in the lamp if not display red colour.
Simulink Model.
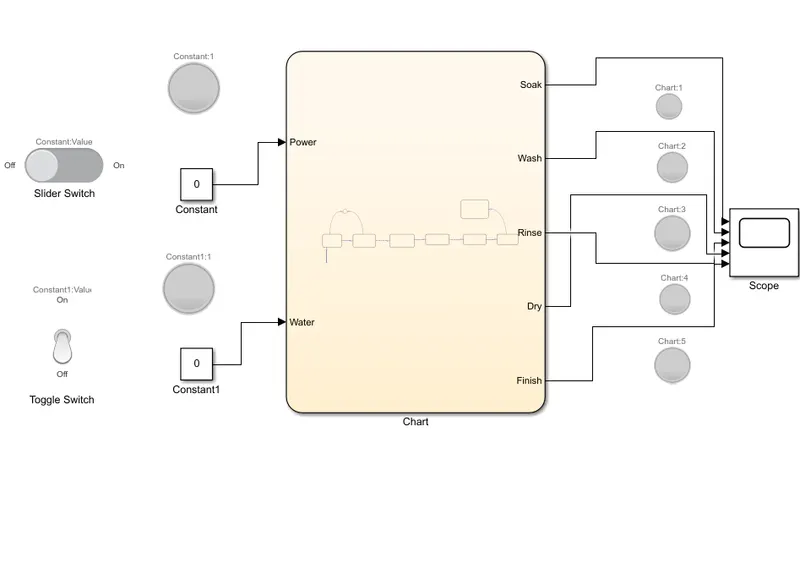
Chart:
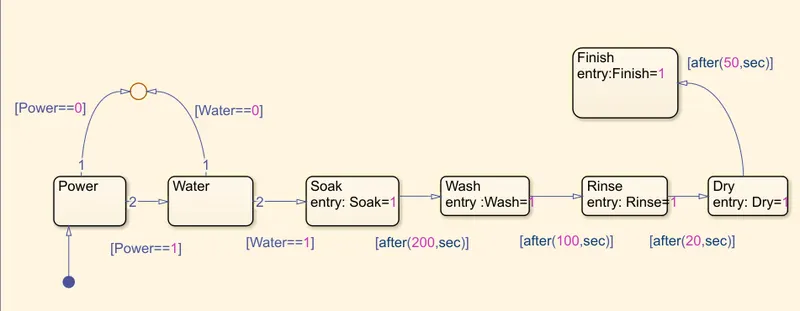
In this chart we will take states and enter the conditions,
*Power and water state enter the values and attach to the junction i.e condition.If p=0 and w=0 then it will not do any action.
*If both P=1,W=1 state then move it to soak state and assign a time value as 200sec,upto that it will perform the soaking action.
*If both supply is on state then move it to wash state and assign a time value as 100sec,upto that it will perform the washing action.
*If both supply is on state then move it to rinse state and assign a time value as 20sec,upto that it will perform the rinsing action.
*If both supply is on state then move it to the dry state and assign a time value as 50sec,upto that it will perform the drying action.
*Now all these actions are over it will go to the finish state.
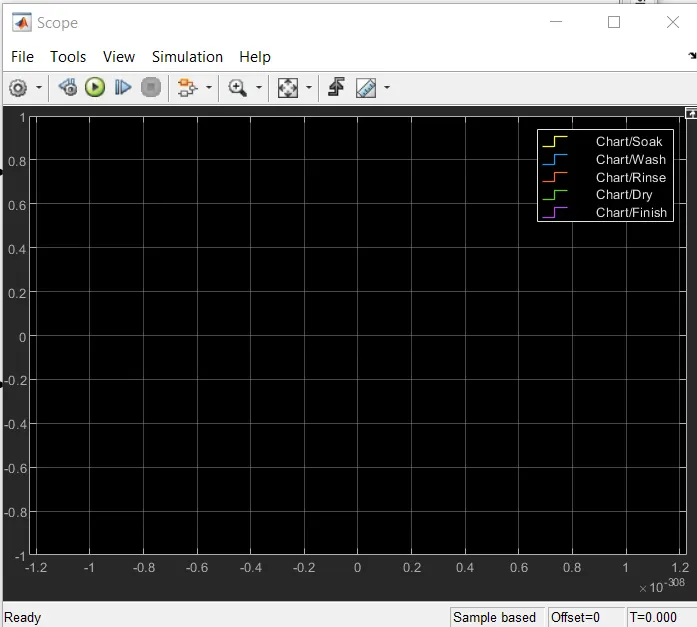
# When Power supply=0,Water supply=0,Stop time=0sec.
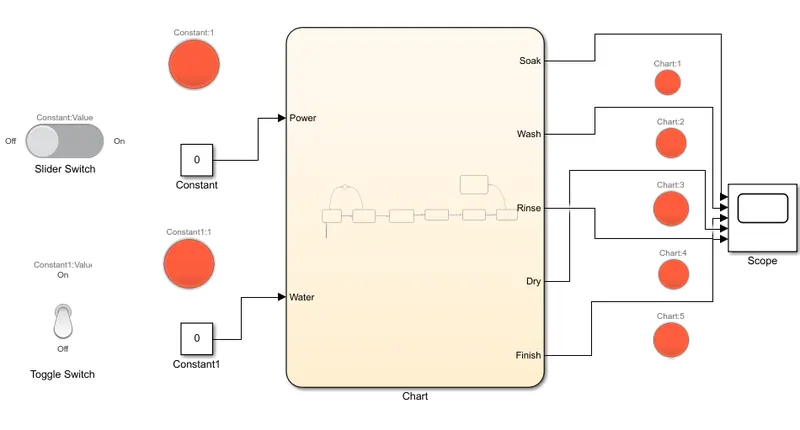
# When Power supply=1,Water supply=0,Stop time=10sec.
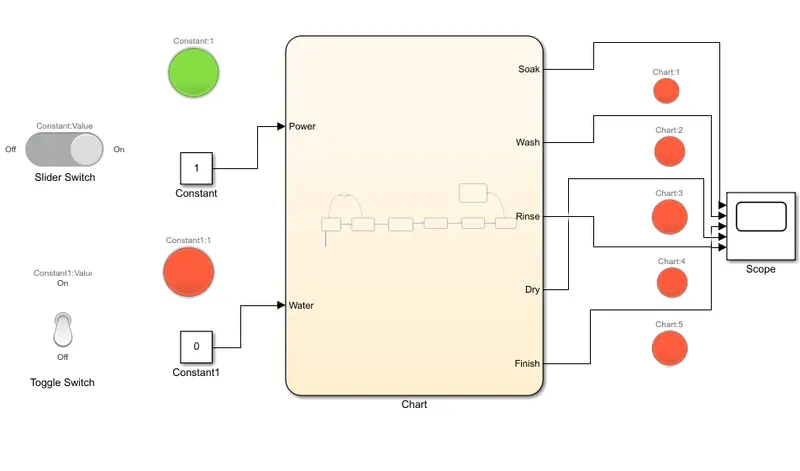
In this case ,the machine will give the zero result in the scope and lamp will glow red colour except power supply input state.
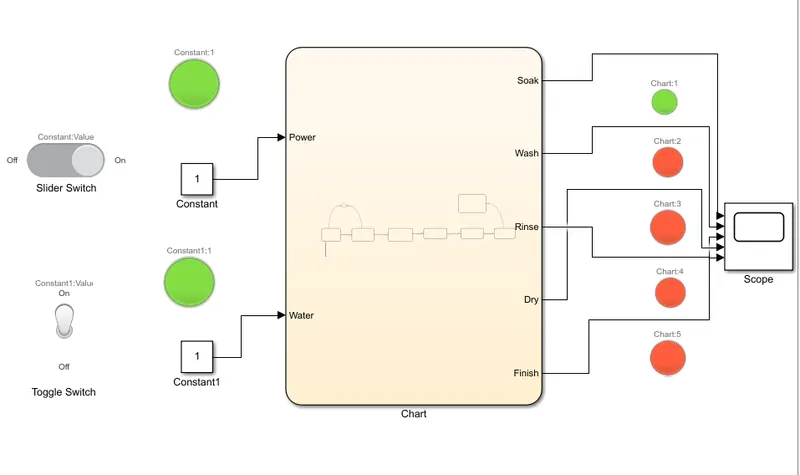
#When Power supply=1,Water supply=1and Stop time=200sec.
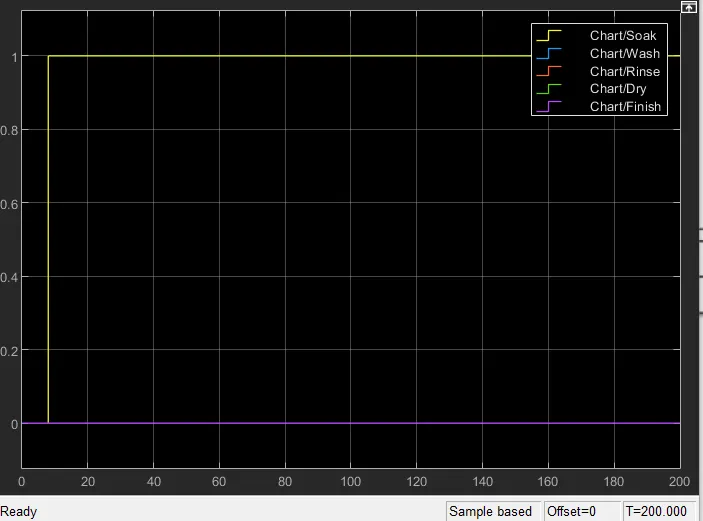
In this scope we can see the time delay in x axis i.e from 0 to approximately 7 it is the time taken to powersupply and water supply to check whether it is on or off.
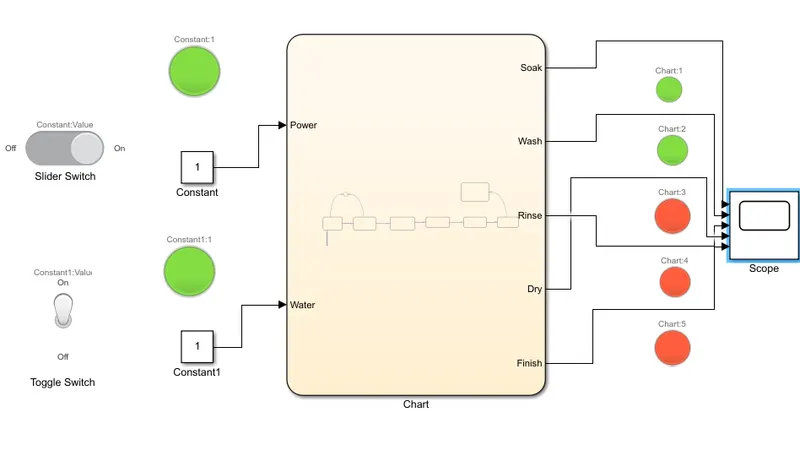
# When Power supply=1,Water supply=1,Stop time=300sec.
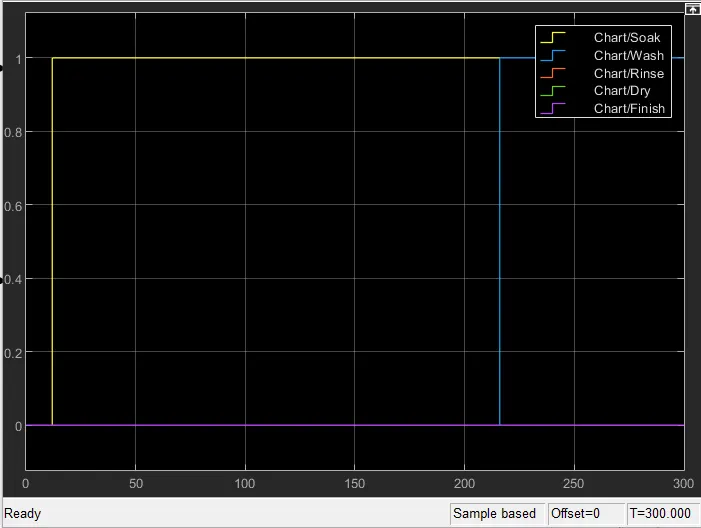
#When Power supply=1,Water supply=1,Stop time=320sec
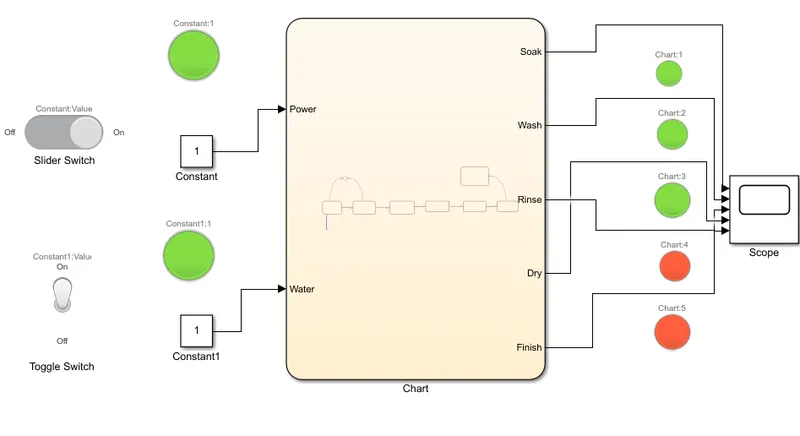
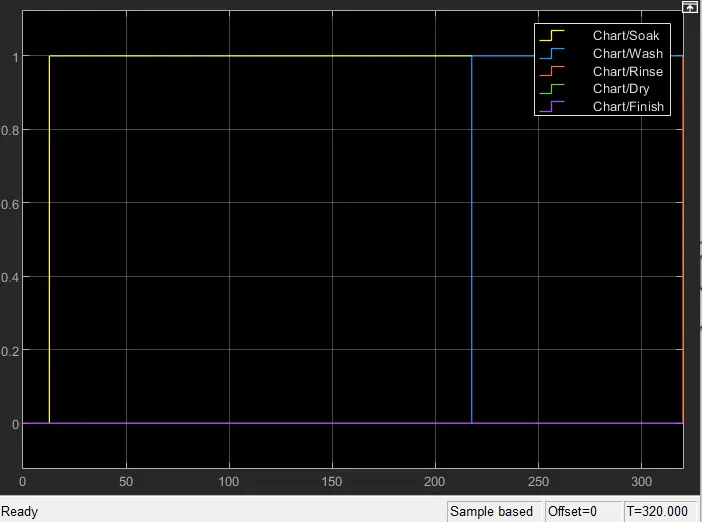
#When Power supply=1,Water supply=1,Stop time=370sec
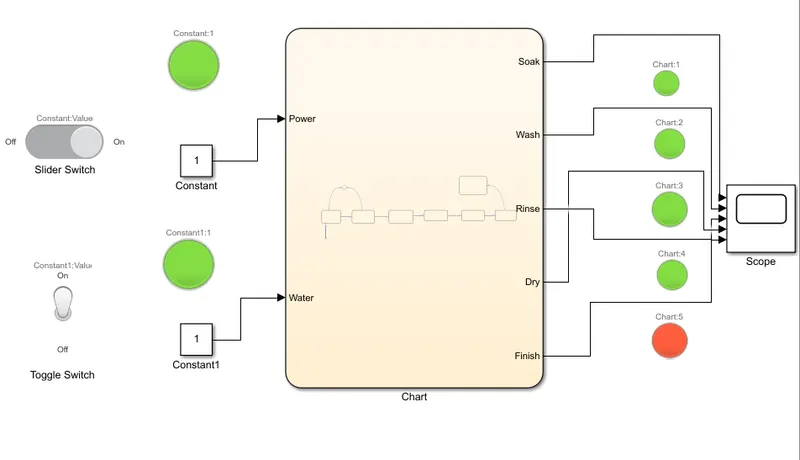
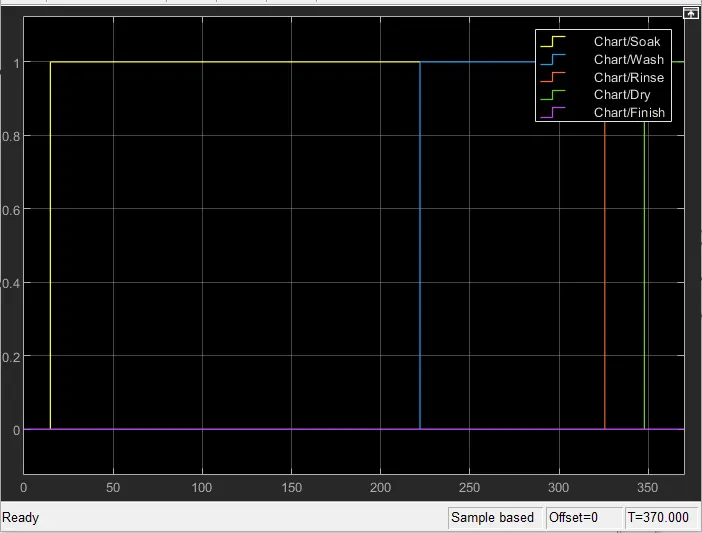
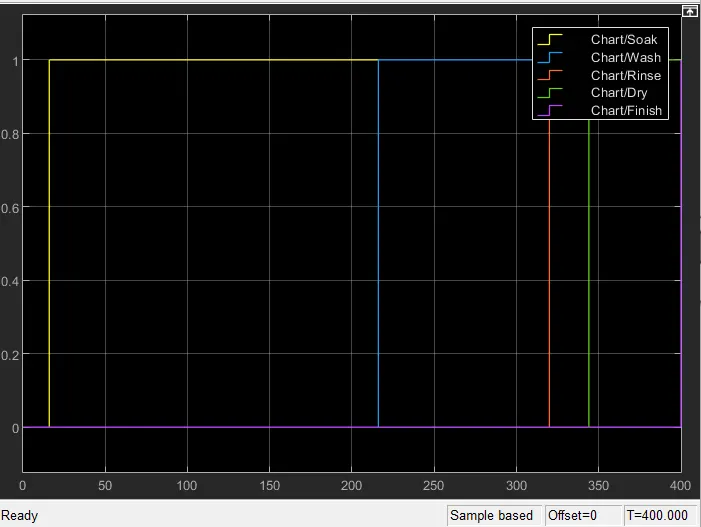
# When Power supply=1,Water supply=1,Stop time=400sec
2. Make a Simulink chart for the “Gear shift” logic as per below conditions:
Speed Range(kmph) Gear
0 to 15 1
16 to 25 2
26 to 40 3
41 to 60 4
Above 61 5
Give speed input while the simulation is running & display the gear number.
Gear box:
It is a transmission box,in this we will shift the gear from one to other as per the vehicle required condition according to the road and load capacity of it.Changes the engine speed into torque when the vehicle is required.Therefore it is known as a engine converter.
The working is,it provide the torque i.e speed to move the vehicle according to the vehicle required to move,depend on the road and load capacity.It changes the gear shift by changing the gear ratio between engine crankshaft and vehicle drive wheels.When we need to move the vehicle backward then we want to shift the gear box to reverse.After this we have to shift the gear to neutral before shift the gear to 1,2,3,4.
Simulink model:
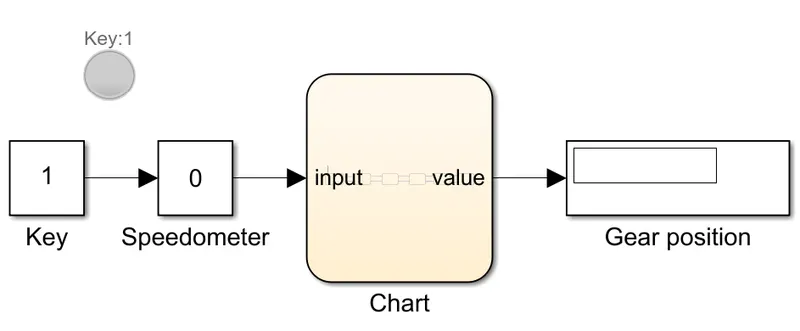
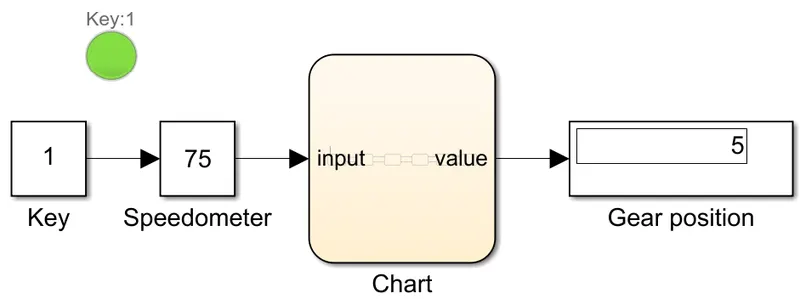
*In this model we will do the execution by connecting inputs outputs to the chart.
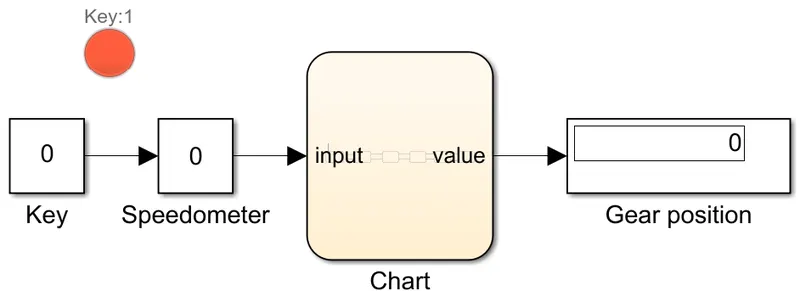
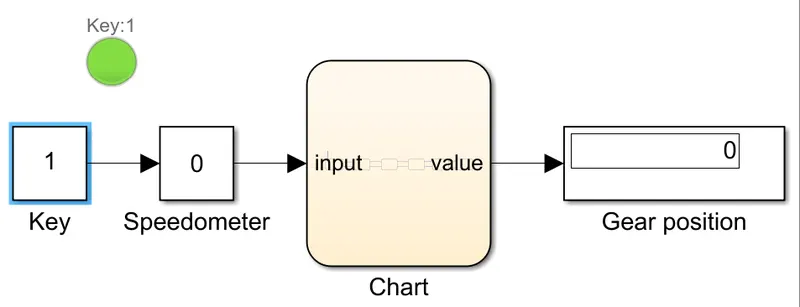
*First we have to take a constant as a key and it has to connect to the lamp to indicate the key is off or on.If the key is one then the lamp will on.And the task is ready to perform i.e to move the vehicle according to our requirement.If the key is zero then we cannot move the vehicle only.
*Then take a slider gain for move to the required speed and it is named as Speedometer.If it is 0 and key is on then the ignition is just on but it cannot move the vehicle unless we will shift the gear from neutral.
*Display block is used to connect to the output of the chart and it will display the gear position,in which gear the vehicle is moving.
*First we will connect the key to speedometer block then it is fed to the chart through input and it performs the task and gives the value to the gear position and displays it.
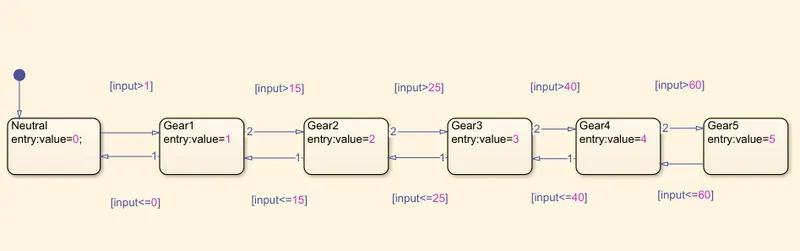
Flow chart:
*We have to take a state blocks according to the given condition.
*First we have to take Neutral state block,here it has to check the condition ,if it is 0 then it gives <=0.
*If it is >1 then it moves to the second state i.e gear1 and checks the condition,if it is >15 then it changes to the gear2 state otherwise it checks for input<=15 then it will not change the state.
*If the gear is in gear2 state it checks the condition if the input>25 then it will change to gear3 state otherwise it checks input<=25 then it will be in the gear2 state.
*If the gear is in gear3 state it will check the condition if the input>40 then it will change to gear4 state otherwise it checks input<=40 then it will be in the gear3 state.
*If the gear is in gear4 state it will check the condition if the input>60 then it will change to gear5 stae otherwise it checks input<=60 then it will be in the gear4 state.
# When Key=0,Speed=0 then Gear Position=0
# When Key=1,Speed=0 then Gear Position=0 because only ignition will on vehicle is not moving.
Here we can change the speed in slider gain block.
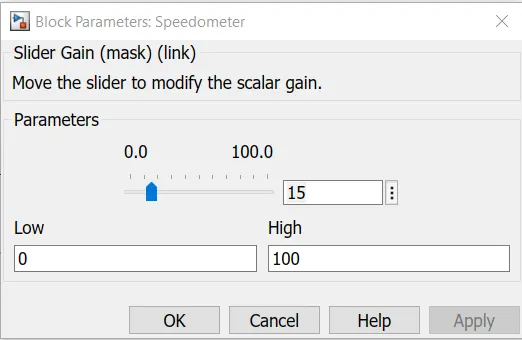
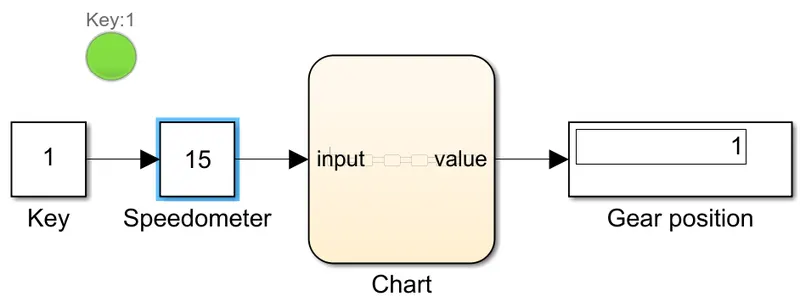
# When Key=1,Speed=15 then the Gear Position=1
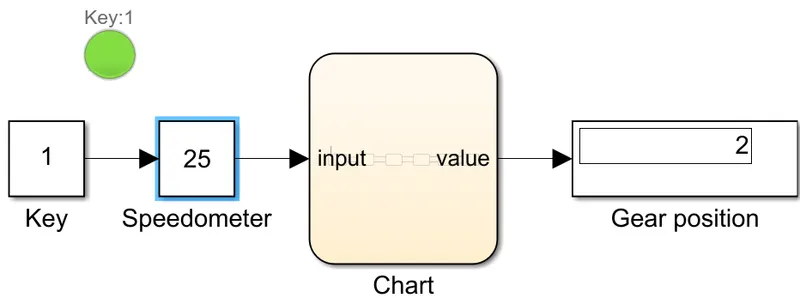
# When Key=1,Speed25 then the Gear Position=2
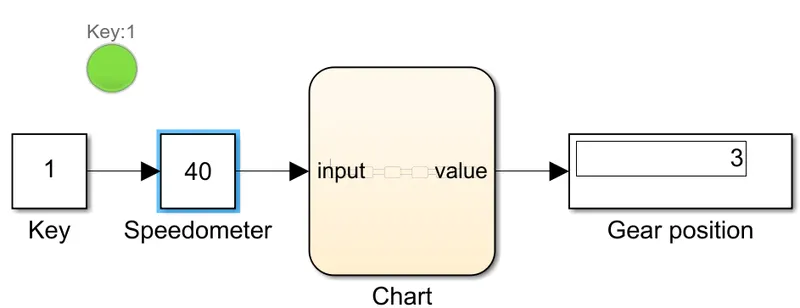
# When Key=1,Speed=40 then the Gear Position=3
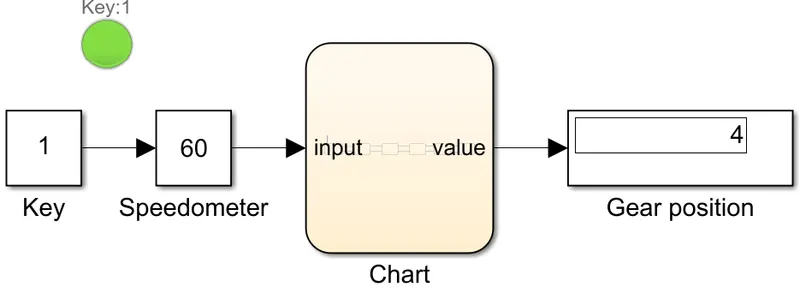
# When Key=1,Speed=60 then the Gear Position=4.
# When Key=1,Speed=75 then the Gear Position=5.
Conclusion: Hence we studied how to do the simulation of washing machine and gear shift mechanism and executing the stateflow.