Week-4 Challenge WOT Condition Part-2
Study 1:
Objective:Difference between mapped and dynamic model of engine, motor and generator and to change model type
Model uses a set of steady-state lookup tables to characterize engine performance.
The tables provide overall engine characteristics, including actual torque, fuel flow rate, BSFC, and engine-out exhaust emissions.
Mapped model:
- Mapped model represents macro engine behavior as a set of look up tables(brake torque, fuel flow , air mass flow , exhaust temperature,efficiency and emmisions) as a function of commanded load measured engine speed.
- All the data points are pre assigned in the look up tables.
- The output values are stored for corresponding given input values of engine motor and generator
- As this model doesnot run on real time paramaters , the accuracy is less but the simulation time is very fast.
Dynamic Model:
- It uses the combination of the outputs from various subsystems to generate the output.
- It runs with the real time simulation where the required input from the drive cycle is taken and for that individual real time simulation gets performed and adding all the results of the subsystem gives the output for the simulation.
- The accuracy of this model is very high as it considers the real outputs from all the subsystem to generate the output. And the simulation will take long time to complete as it has so many individual simulations running by all the subsystem of the engine , motor and generator.
To change the model type:
- After opening 'EV Reference Application' example double click on Passenger car and inside passenger car double click on electric plant.
- So in this subsystem MotGenEvMapped block is provided right click on it and click explore.
- In the Explore block we can change the model type to mapped or dynamic based on the variant type or label mode.
Variant Subsystems operate in expression mode or label mode. In expression mode, the variant control can be a boolean expression, a Simulink.Variant object containing a boolean expression, or ‘(default)’. In label mode, the variant control is a string that is not evaluated and the choice used in simulation is determined by the label mode active choice parameter.
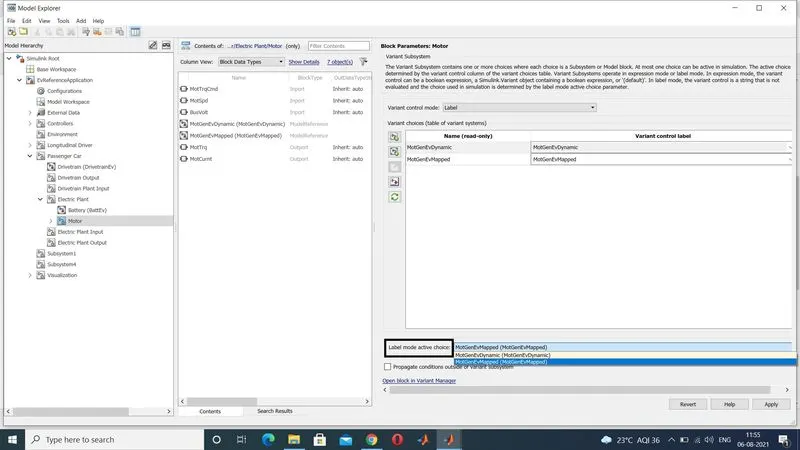
From the label model we can change the required model type and click on revert and apply.
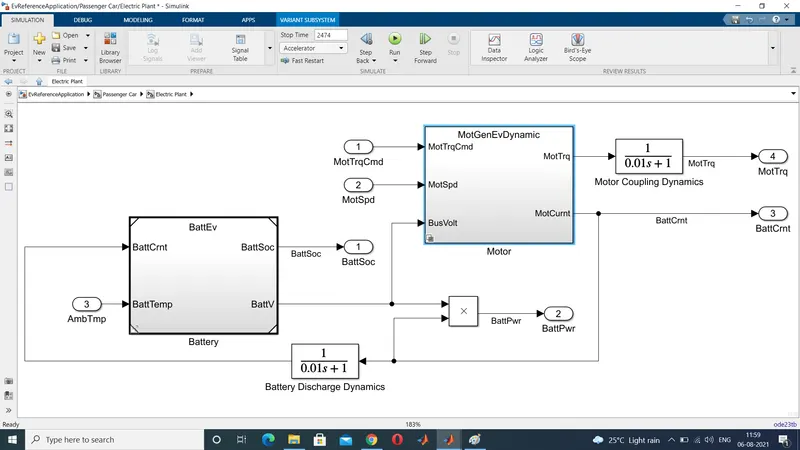
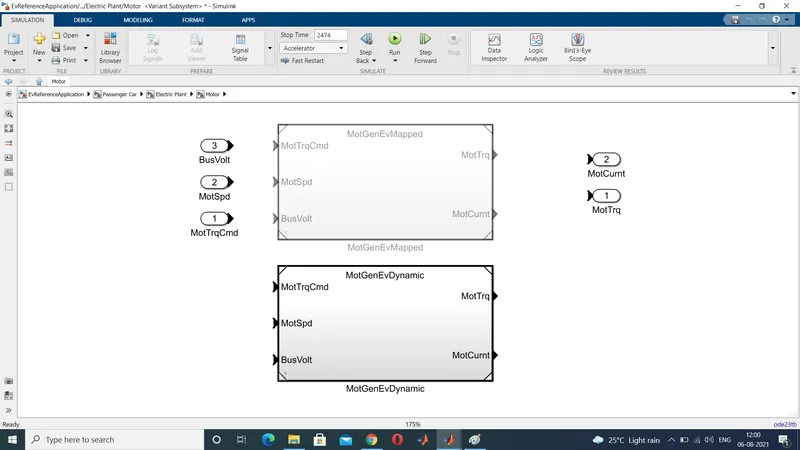
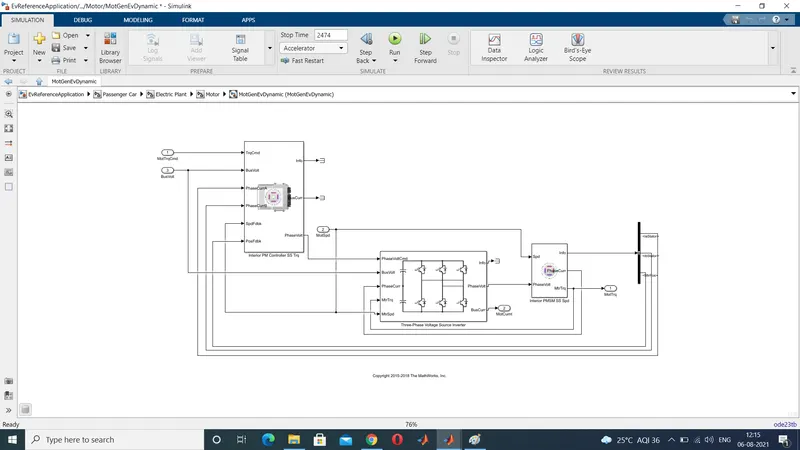
By selecting in MotGenEvDynamic , the block changed to MotGenEvDynamic as shown below
Method 2:
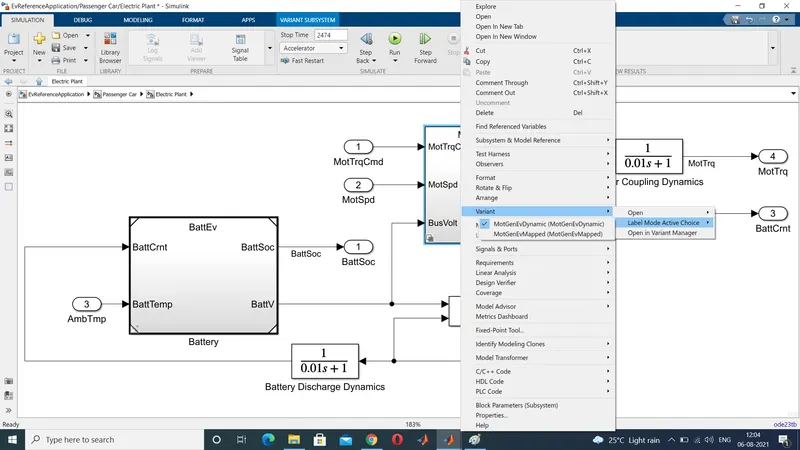
- Inside the electric plant right click on the motor block , the variant option is visible we can change the model type as shown in the below fig
Study 2 :
Objective:To calculate miles per gallon
Miles per gallon (MPG) is a fuel economy rating determined by how far a car can travel on a gallon of gasoline or diesel. MPG is also the primary measurement of a car's fuel efficiency: The higher a car's MPG, the more fuel efficient it is.Although the metric version would be kilometres per litre, MPG is adopted in many metric-system countries, like Canada.
To calculate Miles per gallon:
After opening the HEV Reference Application model , double click on visualisation , inside the visualisation performance calculations block(as shown below) is used to calculate the MPG.
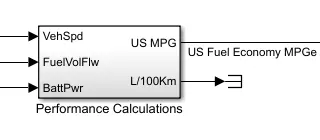
As shown in the fig, 3 inputs are taken into consideration
- Vehicle speed
- Battery power
- Fuel flow
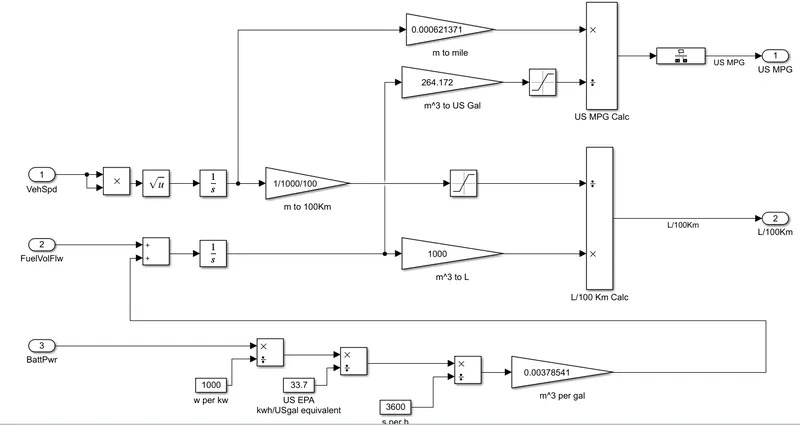
- Vehicle speed is an important factor while considering the fuel consumption at that particular time.
- To convert speed to distance we are integrating with time and doing the same by converting the velocity to get distance covered by integrating.
- Now the vehicle speed is in m/s which is multiplied by 0.000621371 to convert to miles.
- Fuel flow is in m3 which is multiplied by 264.172 to convert to US Gal
- similarly battery power enegry is also calculated to US Gal
- First the battery value is converted to watts kwh by diving it by 1000 and then USgal equivalent by dividing with 33.7 i.e 1gallon =33.7kwh
- The value is again divided with 3600 to get in seconds and then multiplying with 0.00378541 to convert to m^3 per gal
- Now converted values of m to mile is divided with m^3 to US Gal to get MPG as shown above.
Study 3:
Objective : To run the HEV ReferenceApplication with WOT drive cycle and Changing the grade and wind velocity in the environment block
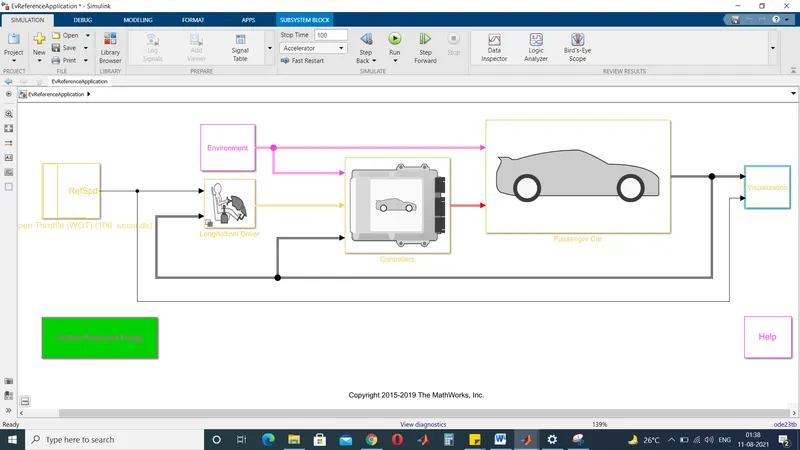
- HEV multimode reference application example is opened in the simulink model and we can change the parameters and run the simulation as required.
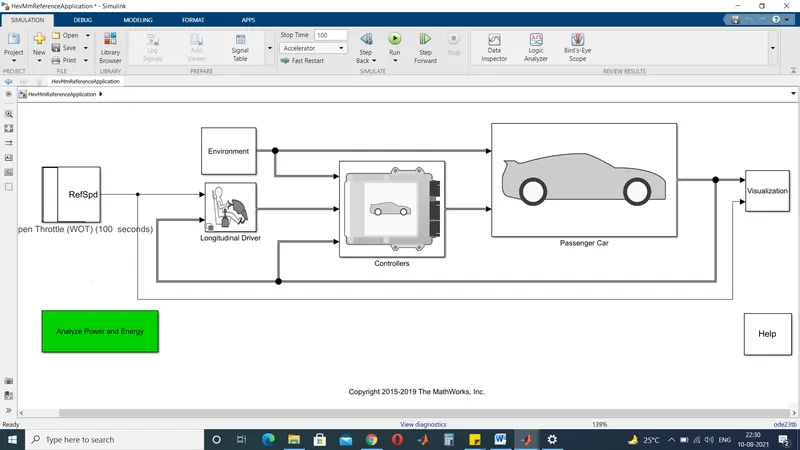
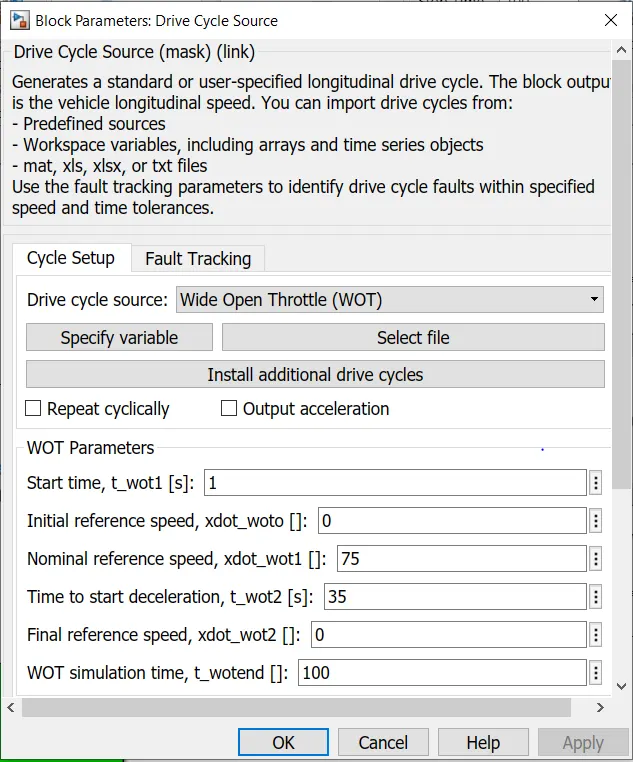
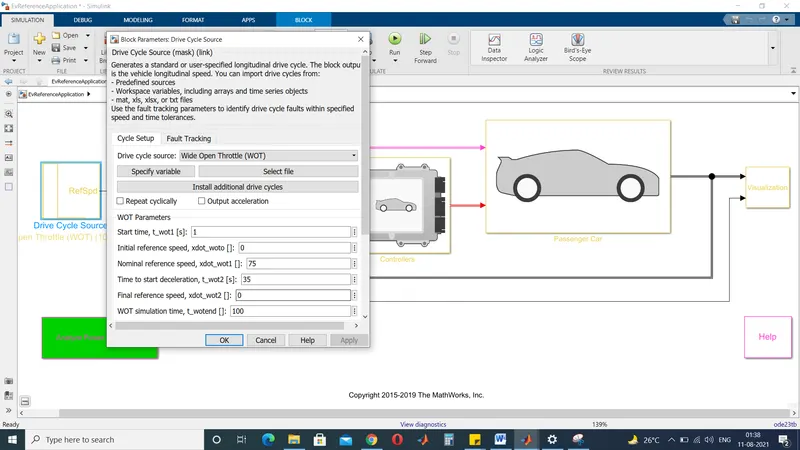
- Here in this study we have changed the drive cycle to WOT (wide open throttle) drive and parametere are provided as shown below in block parameters:Drive cycle source
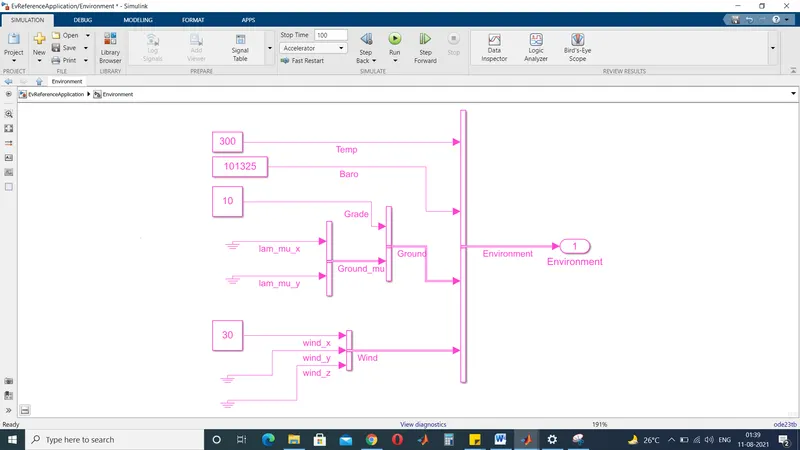
- In the HEV reference application, double click on the enviroment block.
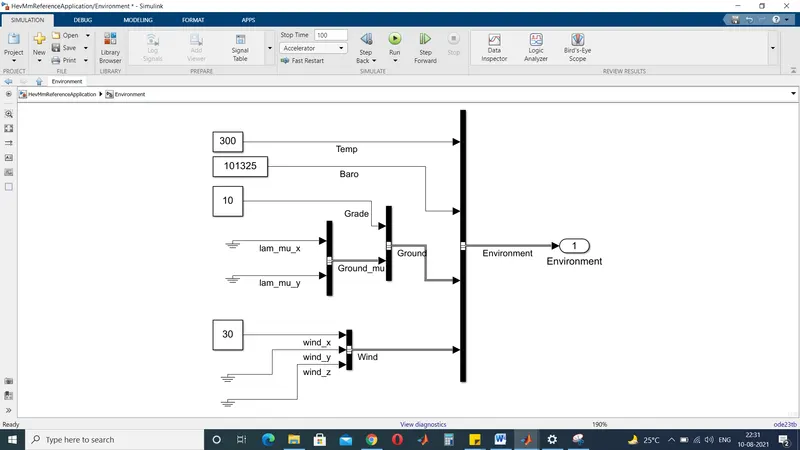
- Inside the environment block we have temperature,pressure ,grade and wind velocity inputs.changing the values for grade and wind velocity to 10 and 30 respectively as shown below.
- Changing the stop time to 100seconds , and run the simulation.
- once the simulation is completed the graph is plotted which is provided in the visualisation block
- Inside the visualisation , double click on performance and FE scope.
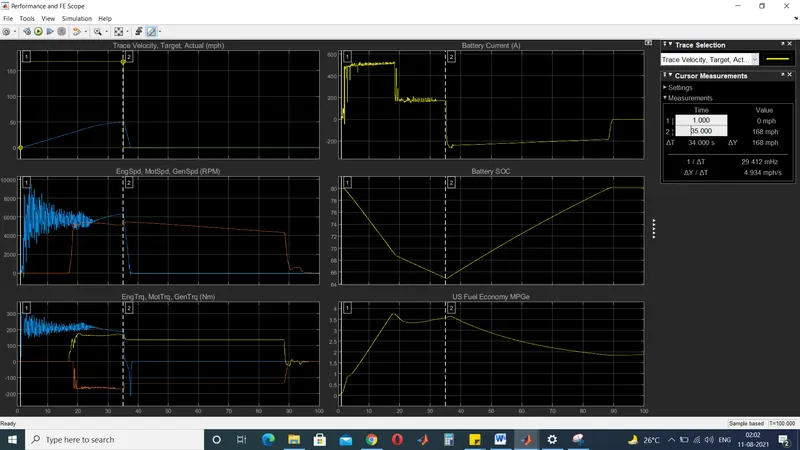
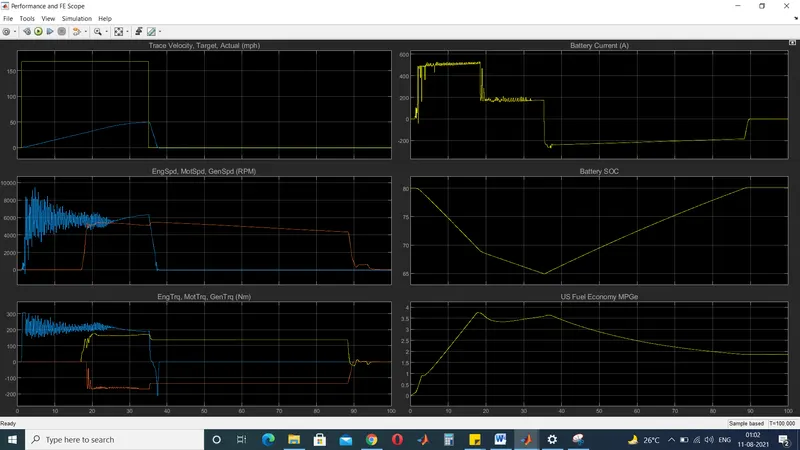
- The perfomance and FE scope contains 6plots.
- Each plots have a particular results and can be studied with the help of cursor measurement .
- If we change the cursor on one plot the cursor moves on the other plot too which allows to study the results in better way.
- with this cursor measurement we can compare the plots and infer on the performance of each system.
Conclusion:
- In the first plot , we can see the deviation time between the actual and trace velocity is 34seconds.
- The second plot shows Engine speed ,motor speed & generator speed , we can see that generator starts once the Battery SOC is going below 70% iin the Battery SOC graph.
- when the depletion starts in the Battery SOC , the generator starts operating and simultaneously battery is charged.
- When the vehicle travels there is an increase in current since we need more power while accelarating. High the value of current higher will be the roation of shaft in the motor.
- Once the decelaration starts after 35seconds , regenerative braking begins and motor torque goes negative as shown in the plot 3.
Study 4:
Objective : Keeping all other parameters same, comparing the simulated results of hybrid and pure electric powertrains
- From study 3 , keeping all the parameters same we have compared the HEV reference application with Pure electric powertrains i.e EV reference application.
- In HEV we have engine and generators whereas electric power trains contains motor and battery.
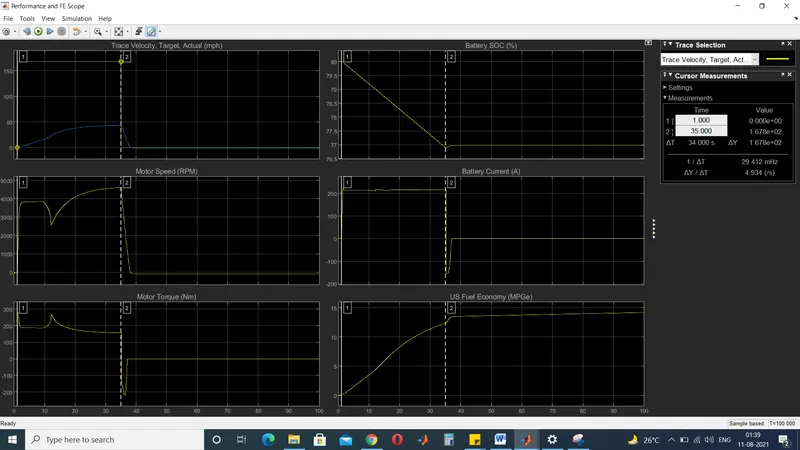
- when the vehicle speed decelarates the current goes down as shown in the battery current plot.
- The vehicle starts decelarate after 35s and motor torque and battery SOC dropsdown.
- Motor speed is being positive so this implies that the battery is charging i.e the motor acts as a generator
- The fuel economy in Pure electric is increasing
- The efficiency of pure electric powertrains is higher that Hybrid Electric Vehicles.
HEV :
- The battery SOC in HEV increases whereas in EV it drops down
- The fuel economy decreases in HEV but increases in EV