Week-4 Challenge WOT Condition Part-2
Ques 1.
Mapped Model
A mapped model uses a co-ordinated set of steady-state multi-dimensional lookup tables to characterize the performance (such as the actual torque, power, speed, fuel flow rate, etc) of an engine, motor and generator. Mapped models are used to conduct quasi steady-state engine simulations. Note that mapped models are developed using empirical engine data.
Dynamic Model
The behaviour of a dynamic model of an engine, motor and generator is described by the characteristics of the individual subcomponents. Dynamic models are used to analyze the impact of the engine's subcomponents on the overall performance of the engine. Analysis using dynamic models have a high level of fidelity provided the subcomponent models are accurately characterized and integrated.
Change model type using a Variant Subsystem
A variant subsystem can be used to implement an instance of a mapped model and a related instance of a dynamic model where only one model is active during the simulation. The appropriate model is made active by expanding the variant subsystem and selecting the corresponding model label from the Variant dialog.
Ques 2.
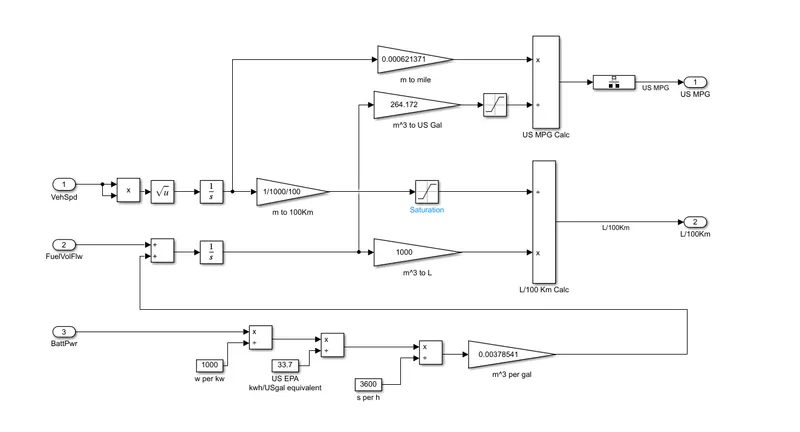
Per Figure 1, the US MPG is calculated by:
- Integrating the vehicle speed to determine distance travelled in meters,
- Converting distance from metric to miles using the appropriate factors, and
- Dividing the distance in miles by the total fuel consumed over distance travelled in US Gallons.
Per Figure 1, the energy drawn from the battery and the fuel consumed in the internal combustion engine (ICE) are both considered to determine the total equivalent fuel consumed in gallons.
Note that the energy drawn from the battery is converted to the equivalent fuel consumed (in m^3 per second) using the appropriate US EPA factor (33.7kWh energy in 1 US Gallon). The integration of the sum involving the equivalent fuel flow from the battery and the fuel (consumed in ICE) is converted to gallons using the appropriate factor.
Figure 1. Fuel and MPG Performance Calculations
Ques 3.
The WOT drive cycle is applied in the top level HEV Reference Application as shown in Figure 2 to assess the impact of changing the speed of the headwind and the grade of the slope. The HEV reference application has the powertrain configuration as shown in Figure 3. The simulation duration is 50 seconds.
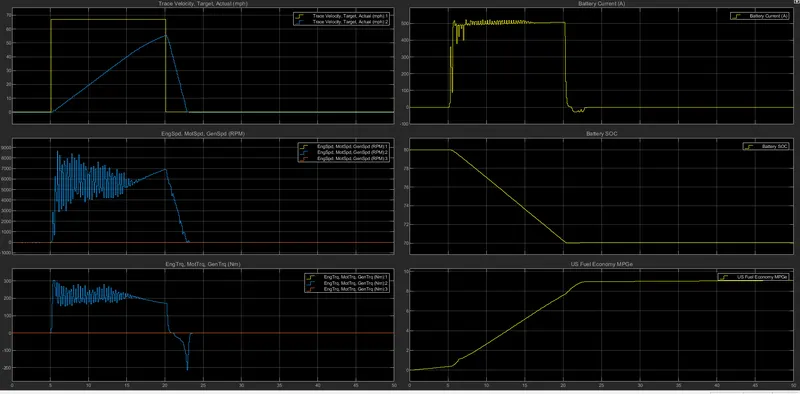
The grade is set to 6 degrees and wind speed set to 10 m/s in the comparative analysis. Comparison of the results of the original and updated scenarios reveal the following in Table 1.
Table 1. Scenario comparison of HEV Reference Application with WOT drive cycle
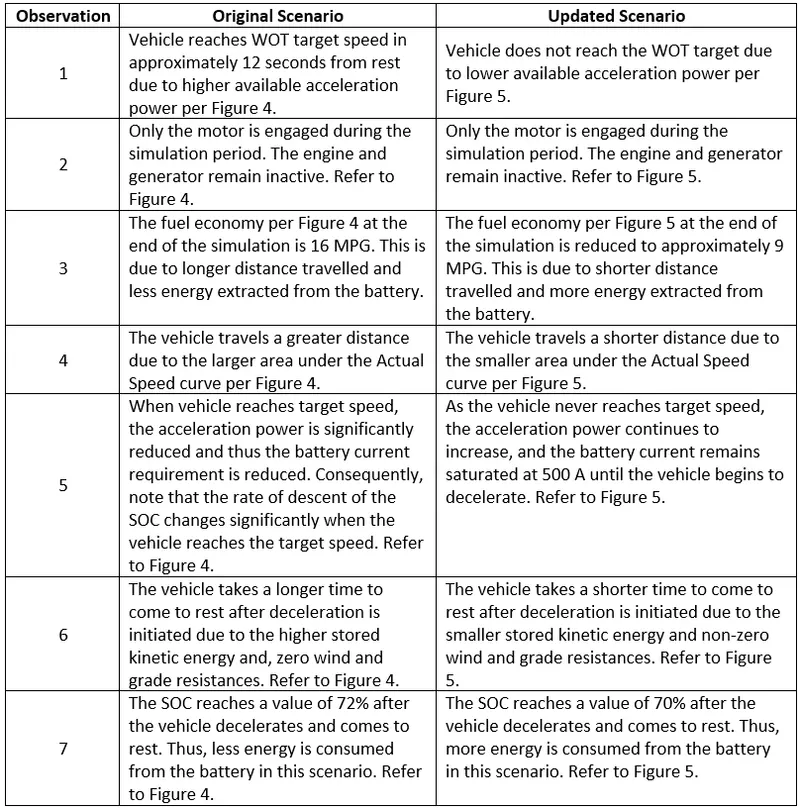
Figure 2. HEV Reference Application with WOT Drive Cycle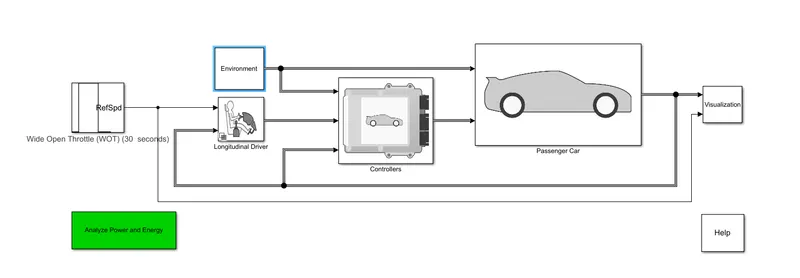
Figure 3. Powertrain Configuration of HEV Multimode Reference Application
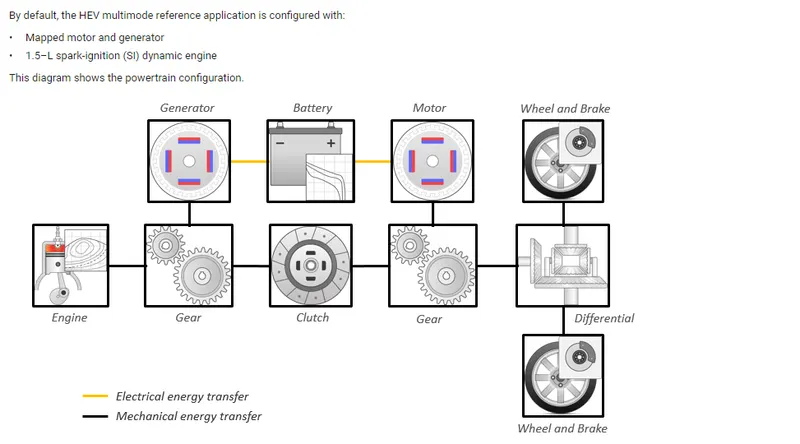
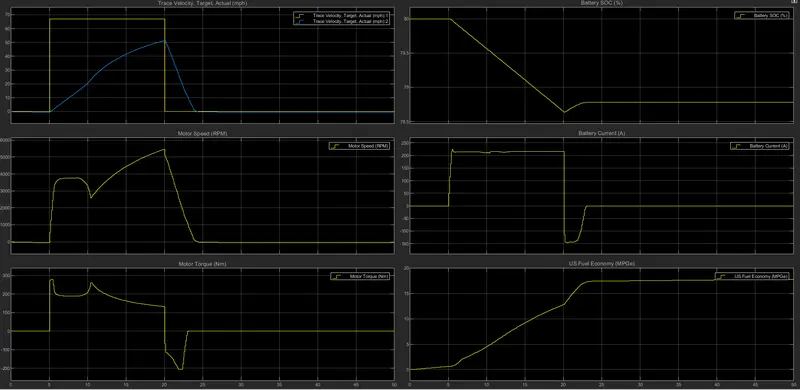
Figure 4. HEV results prior to grade and wind speed changes
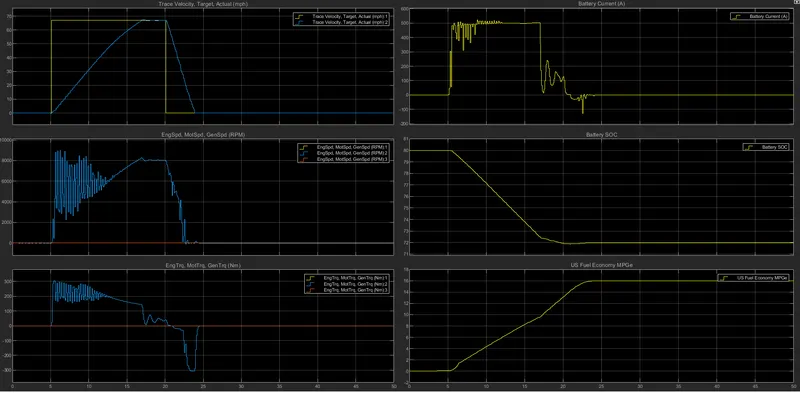
Figure 5. HEV results after grade (6 deg) and wind speed (10 m/s) changes
Ques 4.
The WOT drive cycle is applied in the top level of the Pure EV and HEV Reference Applications to assess the impact of both configurations with and without changing the speed of the headwind and the grade of the slope. The WOT Drive Cycle parameters used in the analysis are shown in Figure 6.
The Pure EV reference application has the powertrain configuration as shown in Figure 7. The simulation duration is 50 seconds.
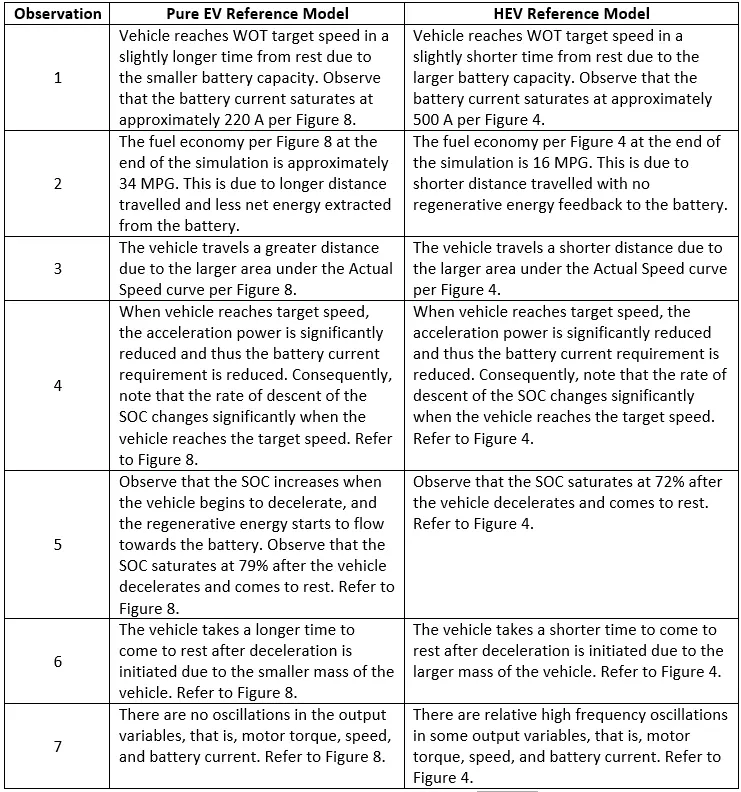
Comparison of the results of the Pure EV and HEV Reference Applications for the same WOT drive cycle reveal the following in Table 2.
Table 2. Scenario comparison of Pure EV and HEV Reference Application with same WOT drive cycle
Comparison of the results of the Pure EV and HEV Reference Applications for the same WOT drive cycle and changes in the speed of the headwind and the grade of the slope reveal the following in Table 3.
Table 3. Scenario comparison of Pure EV and HEV Reference Application with same WOT drive cycle and environment changes
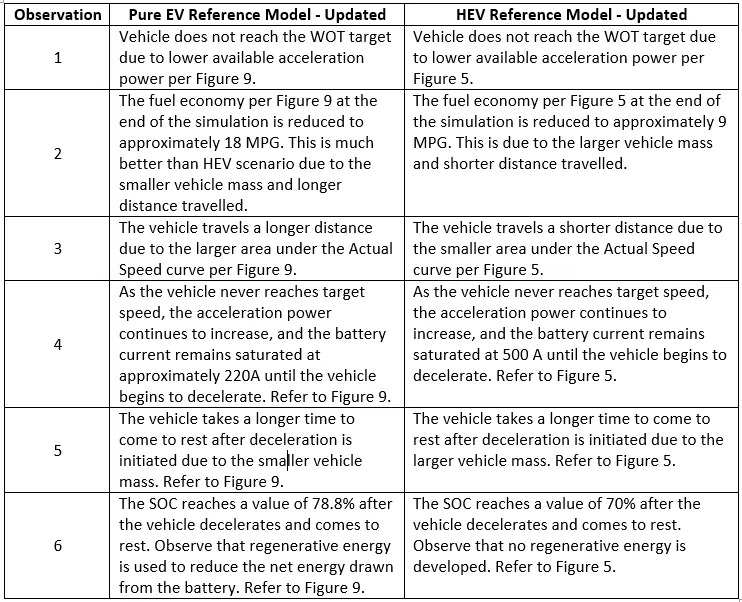
Figure 6. HEV Multimode Reference Application WOT Drive Cycle Parameters
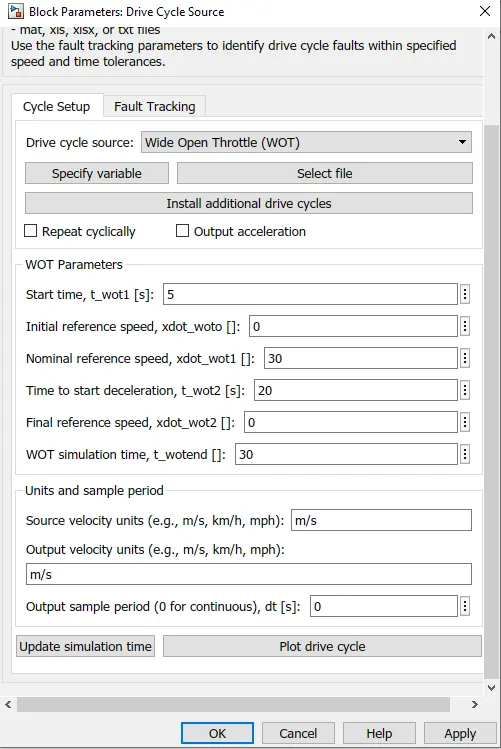
Figure 7. Powertrain Configuration of Pure EV Reference Application
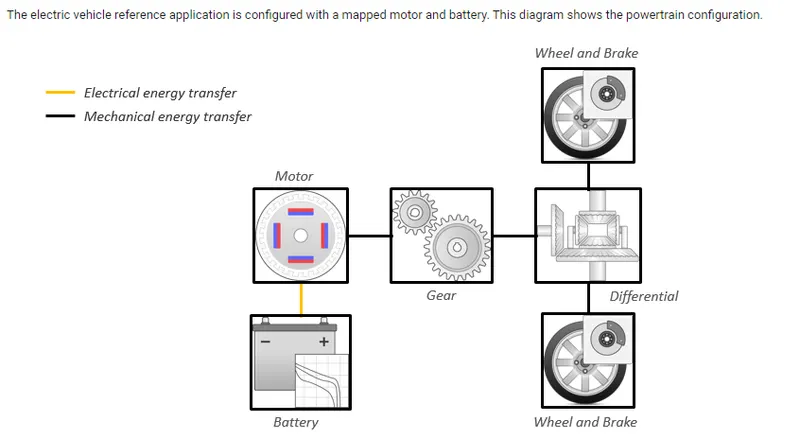
Figure 8. Pure EV results prior to grade and wind speed changes
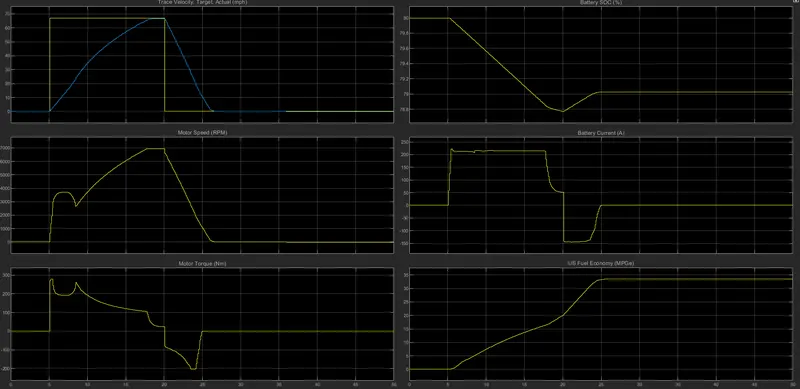
Figure 9. Pure EV results after grade (6 deg) and wind speed (10 m/s) changes