Week-4 Challenge WOT Condition Part-2
Wide Open Throttle Condition Part 2
1) What is the difference between mapped and dynamic model of engine, motor, and generator? How can you change model type?
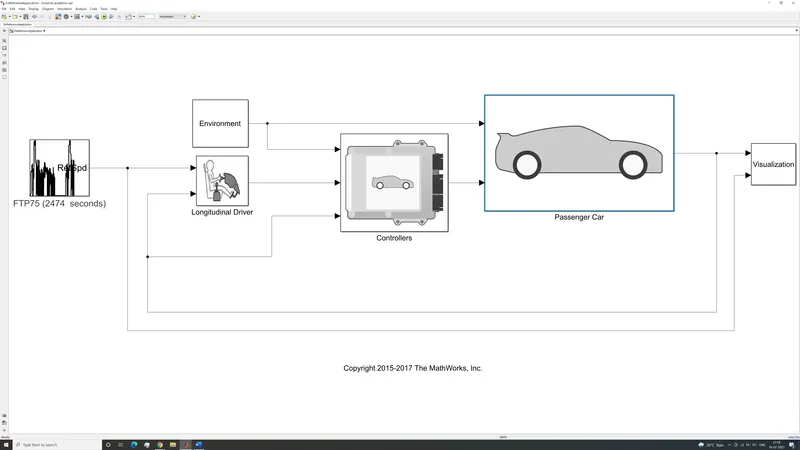
Figure 1-Electric vehicle reference application
In a backward facing model such as the EV vehicle reference application in Matlab, shown in Figure 1, the vehicle must respond to inputs imposed on it by the driver. The driver in turn must decide the torque required to adhere to the required drive cycle based on prevailing conditions such as required acceleration, gradient, difference in speed between car and reference speed etc. Once the driver determines the torque necessary under the given conditions, the torque delivered by the electric motor must be calculated and multiplied by the speed to determine power required. This is done to determine the battery power draw, battery current, motor torque and effect on battery state of charge.
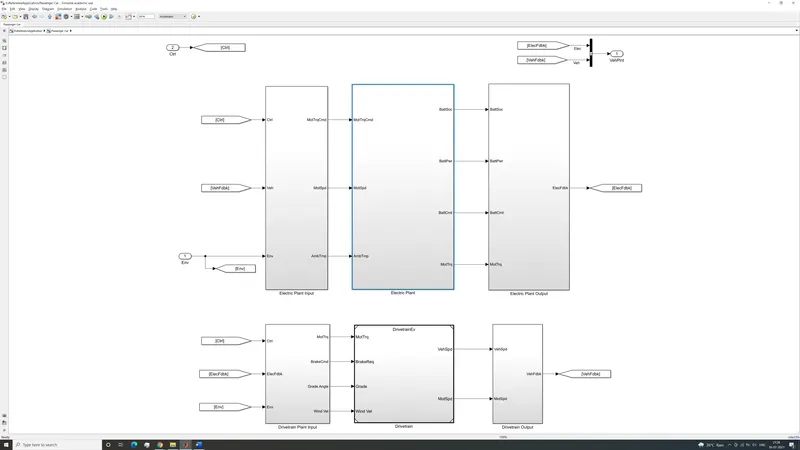
Figure 2-Input and output diagram of passenger car block
On exploring the details of the “passenger car” block in figure 1 we can see the input and output diagram of the block in figure 2. The upper block in the middle shows the names of the variables discussed earlier. On exploring this block, we can see the way the input variables are manipulated to calculate the values of the output variables in the block labelled “electric plant”.
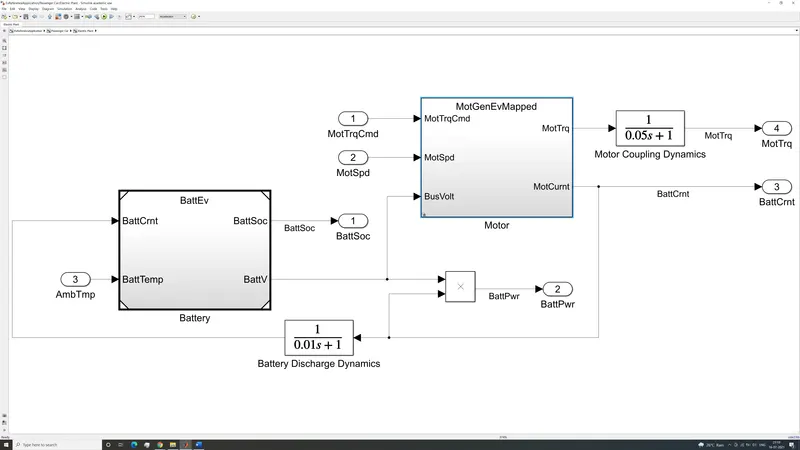
Figure 3-Flow diagram of Electric plant block
In figure 3 we can see the inputs necessary for simulating vehicle performance. To simulate overall vehicle performance, the performance of the electric motor must be simulated first. Simulation of the electric motor under given torque demand, motor speed and battery voltage, is done by the block named “motor”. Here there are two models for simulating the behavior of electric motors. These are the mapped model and dynamic model, given by “MotGenEvMapped” and “MotGen EvDynamic” respectively. The mapped model is a mapped motor with implicit controller. The dynamic model is modeled as an interior permanent magnet synchronous motor with controller. The block diagram of mapped model is shown in figure 4 and the dynamic model is shown in figure 5.
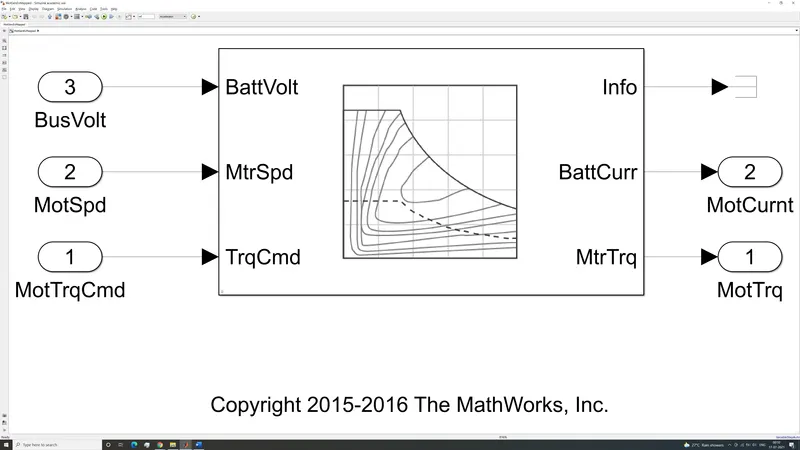
Figure 4-Motor mapped model
From figure 4 we can see that the mapped model functions as a set of steady state lookup tables to characterize motor performance. The driver can request any amount of torque at the given speed, up to the maximum torque the motor can deliver. The efficiency at that operating point is also determined in the form of a lookup table. Mapped models are useful for simulating quasi static processes in a short amount of computation time.
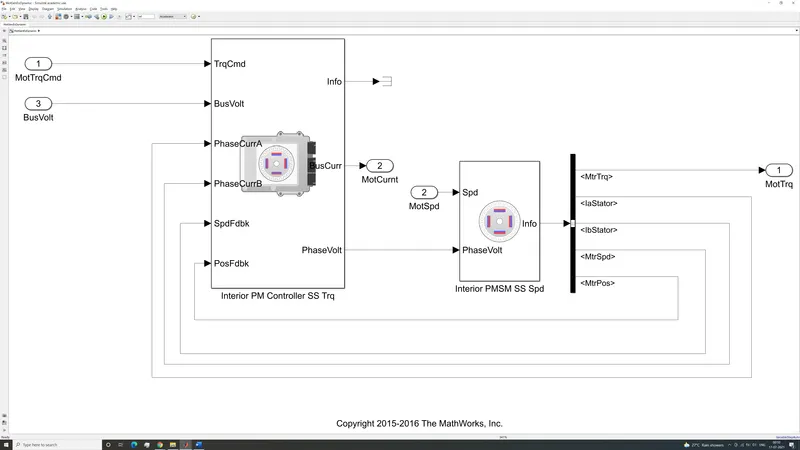
Figure 5-Dynamic model
The dynamic model shown in figure 5 is far more detailed, modeling individual components of the PMSM motor itself. Dynamic model decomposes the motor behavior into engine characteristics that are separated into lower-level components. By combining components in this way, the models capture dynamic effects. Dynamic models are useful if a detailed dynamic model with component level data is required.
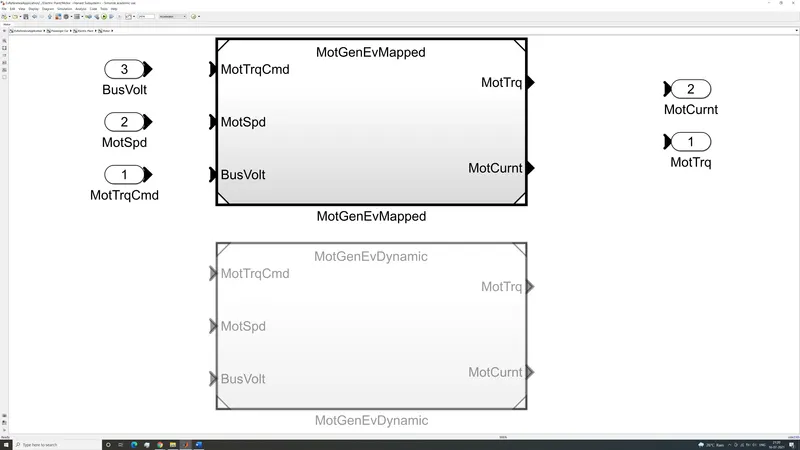
Figure 6-Choosing between Mapped and Dynamic model
Figure 6 shows how to select between mapped and dynamic model. The model selected depends on which of the two blocks are connected to the inputs and outputs as shown in the figure.
2) How does the model calculate miles per gallon? Which factors are considered to model fuel flow?
The model calculates fuel efficiency in terms of miles per gallon equivalent. One U.S. gallon of gasoline is considered to have 33.7 kilowatt hours of energy. The distance in miles, a vehicle can travel using 33.7 kilowatt hours of energy consumed is the MPGe rating of the vehicle. Just like fuel consumption, this rating also varies depending on which test cycle is being used to measure fuel efficiency. This scale is used to compare efficiency of different drivetrains, whether they consume gasoline or not. This is useful in comparing the efficiency of electric vehicles, hybrids, and internal combustion engine vehicles.
As there is no alternative source of motive power, the MPGe rating of a gasoline powered vehicle is the miles of distance covered divided by the number of gallons of fuel consumed by the engine. In hybrids however, there are two sources of energy on board, the internal combustion engine, and the battery. To get a better idea about the total energy consumed, the energy drained from the battery in kilowatt hours is equated to the equivalent energy stored per U.S. gallon of gasoline. This equivalent gasoline consumed is added to the actual gasoline consumed by the engine to calculate MPGe. An electric vehicle does not consume any gasoline at all but an MPGe rating can be calculated by equating the battery energy consumed, to the amount of energy stored per U.S. gallon of gasoline. To calculate the MPGe rating the distance covered is then divided by the equivalent number of gallons of gasoline consumed. Another factor to consider when calculating MPGe for EV’s and HEV’s is regenerative braking. Regenerative braking can charge the battery under braking by using the electric motor as a generator. This increases the average MPGe of EV’s and HEV’s as they can recuperate some of the energy consumed during acceleration. A gasoline car cannot recuperate energy under braking. Combined with their low thermal efficiency, gasoline cars have poor fuel consumption relative to EV’s and HEV’s.
3) Run the HEV ReferenceApplication with WOT drive cycle. Change the grade and wind velocity in the environment block. Comment on the results.
Hybrid vehicle is modelled in a similar manner as shown in figure 1. It is a backward facing model which uses the drive cycle to calculate torque and power required to adhere to drive cycle and calculate outputs such as fuel efficiency and state of charge.
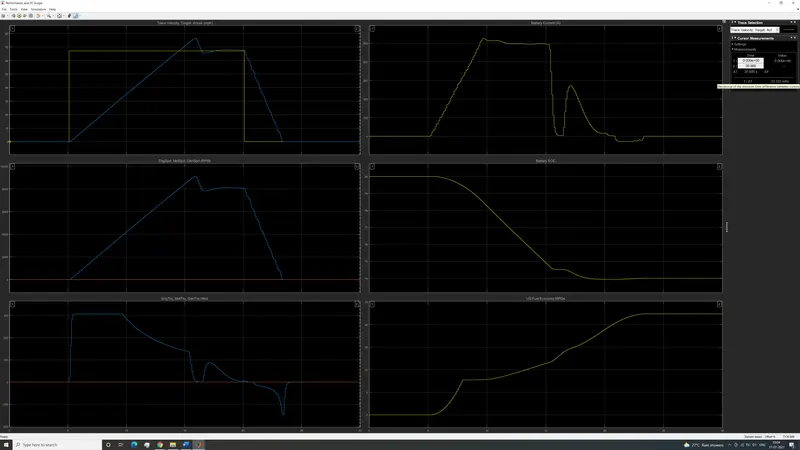
Figure 7-Performance of hybrid electric vehicle without slope
Figure 7 shows us various graphs, all of which are plotted against time on the horizontal axis. The top graph on the left depicts the vehicle velocity (blue) and target velocity (yellow), both in miles per hour. The second graph on the left depicts motor speed in revolutions per minute. The lower graph on the left tracks motor torque in newton-meter.
The top graph on the right depicts battery current in amperes. The second graph on the right depicts battery state of charge in percentage. The lower graph on the right depicts fuel economy in miles per gallon equivalent. Important events in the drive cycle are listed below.
0 seconds- Vehicle is at rest.
5 seconds- Vehicle starts accelerating from rest, to a target speed of 67.11 mph for 15 seconds. Battery starts draining from 80 percent.
14.5 seconds- Vehicle reaches and overshoots target speed and continues to accelerate.
15.2 seconds- Vehicle starts reducing battery current and thus motor torque.
15.9 seconds- Vehicle reaches maximum speed of 76.3 mph just before motor torque reaches zero.
16 seconds- Motor torque and battery current reach zero and vehicle starts decelerating back to target speed of 67.11 mph. Battery state of charge plateaus momentarily.
16.5 seconds- Vehicle drops below target speed and immediately increases engine torque and battery current to accelerate back up to target speed. Battery starts draining again.
17.5 seconds- Vehicle marginally exceeds target speed, causing engine torque demand and battery current to start reducing gently until vehicle speed reaches target speed.
20 seconds- Battery reaches minimum state of charge at 73.9%. Vehicle applies brakes by running motor in generator mode causing battery current to reverse and start charging the battery until vehicle comes to full stop at 23.3 seconds.
Vehicle achieves 22.35 MPGe at the end of run.
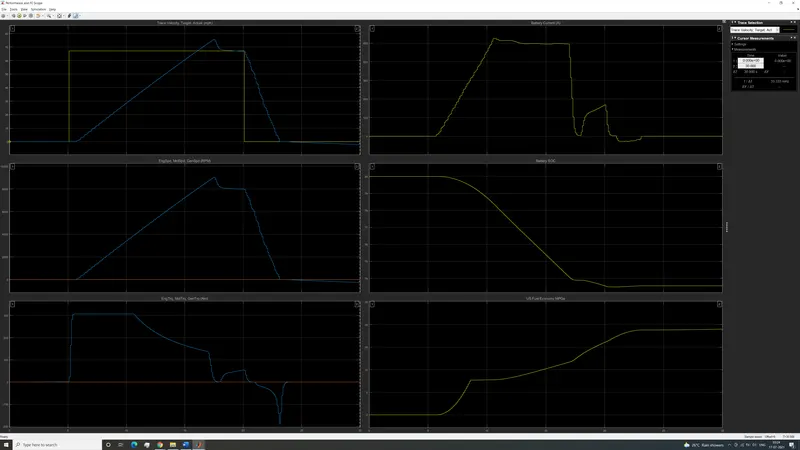
Figure 8-Performance of hybrid electric vehicle on 1 degree incline with 20 m/s head wind
Figure 8 shows the same hybrid vehicle shown in figure 7 climbing an upward slope of 1 degree inclination against a 20 meter per second head wind. The shape of the graphs are roughly the same as before, however the values are slightly different. The minimum battery state of charge achieved is 73.5% as opposed to 73.9%. The MPGe rating for the trip is also lower at 18.8 MPGe as opposed to 22.35. This is to be expected as vehicle must use more energy to overcome resistance.
4) Keeping all other parameters same, compare the simulated results of hybrid and pure electric powertrains.
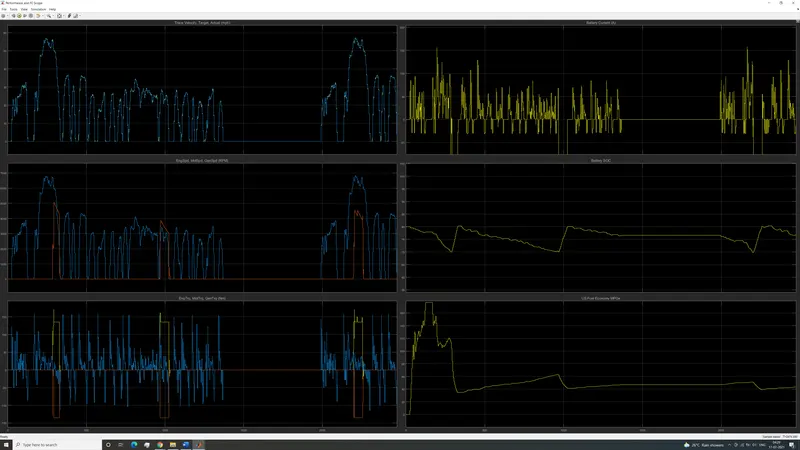
Figure 9-Hybrid electric vehicle under FTP cycle
In figure 9 we can see the results of a simulation of hybrid electric vehicle under FTP test cycle. The format of the graphs is the same as shown in figure 7 and 8. The Hybrid benefits from multiple sources of energy. From the state of charge of the battery we can see that it functions in thermostat regime. This means that the battery charge will remain between 70% and 80%. The vehicle functions as a pure electric except when the battery depletes to 70% charge. At this point the internal combustion engine starts to generate power to drive the vehicle forward as well as charge the battery through a generator. From the engine speed graph we can see that the internal combustion engine produces power 3 times throughout the test as indicated by the red line. This corresponds with the regions of sharp charging in the graph showing battery state of charge. The MPGe rating of the vehicle averages out between 40 to 60 MPGe.
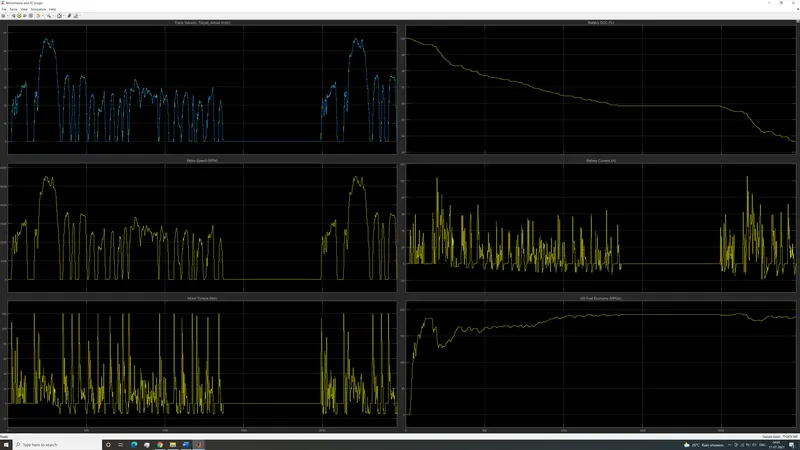
Figure 10-Electric vehicle under FTP cycle
In figure 10 we see the results of a simulation of electric vehicle under FTP test cycle. The format of the graphs is slightly different from figure 7, 8 and 9. The graphs depicting battery state of charge and battery current have swapped places. As a pure electric vehicle has no alternative means of motive power, the graph for state of charge is a generally downward, interrupted only by short periods of regenerative braking. The MPGe rating of the vehicle is much higher at over 150 MPGe. Compared to the EV the HEV gets much lower gas mileage as the internal combustion engine greatly reduces mpg during the short stints during which it provides motive power, thus lowering the average mileage.