Week-4 Challenge WOT Condition Part-2
Aim: The following challenge has 4 exercises:
- What is the difference between mapped and dynamic model of engine, motor and generator? How can you change model type?
- How does the model calculate miles per gallon? Which factors are considered to model fuel flow?
- Run the HEV Reference Application with WOT drive cycle. Change the grade and wind velocity in the environment block. Comment on the results.
- Keeping all other parameters same, compare the simulated results of hybrid and pure electric powertrains.
Solution:
- What is the difference between mapped and dynamic model of engine, motor and generator? How can you change model type?
Mapped model of engine, motor and generator:
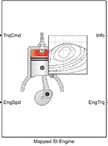
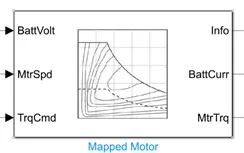
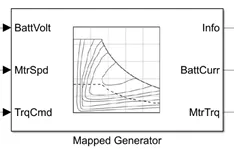
Mapped models are the models in which the values of power, torque, speed, fuel consumption, exhaust temperature, engine efficiency and emissions from the engine are provided to the model by the user. The blocks used in this model are the mapped blocks of engine, motor and generator.
Dynamic model of engine, motor and generator:
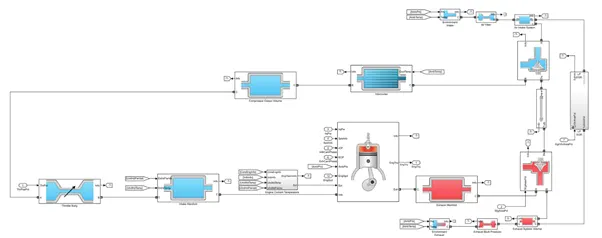
Dynamic models are the models in which the values of power, torque, speed, fuel consumption, exhaust temperature, engine efficiency and emissions from the engine are calculated using the blocks required for engine, motor and generator i.e.,
Engine:
Air filter, Throttle body, Intake manifold, SI core engine, exhaust manifold, etc.
Motor:
Interior PM Controller, Three-Phase Voltage Source Inverter, Interior PMSM, etc.
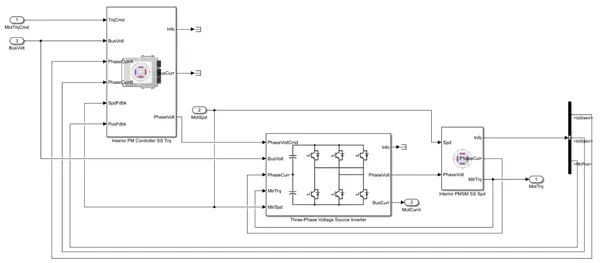
Generator:
Interior PM Controller, Three-Phase Voltage Source Inverter, Interior PMSM, etc.
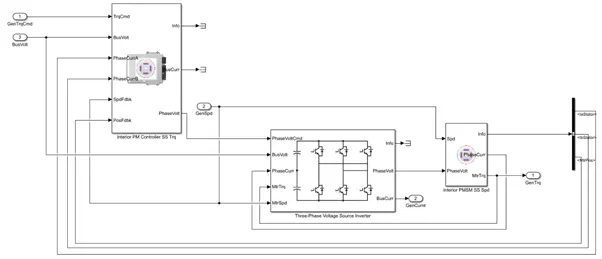
We can change the model type by following the steps below:
Right click > Variant > Label mode active choice > choose the desired model type available there.
- How does the model calculate miles per gallon? Which factors are considered to model fuel flow?
The following picture below in the model calculates the fuel flow of the vehicle:
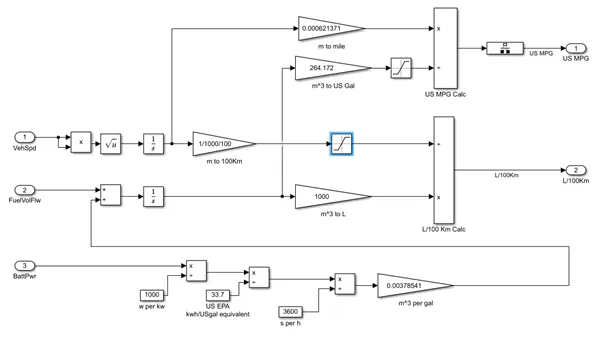
Vehicle Speed, Fuel Volume flow into engine and Battery power are the factors considered for fuel flow. Here, vehicle speed is used for the distance travelled by the vehicle in a given time and the fuel consumed by the vehicle in the give time is calculated. The Fuel volume flow is m3/s which is added with the battery power which is charged because of engine and both the parameters are added by the calculations shown in the diagram. Vehicle speed is integrated to get distance travelled by the vehicle and Fuel volume flow is integrated to get the amount of fuel consumed by the vehicle in m3.
The calculation above is to get fuel consumption in Miles per gallon and the below calculation are done to get the fuel consumption in Litres per 100 Km.
- Run the HEV Reference Application with WOT drive cycle. Change the grade and wind velocity in the environment block. Comment on the results.
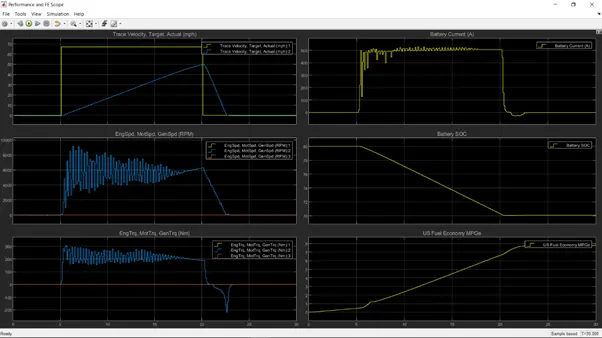
HEV Reference Application was run with WOT drive cycle for 30 seconds and the following results were achieved:
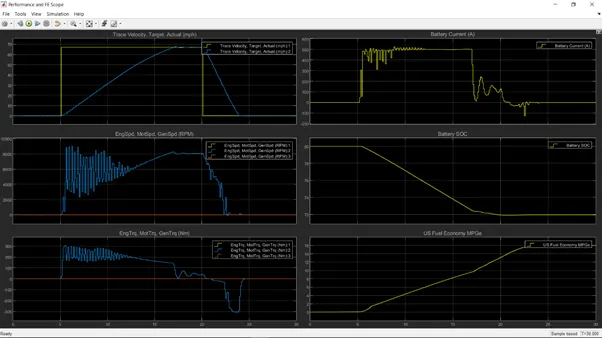
We can see that the vehicle was suddenly accelerated at 5th second and there is sudden increase in battery current and motor speed (RPM), due to the sudden increase in battery current we can see that the Battery SOC has dropped from 80% to 72% and also, we can see a sudden increase in motor RPM and motor torque. We can also see a negative motor torque region in the plot because of the sudden deceleration of the vehicle at 20th second. As the motor is being used and no engine is required in this case, we can see that the Fuel Economy is increased to 16 Miles per Gallon.
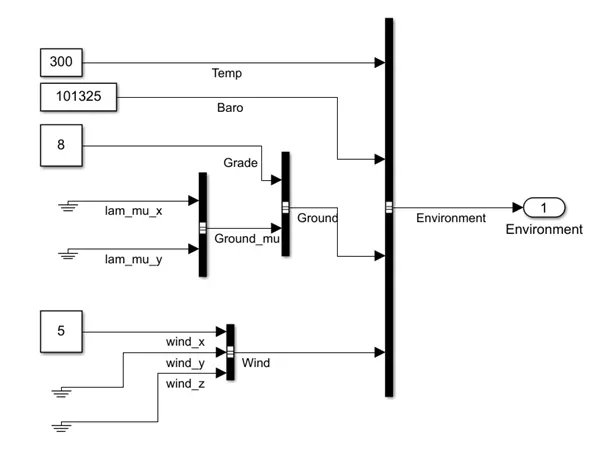
Grade was changed to 8% and wind velocity was changed to 5 m/s.
The following results were achieved:
Due to grade and wind velocity, we can see that the vehicle could not achieve the desired velocity in the give time before deceleration. The plots for battery current, speed RPM and torque are almost the same, but the negative torque region in the torque plot is less compared to the previous case because the vehicle did not achieve the desired speed and less force was required to the stop the vehicle. In this case, we can see that the Battery SOC has gone to 70% which was 72% in the previous case, which is because of the higher power required to overcome the resistance forces caused due to grade and wind velocity. Fuel economy is also lower compared to the previous one as the engine was not used and the motor could not achieve the desired speed.
- Keeping all other parameters same, compare the simulated results of hybrid and pure electric powertrains.
Plots of Hybrid and Pure Electric:
Hybrid:
Pure Electric:
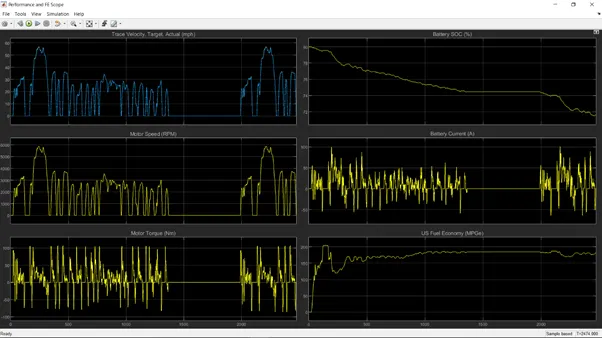
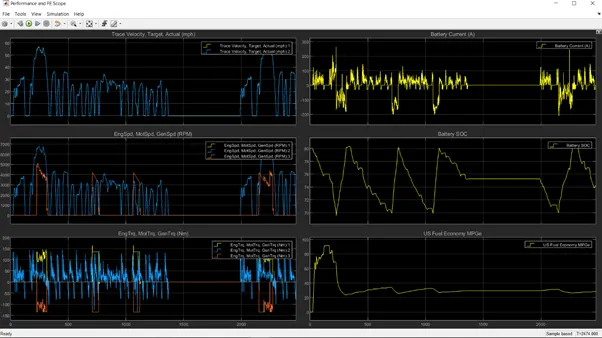
Drive cycle used in both the cases is FTP 75 drive cycle which was run for 2474 seconds. The RPM plots in both cases are almost the same.
The values of torque plot in Pure electric vehicle are lower compared to the values of torque plot in hybrid vehicle because of the higher amount of torque values required in pure electric vehicle as there is only motor in it whereas on the other hand, there is motor, engine and generator to provide the required torque to the hybrid vehicle. Also, the weight of hybrid vehicle is higher compared to pure electric because of more components in hybrid vehicle like engine and generator.
The values of battery current plot in hybrid vehicle are higher compared to pure electric because of battery current requirement for motor, engine and generator in hybrid vehicle whereas in pure electric, battery current is required for motor. Because of higher battery current requirement in hybrid vehicle, the battery SOC depletes faster in hybrid vehicle compared to pure electric vehicle, the battery is charged because of engine in hybrid vehicles.
The fuel economy plots cannot be compared for both the cases as fuel for both vehicles are different as one runs on petrol or diesel while the other runs on electricity. The calculations of fuel economy for pure electric vehicle is given in the image below:
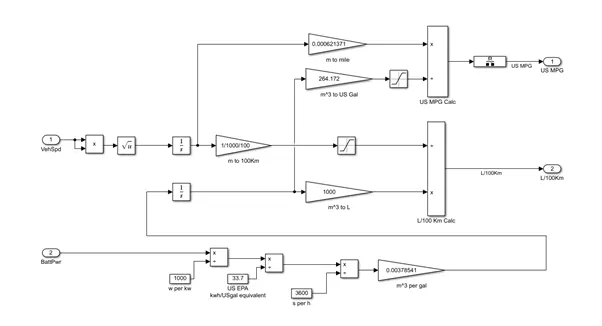
We can see that the calculation for fuel economy for both the cases are almost the same, but in this one only battery power is used, so the power is converted into litres shown in the calculations in the above diagram.