Project 1 - Parsing NASA thermodynamic data
Aim: To create a program that extract 14 co-efficients and calculates the enthalpy, entropy and specific heats for all the species in the data file.
Objectives of the Program:
To extract the coefficients and temperture ranges from THERMO.dat file by taking this file as an input and calculate the specific heat, enthalpy and entropy for local low and high temperature ranges and sholud also plot graphs w.r.t. it, it should also calculate the Molecular Masses of every species in the file
Program:
clear all
close all
clc
%To open file THERMO.dat
a = fopen('THERMO.dat');

%To read all the 218 lines(53 species) in thermo file by using for loop
for i = 1:218
    %To read the lines
tline = fgetl(a);

%To extract the coefficients from thermo file
%There are total 3 line of coefficients
%for extracting first line of coefficients of every species, I have used if
%loop by using variable m which indicates every first line of coefficients
%of every species
%Extracting coefficients for low temp range a1-a5
m = linspace(1,209,53);
for j = 1:53
if i == 6+m(j)
    aa = findstr(tline,'E');
a11 = tline(1:aa(1)+3);
a1(j) = str2num(a11);
a22 = tline(aa(1)+4:aa(2)+3);
a2(j) = str2num(a22);
a33 = tline(aa(2)+4:aa(3)+3);
a3(j) = str2num(a33);
a44 = tline(aa(3)+4:aa(4)+3);
a4(j) = str2num(a44);
a55 = tline(aa(4)+4:aa(5)+3);
a5(j) = str2num(a55);
end
end

%for extracting second line of coefficients of every species, I have used if
%loop by using variable n which indicates every second line of coefficients
%of every species
%Extracting coefficients for low temp range a6 and a7 for high temp range
%A1-A3
n = linspace(2,210,53);
for j = 1:53
if i == 6+n(j)
    aa = findstr(tline,'E');
a66 = tline(1:aa(1)+3);
a6(j) = str2num(a66);
a77 = tline(aa(1)+4:aa(2)+3);
a7(j) = str2num(a77);
A11 = tline(aa(2)+4:aa(3)+3);
A1(j) = str2num(A11);
A22 = tline(aa(3)+4:aa(4)+3);
A2(j) = str2num(A22);
A33 = tline(aa(4)+4:aa(5)+3);
A3(j) = str2num(A33);
end
end

%for extracting third line of coefficients of every species, I have used if
%loop by using variable o which indicates every third line of coefficients
%of every species
%Extracting coefficients for high temp range A4-A7
o = linspace(3,211,53);
for j = 1:53
if i == 6+o(j)
    aa = findstr(tline,'E');
A44 = tline(1:aa(1)+3);
A4(j) = str2num(A44);
A55 = tline(aa(1)+4:aa(2)+3);
A5(j) = str2num(A55);
A66 = tline(aa(2)+4:aa(3)+3);
A6(j) = str2num(A66);
A77 = tline(aa(3)+4:aa(4)+3);
A7(j) = str2num(A77);
end
end

%To extract minimum,middle and maximum local temperature ranges for every
%species
%for extracting temperature ranges of every species, I have used if
%loop by using variable p which indicates every line of local temperature
%ranges of every species
p = linspace(0,208,53);
for j = 1:53
if i == 6+p(j)
   Ltmin = tline(49:55);
local_temperature_min(j) = str2num(Ltmin);
Ltmax = tline(58:65);
local_temperature_max(j) = str2num(Ltmax);
Ltmid = tline(68:75);
local_temperature_mid(j) = str2num(Ltmid);
end
end

%Program for calculating Molecular Masses of every 53 species
%For this I have created variable M1,M2,M3,M4,M5,M6 and has used if and
%else if loop for this purpose
%Variable element is created to identify content in the string
%If string is identified as 'O','C','N','H' or 'S' then 16,12,14,1 or 32
%will be passed to the variables M1,M2,M3,M4,M5,M6
%If the string is recognized as a number then the previous variable will
%be multiplied by the number
q = linspace(0,208,53);
for k = 1:53
if i == 6+q(k)
element = tline(1);
if element == 'O'
    M1(k) = 16;
else if element == 'C'
    M1(k) = 12;
else if element == 'N'
    M1(k) = 14;
else if element == 'A'
    M1(k) = 20;
else if element == 'H'
    M1(k) = 1;
    end
    end
    end
    end
end
    element = tline(2);
if element == 'O'
    M2(k) = 16;
else if element == 'C'
    M2(k) = 12;
else if element == 'N'
    M2(k) = 14;
else if element == 'R'
    M2(k) = 20;
else if element == 'H'
    M2(k) = 1;
    else if element == '2'
    M1(k) = M1(k).*2;
    M2(k) = 0;
    else if element == '3'
    M1(k) = M1(k).*3;
    M2(k) = 0;
     else if element == ' '
    M2(k) = 0;
         end
    end
    end
    end
    end
    end
    end
end
  element = tline(3);
if element == 'O'
    M3(k) = 16;
else if element == 'C'
    M3(k) = 12;
else if element == 'N'
    M3(k) = 14;
else if element == 'R'
    M3(k) = 20;
else if element == 'H'
    M3(k) = 1;
    else if element == '2'
    M2(k) = M2(k).*2;
    M3(k) = 0;
    else if element == '3'
    M2(k) = M2(k).*3;
    M3(k) = 0;
    else if element == '4'
    M2(k) = M2(k).*4;
    M3(k) = 0;
     else if element == ' '
    M3(k) = 0;
         end
    end
    end
    end
    end
    end
    end
end
end
 element = tline(4);
if element == 'O'
    M4(k) = 16;
else if element == 'C'
    M4(k) = 12;
else if element == 'N'
    M4(k) = 14;
else if element == 'R'
    M4(k) = 20;
else if element == 'H'
    M4(k) = 1;
    else if element == '2'
    M3(k) = M3(k).*2;
    M4(k) = 0;
    else if element == '3'
    M3(k) = M3(k).*3;
    M4(k) = 0;
    else if element == '4'
    M3(k) = M3(k).*4;
    M4(k) = 0;
    else if element == '5'
    M3(k) = M3(k).*5;
    M4(k) = 0;
    else if element == '6'
    M3(k) = M3(k).*6;
    M4(k) = 0;
    else if element == '7'
    M3(k) = M3(k).*7;
    M4(k) = 0;
    else if element == '8'
    M3(k) = M3(k).*8;
    M4(k) = 0;
     else if element == ' '
    M4(k) = 0;
      else if element == '('
                 M4(j) = 0;
             end
         end
        end
        end
        end
         end
    end
    end
    end
    end
    end
    end
end
end
element = tline(5);
if element == 'O'
    M5(k) = 16;
else if element == 'C'
    M5(k) = 12;
else if element == 'N'
    M5(k) = 14;
else if element == 'R'
    M5(k) = 20;
else if element == 'H'
    M5(k) = 1;
    else if element == 'S'
    M5(k) = 32;
    else if element == '2'
    M4(k) = M4(k).*2;
    M5(k) = 0;
    else if element == '3'
    M4(k) = M4(k).*3;
    M5(k) = 0;
    else if element == '4'
    M4(k) = M4(k).*4;
    M5(k) = 0;
     else if element == ' '
    M5(k) = 0;
         end
        end
    end
    end
    end
    end
    end
    end
end
end
element = tline(6);
if element == 'O'
    M6(k) = 16;
else if element == 'C'
    M6(k) = 12;
else if element == 'N'
    M6(k) = 14;
else if element == 'R'
    M6(k) = 20;
else if element == 'H'
    M6(k) = 1;
    else if element == 'S'
    M6(k) = 32;
    else if element == '2'
    M5(k) = M5(k).*2;
    M6(k) = 0;
    else if element == '3'
    M5(k) = M5(k).*3;
    M6(k) = 0;
    else if element == '4'
    M5(k) = M5(k).*4;
    M6(k) = 0;
     else if element == ' '
    M6(k) = 0;
     else if element == ')'
                 M6(k) = 0;
             end
         end
        end
    end
    end
    end
    end
    end
    end
end
end
%The variables are added to get the final Molecular Mass of evry species
Molecular_weight(k) = M1(k) + M2(k) + M3(k) + M4(k) + M5(k) + M6(k)
end
 end
end

%Calling function for every process
SH_low = Specific_Heat(local_temperature_min, local_temperature_mid,a1,a2,a3,a4,a5);
SH_high = Specific_Heat_High(local_temperature_mid, local_temperature_max,A1,A2,A3,A4,A5);
H_low = Enthalpy_low(local_temperature_min, local_temperature_mid,a1,a2,a3,a4,a5,a6);
H_high = Enthalpy_high(local_temperature_mid, local_temperature_max,A1,A2,A3,A4,A5,A6);
S_low = Entropy_low(local_temperature_min, local_temperature_mid,a1,a2,a3,a4,a5,a7);
S_high = Entropy_high(local_temperature_mid,local_temperature_max,A1,A2,A3,A4,A5,A7);

%plotting
b = fopen('THERMO.dat');
%the i for loop and if loop has been used to give the legend name of the
%plot by using the similar logic used for extracting coefficients
for i = 1:218
 tline2 = fgetl(b);
 h = linspace(0,208,53);
 %The c for loop is used also for legend and also for temperature ranges
 %for ploting
 for c = 1:53
 if i == 6 + h(c)
     line = tline2(1:7);
     %for local temperature range low
    temp1 = local_temperature_min(c):local_temperature_mid(c);
    %for local temperature range high
    temp2 = local_temperature_mid(c):local_temperature_max(c);

%Plotting Specific Heat for local low temperature ranges
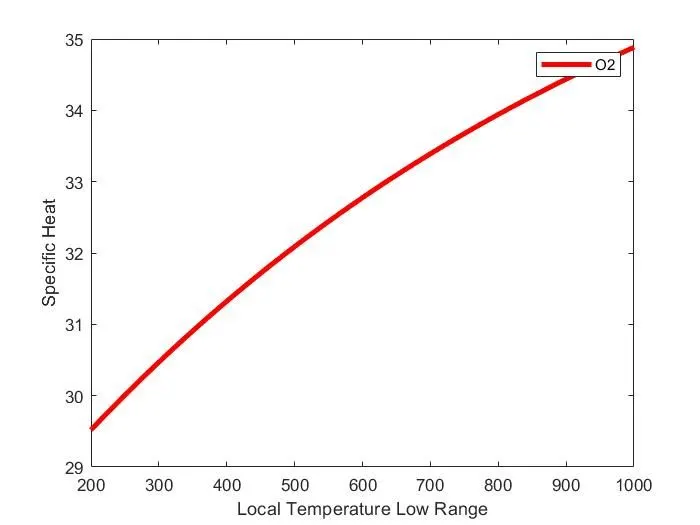
figure(c)
plot(temp1,SH_low(1:length(temp1),c),'linewidth',3,'color','r')
ylabel('Specific Heat')
xlabel('Local Temperature Low Range')
legend(line)

%Plotting Specific Heat for local high temperature ranges
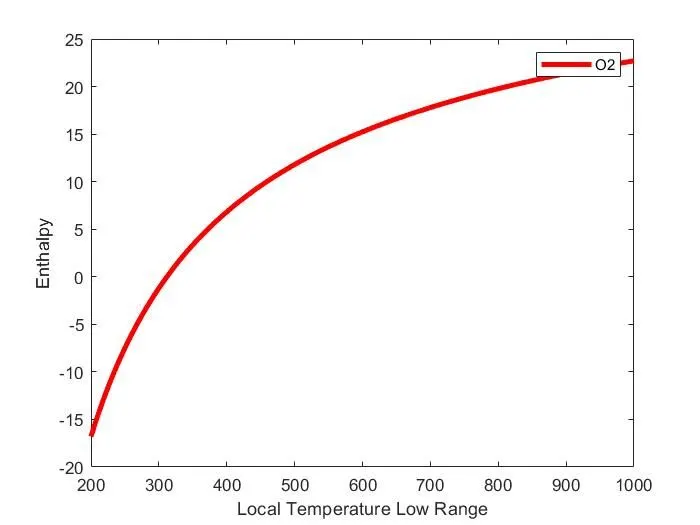
figure(53+c)
plot(temp1,H_low(1:length(temp1),c),'linewidth',3,'color','r')
ylabel('Enthalpy')
xlabel('Local Temperature Low Range')
legend(line)

%Plotting Enthalpy for local low temperature ranges
figure(106+c)
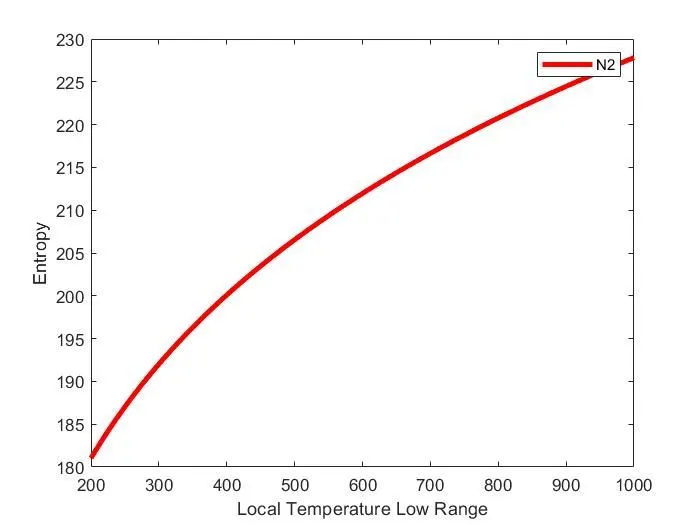
plot(temp1,S_low(1:length(temp1),c),'linewidth',3,'color','r')
ylabel('Entropy')
xlabel('Local Temperature Low Range')
legend(line)

%Plotting Enthalpy for local high temperature ranges
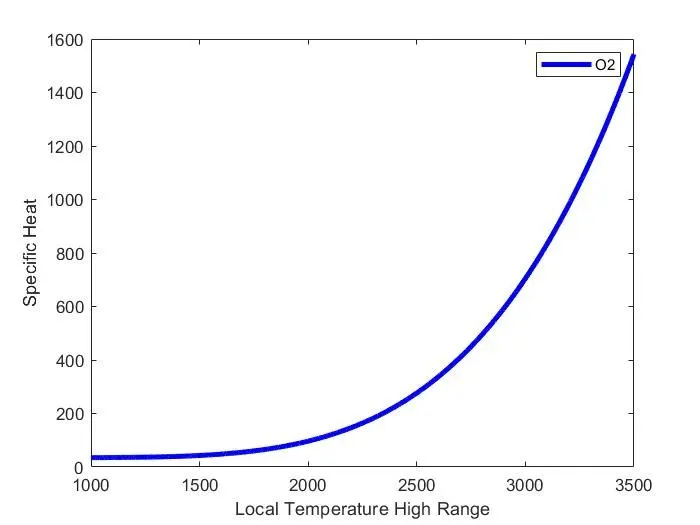
figure(159+c)
plot(temp2,SH_high(1:length(temp2),c),'linewidth',3,'color','b')
ylabel('Specific Heat')
xlabel('Local Temperature High Range')
legend(line)

%Plotting Entropy for local low temperature ranges
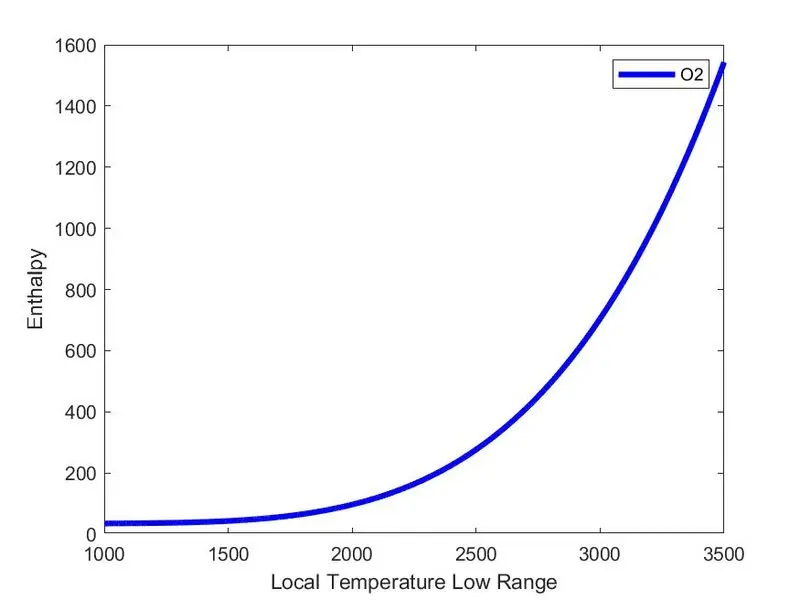
figure(212+c)
plot(temp2,H_high(1:length(temp2),c),'linewidth',3,'color','b')
ylabel('Enthalpy')
xlabel('Local Temperature High Range')
legend(line)

%Plotting Entropy for local high temperature ranges
figure(265+c)
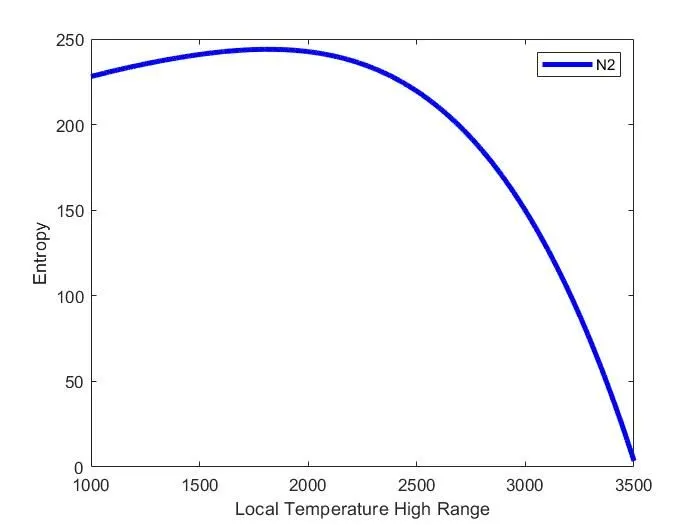
plot(temp2,S_high(1:length(temp2),c),'linewidth',3,'color','b')
ylabel('Entropy')
xlabel('Local Temperature High Range')
legend(line)

 end
 end
end
Program to calculate Specific Heat for local low temperature ranges:
%Program for calculating Specific Heat for local low temperature ranges
function [CP] = Specific_Heat(local_temperature_min, local_temperature_mid,a1,a2,a3,a4,a5)
R = 8.3145;%universal gas constant
for y = 1:53%using y for loop for temperature range
temp1 = local_temperature_min(y):local_temperature_mid(y);
%using z and x for loop for placing values of specific heat for every
%temperature values between the temperature range for every species
for z =  1:length(temp1)
    for x = 1:53
     cp1(z,x) = a1(x) + a2(x).*temp1(z) + a3(x).*temp1(z).^2 + a4(x).*temp1(z).^3 + a5(x).*temp1(z).^4;
     cp = R.*cp1;
end
[CP] = [cp];
end
end
end
Program to calculate Specific Heat for local high temperature ranges:
%Program for calculating Specific Heat for local high temperature ranges
function [CP] = Specific_Heat_High(local_temperature_mid, local_temperature_max,A1,A2,A3,A4,A5)
R = 8.3145;
for y = 1:53
temp1 = local_temperature_mid(y):local_temperature_max(y);
for z =  1:length(local_temperature_mid(y):local_temperature_max(y))
for x = 1:53
     cp1(z,x) = A1(x) + A2(x).*temp1(z) + A3(x).*temp1(z).^2 + A4(x).*temp1(z).^3 + A5(x).*temp1(z).^4;
     cp = R.*cp1;
end
[CP] = [cp];
end
end
end
Program to calculate Enthalpy for local low temperature ranges:
%Program for calculating Enthalpy for local low temperature ranges
function [CP] = Enthalpy_low(local_temperature_min, local_temperature_mid,a1,a2,a3,a4,a5,a6)
R = 8.3145;
for y = 1:53
temp1 = local_temperature_min(y):local_temperature_mid(y);
for z =  1:length(temp1)
    for x = 1:53
cp1(z,x) = a1(x) + a2(x).*temp1(z)./2 + (a3(x).*temp1(z).^2)./3 + (a4(x).*temp1(z).^3)/4 + (a5(x).*temp1(z).^4)/5 + a6(x)./temp1(z);
cp = R.*cp1;
end
[CP] = [cp];
end
end
end
Program to calculate Enthalpy for local high temperature ranges:
%Program for calculating Enthalpy for local high temperature ranges
function [CP] = Enthalpy_high(local_temperature_mid, local_temperature_max,A1,A2,A3,A4,A5,A6)
R = 8.3145;
for y = 1:53
temp1 = local_temperature_mid(y):local_temperature_max(y);
for z =  1:length(local_temperature_mid(y):local_temperature_max(y))
for x = 1:53
     cp1(z,x) = A1(x) + A2(x).*temp1(2)./2 + (A3(x).*temp1(z).^2)./3 + (A4(x).*temp1(z).^3)/4 + (A5(x).*temp1(z).^4)/5 + A6(x)./temp1(z);
     cp = R.*cp1;
end
[CP] = [cp];
end
end
end
Program to calculate Entropy for local low temperature ranges:
%Program for calculating Entropy for local low temperature ranges
function [CP] = Entropy_low(local_temperature_min, local_temperature_mid,a1,a2,a3,a4,a5,a7)
R = 8.3145;
for y = 1:53
temp1 = local_temperature_min(y):local_temperature_mid(y);
for z =  1:length(temp1)
    for x = 1:53
     cp1(z,x) = a1(x).*log(temp1(z)) + a2(x).*temp1(z) + (a3(x).*temp1(z).^2)./2 + (a4(x).*temp1(2).^3)/3 + (a5(x).*temp1(z).^4)/4 + a7(x);
     cp = R.*cp1;
end
[CP] = [cp];
end
end
end
Program to calculate Entropy for local high temperature ranges:
%Program for calculating Entropy for local high temperature ranges
function [CP] = Entropy_high(local_temperature_mid, local_temperature_max,A1,A2,A3,A4,A5,A7)
R = 8.3145;
for y = 1:53
temp1 = local_temperature_mid(y):local_temperature_max(y);
for z =  1:length(local_temperature_mid(y):local_temperature_max(y))
for x = 1:53
     cp1(z,x) = A1(x).*log(temp1(z)) + A2(x).*temp1(z) + (A3(x).*temp1(z).^2)./2 + (A4(x).*temp1(z).^3)/3 + (A5(x).*temp1(z).^4)/4 + A7(x);
     cp = R.*cp1;
end
[CP] = [cp];
end
end
end
Plots for O2:
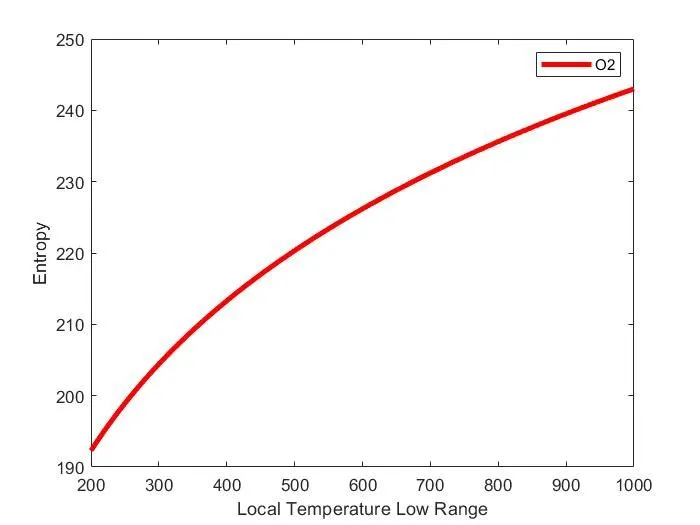
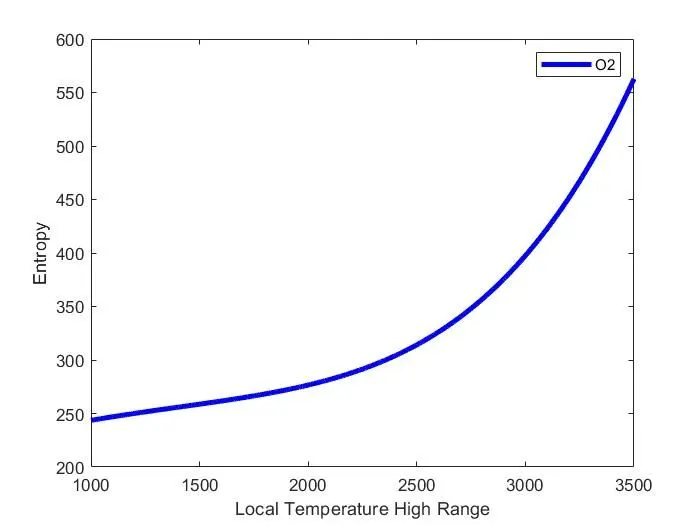
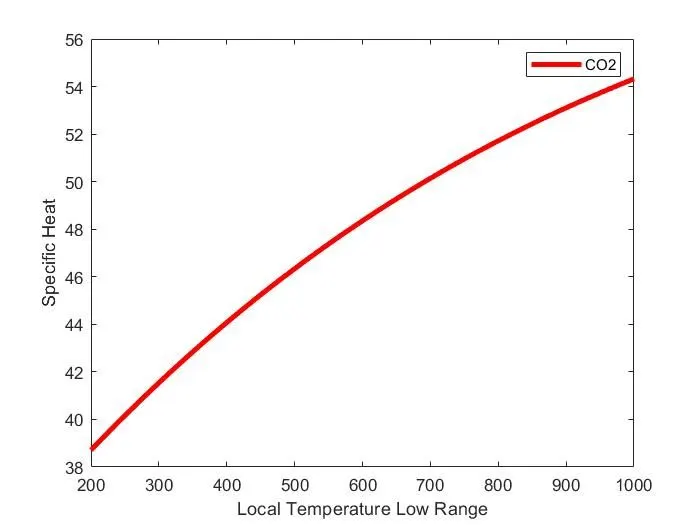
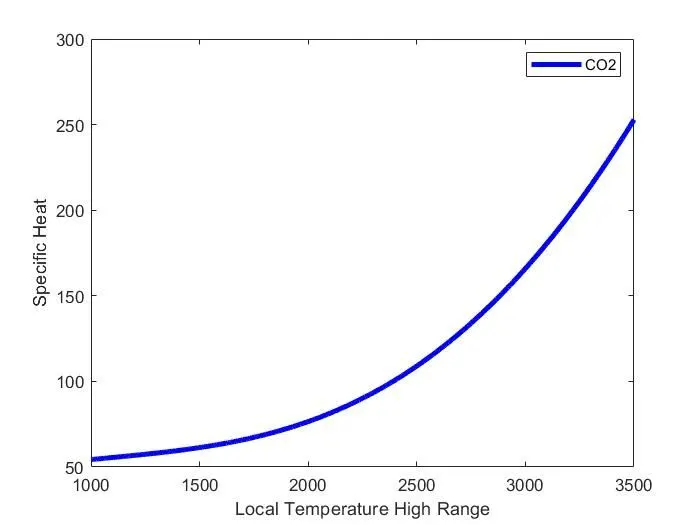
Plots for CO2:
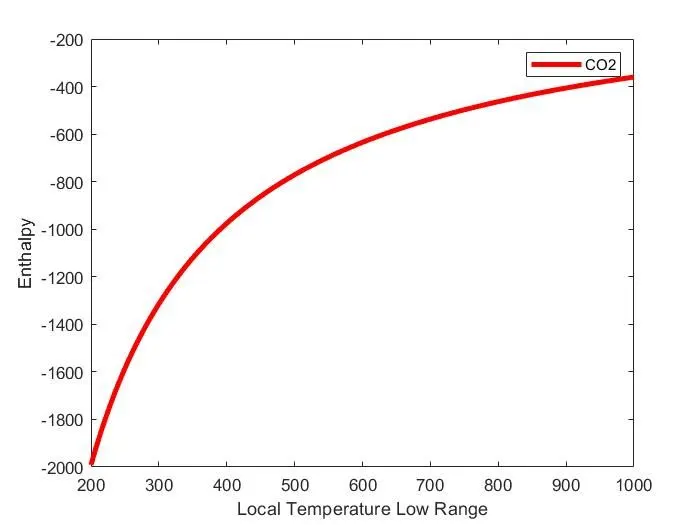
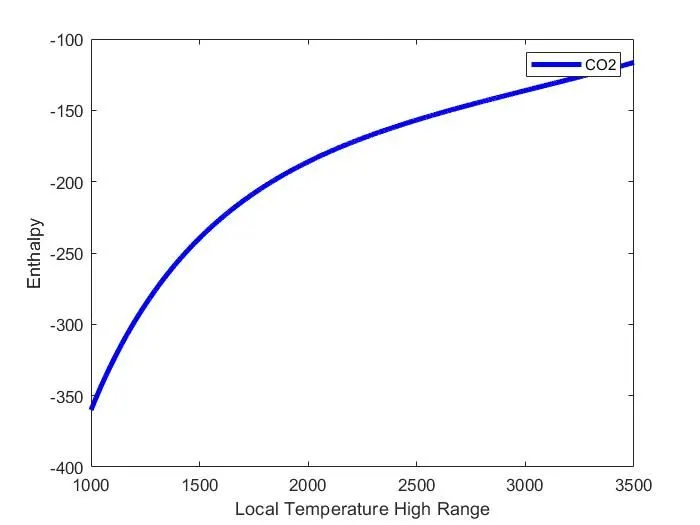
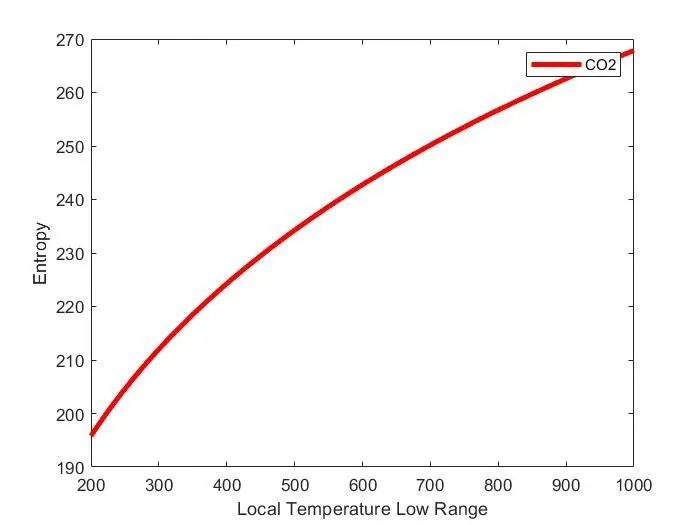
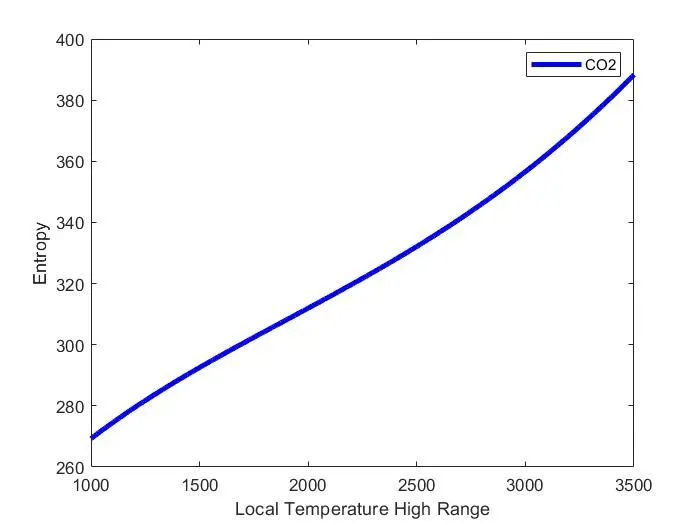
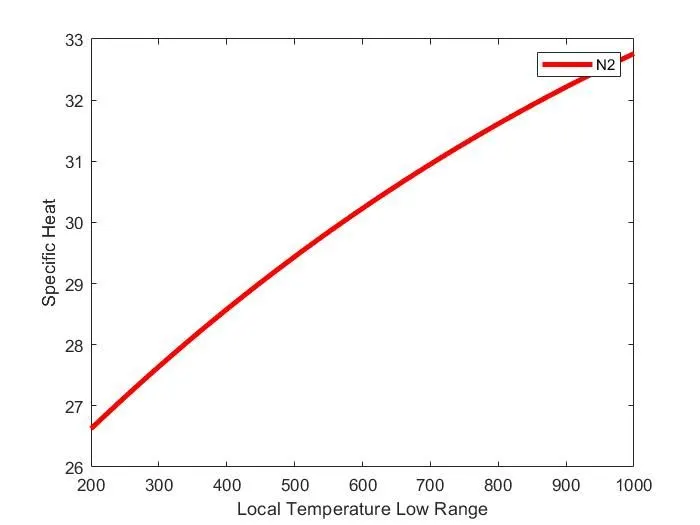
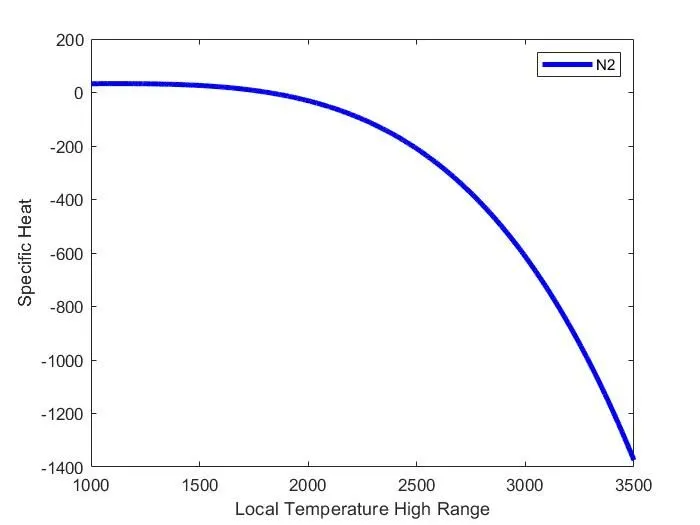
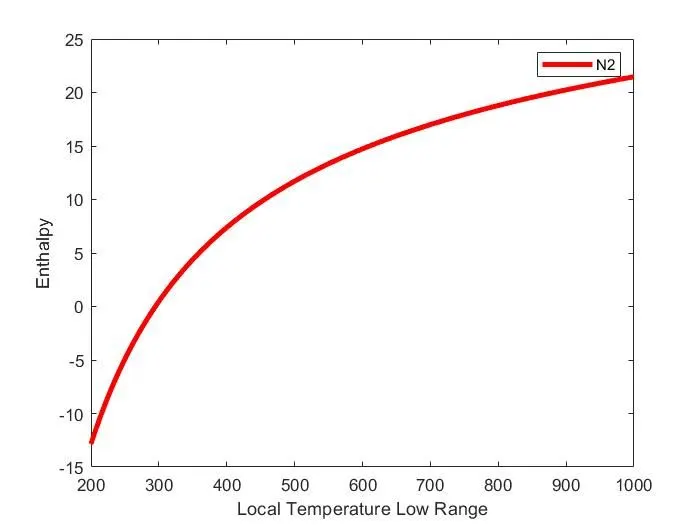
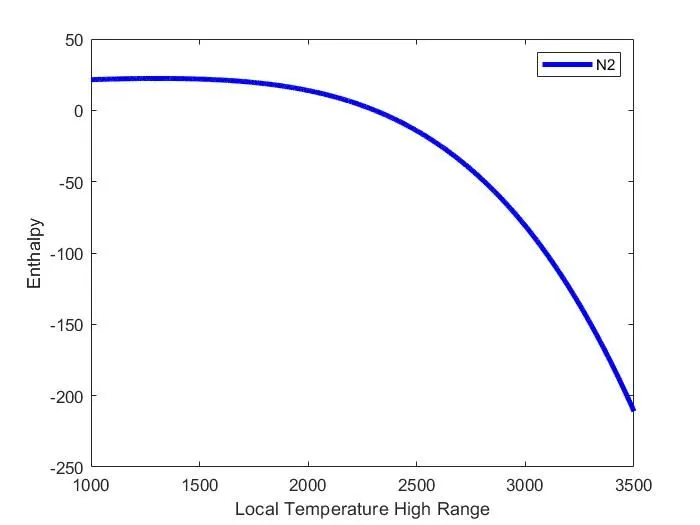
Plots for N2:
Molecular Masses of Species:
Molecular_weight =

  Columns 1 through 17

    16    32     1     2    17    18    33    34    12    13    14    46    15    16    28    44    29

  Columns 18 through 34

    30    31    31    32    25    26    27    28    29    30    42    41    42    28    27    31    14

  Columns 35 through 51

    29    44    15    16    17    30    46    43    43    43    42    26    41    28    40    44    43

  Columns 52 through 53

    44    43