Week-4 Challenge WOT Condition Part-2
1) Difference between Mapped model and Dynamic model
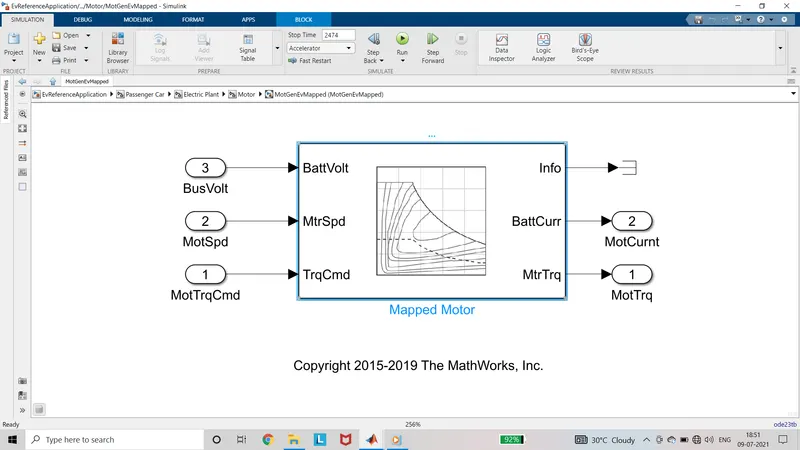
Mapped model:
- Mapped model of engine is used for the steady state analysis.
- In this model all the pre-performed data are collected and feed as input.
- It is used for steady state performance of the system.
- It is mainly performed to calculate speed torque characteristics.
- The table provides the vital information for calculations such as actual torque, fuel flow rate and emissions.
- It is also used for quasi-steady state.
Dynamic model:
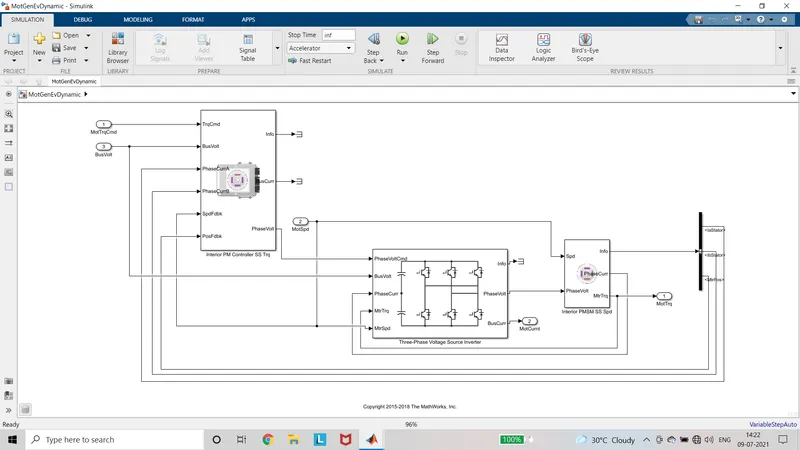
- Dynamic model breaks the engine behaviour to the engine characteristics like the subsystems in the main system.
- It analyse the characteristics of the low level components.
- In this model the output values are feedback to input get the instantaneous value.
- This gives the detailed report of each component.
- It is used to calculate how the performance of engine is affected by the small components.
Changing of mapped model to dynamic model:
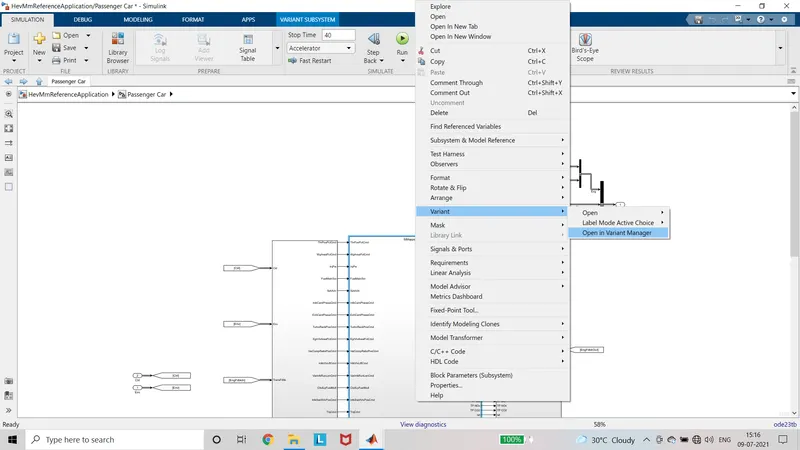
For example, the mapped engine in the passenger car block of HEV powertrain block set is changed to dynamic model by right click and select the variant. In the label mode of active choice, select engine dynamic model. Hence dynamic model of engine is activated.
Result:
If we have to design a vehicle it is more important to use the both mapped and dynamic model to calculate the steady state, quasi-steady state and instantaneous values.
2) Calculation of miles per gallon of fuel:
Objective:
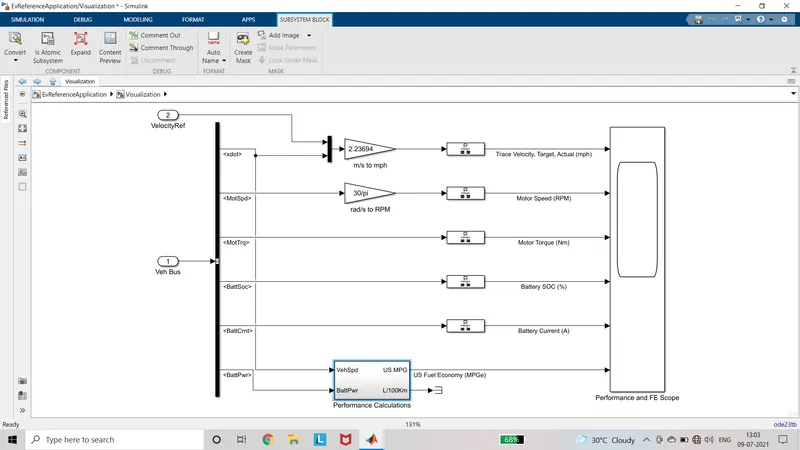
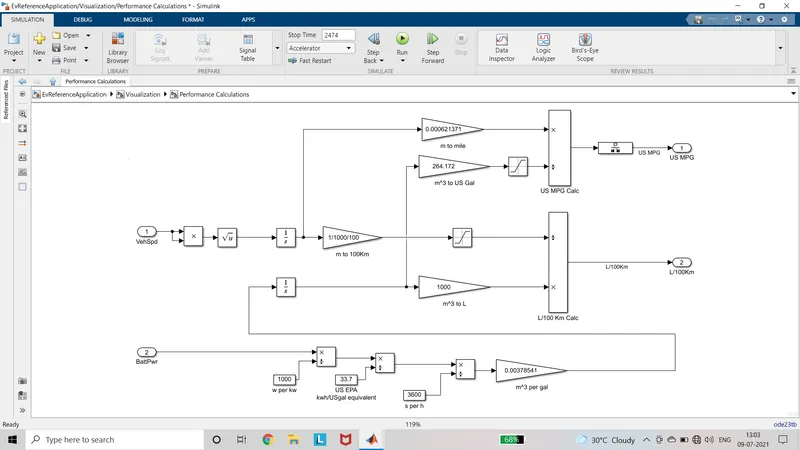
To observe how the model calculate the miles per gallon of fuel flow.
Model:
Calculations:
- Distance covered is calculated by integrating the vehicle speed and the values are converted to miles.
- Battery power in watts is converted to kW and the power is divide by 33.7 for converting it to kW/US gallon. Then to kwH/Us gallon by diving 3600.
- Then the total volume is found by multiplying the volume per gallon value of 0.00378541.
- The volume is integrated to find the fuel flow and it is converted to US gallon value by multiplying 264.12.
- The total distance in miles is divided by the US gallon equivalent to find the Miles Per Gallon.
3) HEV Reference application with WOT drive cycle:
Objective:
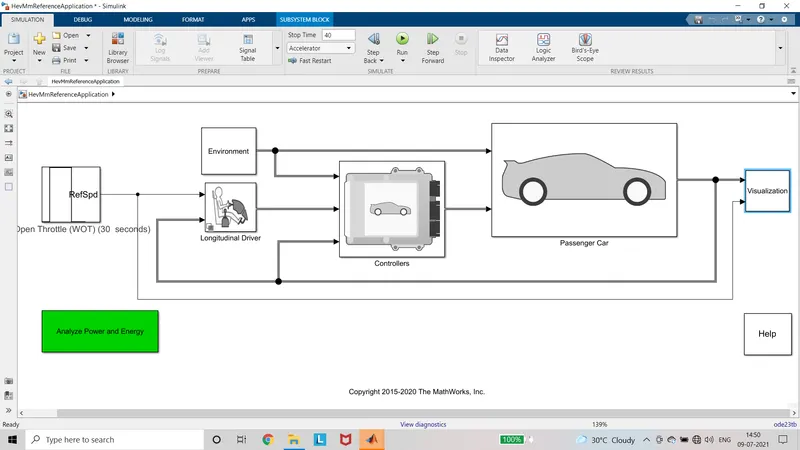
To run the HEV (hybrid electric vehicle) reference application in the WOT drive cycle. And to observe the performance , by changing the value of grade and wind velocity.
Model:
Procedure:
- Open the HEV Reference application from the help option of matlab. In the powertrain blockset by choosing the explore by hyrid electrc vehicle multimode powertrain blockset.
- In the driving cyclce, change the mode to WOT and applying and run the model for 40seconds.
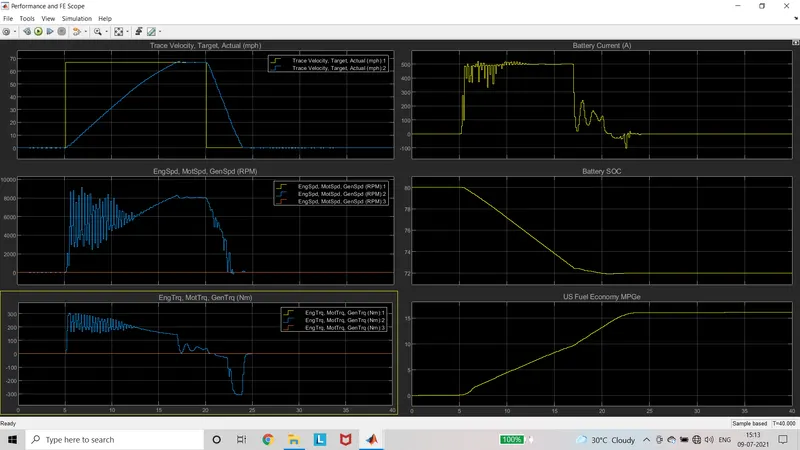
- After the compilation, the output is visualised from the scope of the visualisation subsystem.
- Then again go back and in the environment subsystem, the value of grade and wind velocity is changed to 10 and 5 respectively.
- Again run the simulation for 40 seconds.
- Now the output is visualised by the same way as before.
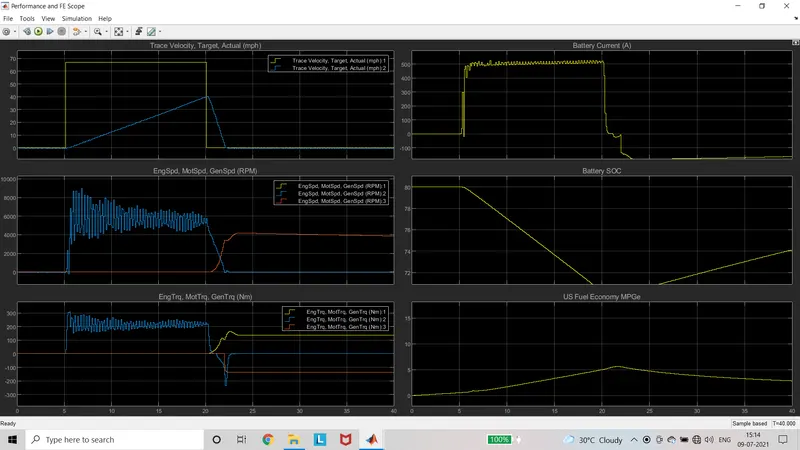
- By observing both due the environmental factors such as grade and wind velocity the performance of the vehicle is affected.
- The vehicle couldn’t attain the target velocity. Without grade and Wind velocity the same vehicle attains the top speed of 68mph in 16 seconds and runs the same speed for 3 seconds.
- But the same vehicle with the grade and wind velocity attains the maximum of 40mph in 20 seconds.
- And the fuel economy also reduced from 15 to 5mpg with the effect of grade and wind.
Result:
When the grade and wind velocity is applied the additional power is required to overcome the opposing forces. Hence the speed is reduced and fuel consumption is increased.
4) Compare the simulated results of hybrid and pure electric powertrains:
Objective:
To compare the simulated results of Hybrid electric and pure electric powertrains by keeping all the parameter same.
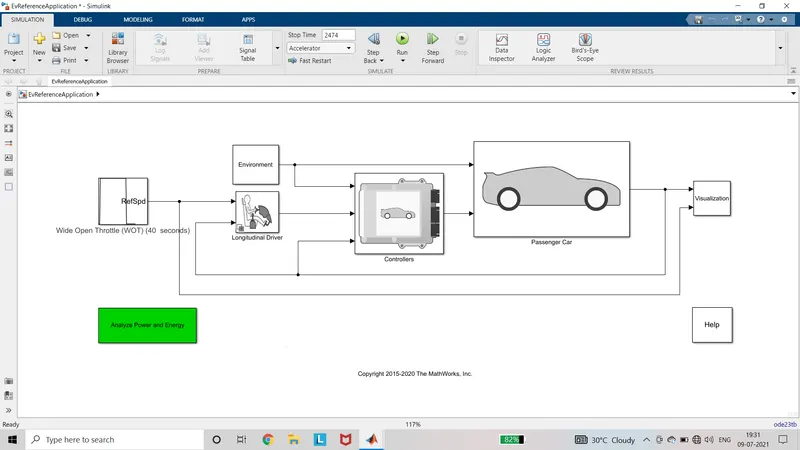
Model:
Procedure:
- Open the explore using Electric vehicle powertrain from the Matlab help.
- Change the drive cycle to wide open throttle(WOT).
- In the environment subsystem, the value of grade and wind velocity is changed to 10 and 5 respectively.
- Then the simulation is run for 40 seconds.
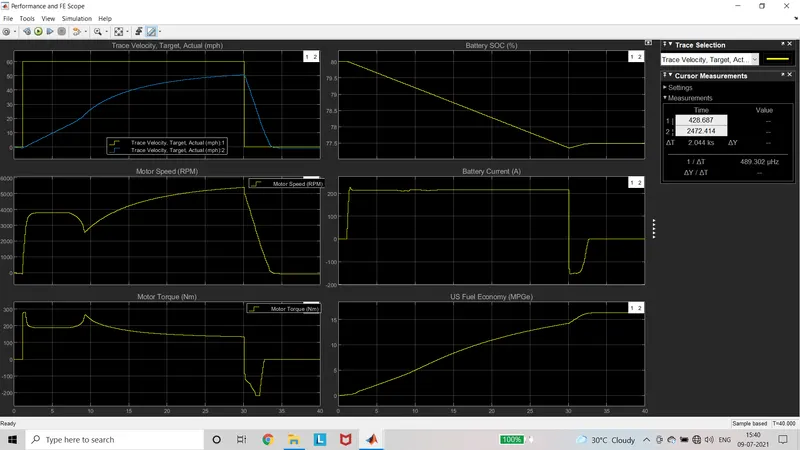
- The output is visualised in the scope of the visualisation subsystem.
- Now the parameters for both hybrid electric and pure electric are same.
Comparison:
- The maximum velocity of the pure electric vehicle powertrain is 50mph at 30seconds while for the hybrid it is 40mph at 20seconds.
- The state of charge of battery for pure electric vehicle at the end is 77.5% while for the hybrid vehicle the soc is reduced beyond 72% and after some time is again raised to 76%.
- The Hybrid Electric powertrains requires the 500A of battery power but the pure electric requires only 200A.
- The maximum value of motor speed for the Hybrid electric powertrain is around 9000rpm and for the pure electric the speed is around 5200rpm.
- The maximum value of motor torque for the hybrid electric is 310Nm and for pure electric is around 280Nm.
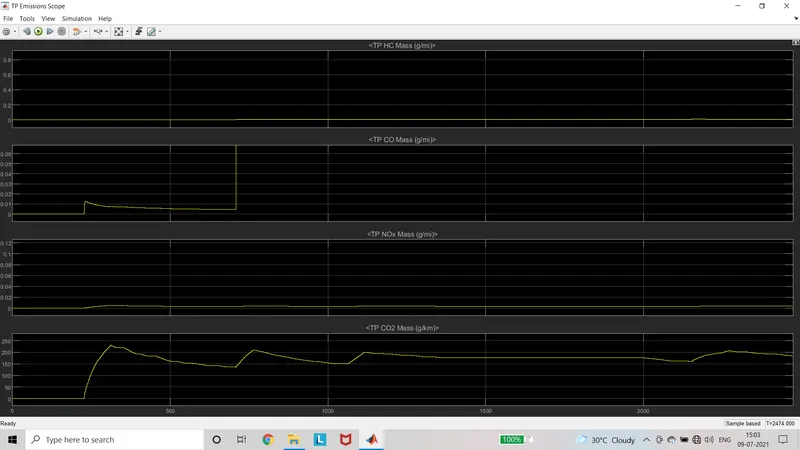
- There will be the exhaust emission values for the hybrid electric due to combustion of fuel. On the other hand pure electric vehicle there will be no emissions.
Emission for Hybrid Electric powertrain
Result:
Hence the results of both Hybrid electric and pure electric powertrains are studied and compared.