Week-4 Challenge WOT Condition Part-2
Aim:
1) What is the difference between the mapped and dynamic model of engine, motor and generator? How can you change the model type?
2)How does the model calculate miles per gallon? Which factors are considered to model fuel flow?
3)Run the HEV ReferenceApplication with WOT drive cycle. Change the grade and wind velocity in the environment block. Comment on the results.
4)Keeping all parameters the same, compare the simulated results of hybrid and pure electric powertrains.
Aim 1:
What is the difference between the mapped and dynamic model of engine, motor, and generator? How can you change the model type?
Answer:
A mapped model is a precalculated dataset in which the output values are readily available for the corresponding inputs. The values here are mapped and stored as data points that are calculated using an actual dynamic model.
A dynamic model performs a real-time simulation of components in order to generate an output.
Both mapped and dynamic models give out the same output variables for the same input. The only difference lies in the way output is generated.
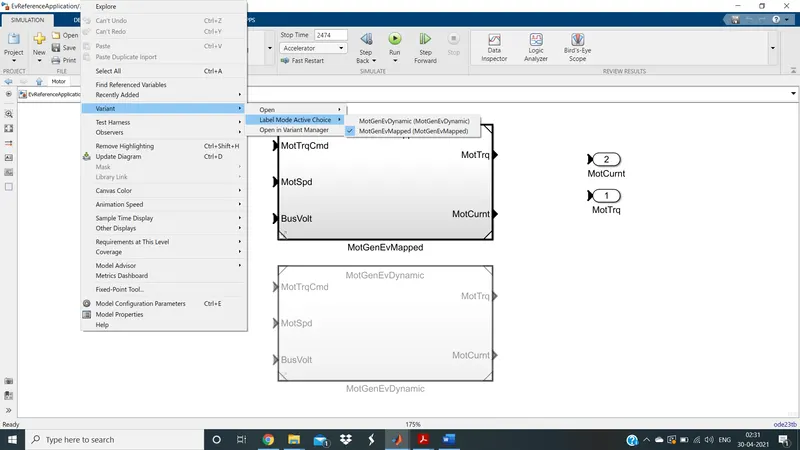
We can change the model type by right-clicking anywhere on the page where both the models are present and selecting as shown in the image below.
Aim 2:
How does the model calculate miles per gallon? Which factors are considered to model fuel flow?
Answer:
The factors considered to model fuel flow are:
i) Vehicle Speed
ii) Fuel Flow and
iii) Battery Power
The model calculates miles per gallon as shown below:
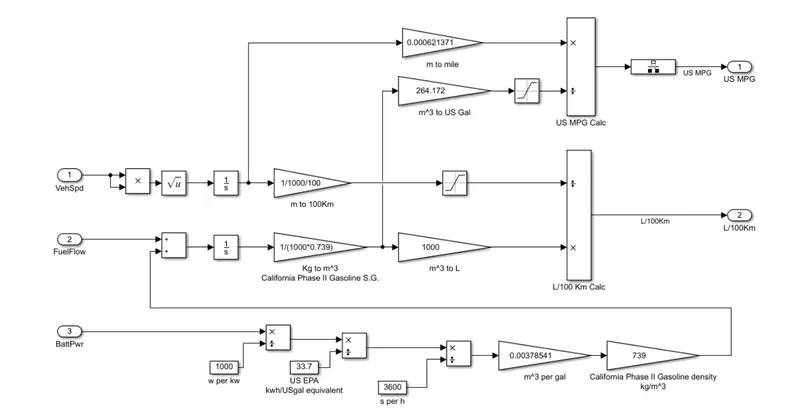
- Battery power is by default in Watts (W). W is then converted to KiloWatt -----> Gallon/hour -----> Gallon/second -----> Kg/second
- Now, both fuel flow and battery power are in Kg/second. Hence both of these sources of power are added together. Then their sum is integrated and the integrated output is converted to volume consumed (`m^3`). Next, this volume is converted into a gallon.
- Finally, the total distance traveled in miles is divided by the gallons of fuel consumed to obtain the mileage in miles per gallon.
Aim 3:
Run the HEV Reference Application with WOT drive cycle. Change the grade and wind velocity in the environment block. Comment on the results.
HEV Reference Application with WOT drive cycle (No Change in grade and wind velocity):
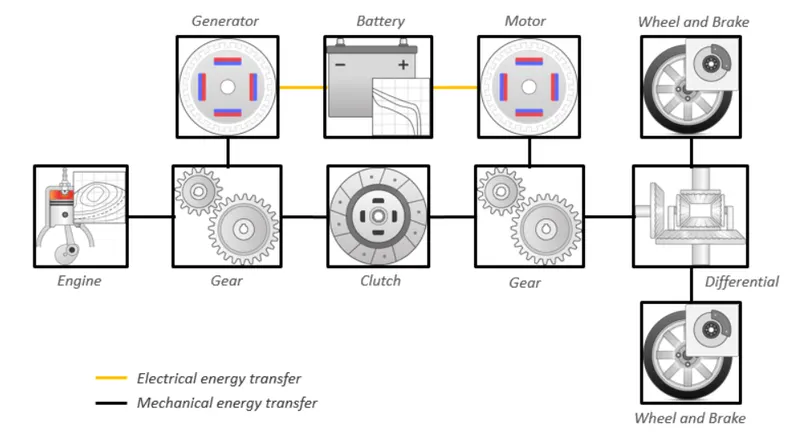
Below is a block diagram of an HEV Reference application with WOT driving cycle.
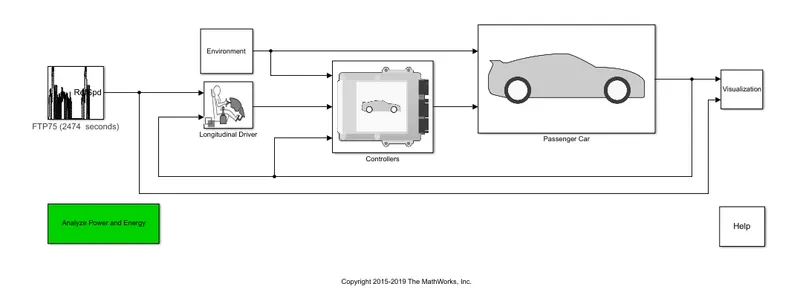
The Simulink model of the above block diagram looks as below:
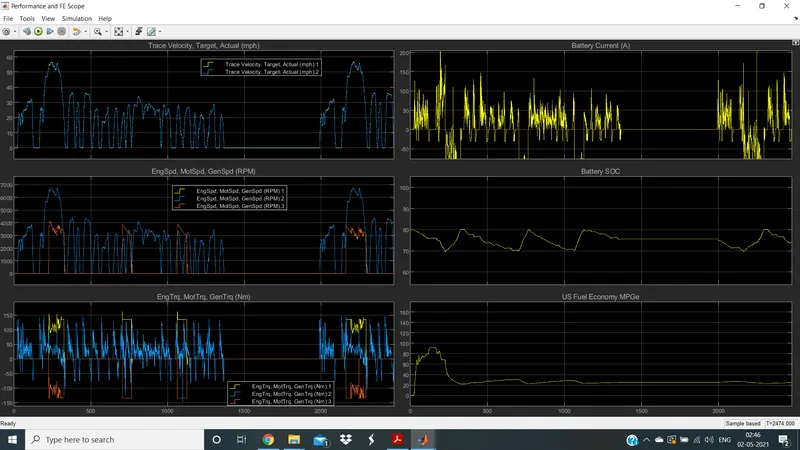
The results obtained after running the above model are as shown below.
HEV Reference Application with WOT drive cycle (With Change in grade and wind velocity):
Here we have made the changes in the vehicle environment as follows:
Grade = 5 Degrees
Wind Velocity = 25 m/sec
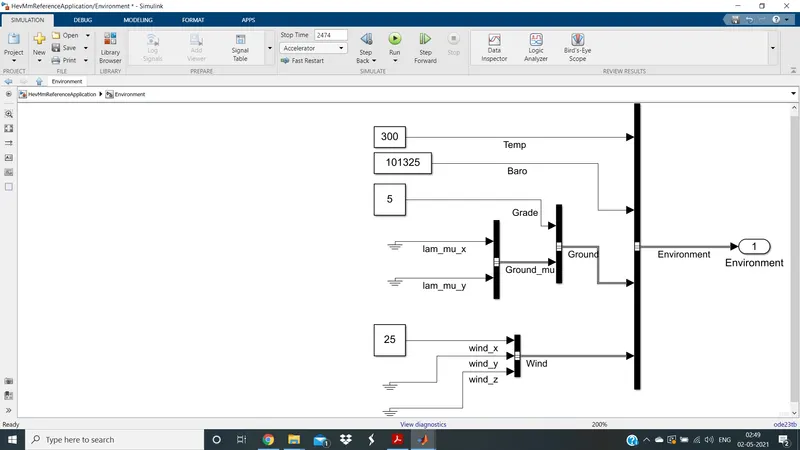
The results obtained by the same model when run with changes in environmental parameters is as shown below
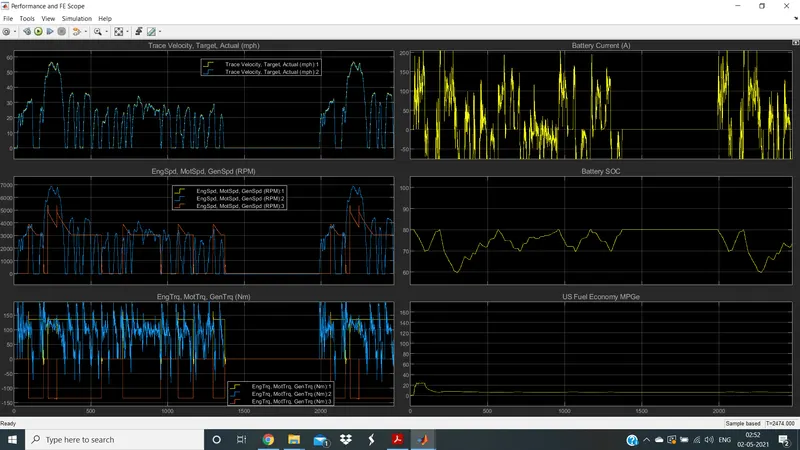
Now let us compare both the results side by side:
On the left are the results with no changes in HEV Reference Application with WOT driving cycle. Whereas the plots on the right have environmental changes.
From the above two results we can observe that:
- On the left-hand side figure, we can see that the vehicle reaches the maximum linear velocity intended by the drive cycle. But on the right-hand side figure, the vehicle does not reach the maximum linear velocity intended as there is a grade of 10 degrees and a wind velocity of 25 m/sec which opposes the movement of the vehicle.
- On the left-hand side figure, the battery SOC drains to 70%, and then it recharges to 80%. When the battery SOC is less than 70%, the engine kicks it. It runs the vehicle and simultaneously charges the battery. As soon as the SOC reaches 80%, the engine turns itself off. The recharging also happens due to the deceleration. Also, note that when the battery SOC increases, the battery current becomes negative and vice versa. The same is the case with the figure on the right-hand side but the subtle difference is that the engine has to generate a little more energy compared to the left-hand side figure in order to offset the gradient and wind velocity.
- Due to this extra energy required, the engine torque, motor torque, and generator torque are increased on the right-hand side image compared to the left-hand side image.
- Also, in the left-hand side figure the fuel economy is higher due to less energy requirement.
Aim 4:
Keeping all parameters the same, compare the simulated results of hybrid and pure electric powertrains.
EV Reference Application with WOT drive cycle (No Change in grade and wind velocity):
Below is a block diagram of an EV Reference application with WOT driving cycle.
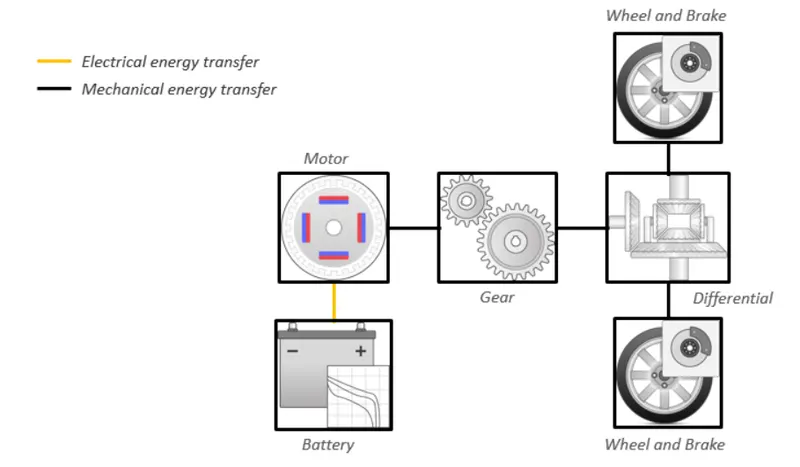
The Simulink model of the above block diagram looks as below:
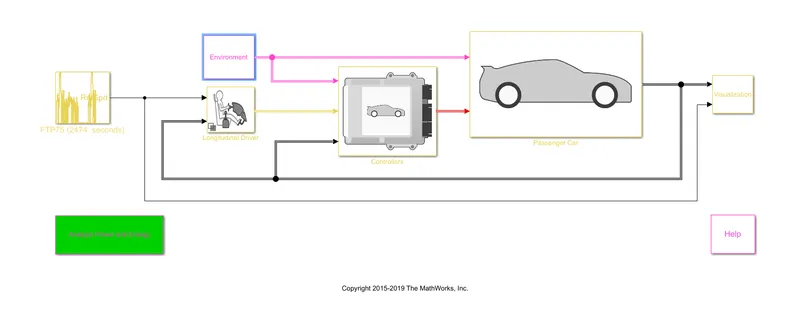
The results obtained after running the above model are as shown below.
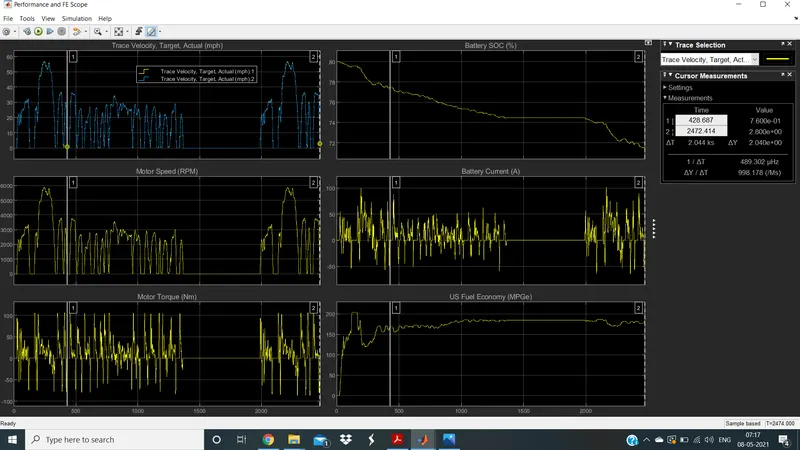
Now let us compare both the results side by side:
On the left are the results with no changes in HEV Reference Application with WOT driving cycle. Whereas the plots on the right are related to the pure electric powertrain.
- In EV, there is no fuel consumption. Hence the fuel economy of EV is high.
- Also, since we do not have an engine, we are unable to recharge the battery as previously. Hence, there is a continuous dip in the battery level. The only way the battery can be charged in an EV is regenerative braking.
- Also apparently, the weight of the EV is lower than HEV. This is the reason that the motor speed and motor torque required by EV for the same movement are lesser than HEV.