Week-4 Challenge WOT Condition Part-2
1) What is the difference between mapped and dynamic model of engine, motor and generator? How can you change model type?
MAPPED ENGINE
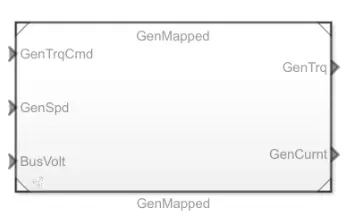
Mapped engine models are appropriate for analysis and design activities that do not require enigne subsystem dynamics, such as engine and transmission powertrain matching analysis for fuel economy, emissions, and performance trade-offs.
To characterise engine/motor output, Mapped Model employs a collection of steady-state 2-d lookup tables. The tables show overall engine characteristics such as torque, fuel flow rate, BSFC, and engine-out exhaust emissions. This model results in faster solution times.
DYNAMIC ENGINE
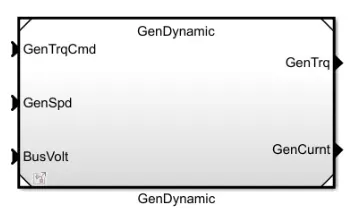
Dynamics engine models are appropriate for developing control, estimator, and diagnostic algorithms that rely on dynamic system states, such as closed loop AFR (air fuel ratio)control algorithms.
The Dynamic Model decomposes engine action into engine/motor characteristics, which are further subdivided into lower-level components. The models capture the complex effects by integrating components in this manner.
MOTOR AND GENERATOR
| SL.NO | PROPERTY | MOTOR | GENERATOR |
| 1 | Definition | An electric motor is a machine that converts electrical energy to mechanical energy. | An electric generator is a machine that converts mechanical energy to electrical energy.` |
| 2 | Rule | Electric motor follows Fleming’s left-hand rule. | Electric generator follows Fleming’s right-hand rule. |
| 3 | Principle | The working principle of a motor is based on the current-carrying conductor that experiences a force when it is kept in the magnetic field. | The working principle of generator is based on electromagnetic induction. |
| 4 | Driving force for shaft | The shaft of an electric motor is driven by a magnetic force which is developed between the armature and field. | The shaft of an electric generator is connected to the rotor which is driven by a mechanical force. |
| 5 | Current Usage | In a motor, current is supplied to the armature winding. | In a generator, current is produced in the armature winding. |
| 6 | Example | Ceiling fans, cars, etc. are all examples of motor. | In power stations, generator is used to generate electricity. |
Steps to change the model type
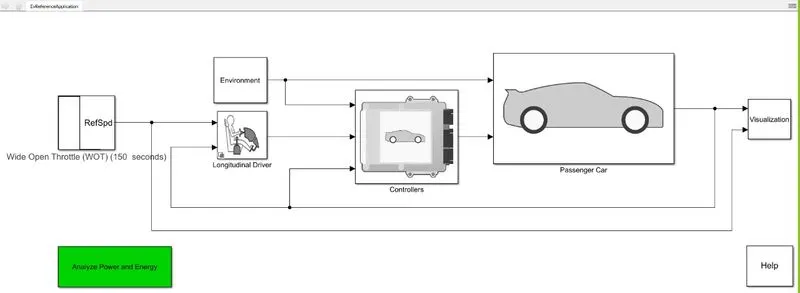
This is the main device in here, so in order to change the model type, we must first go to the passenger block to see the subsystem.
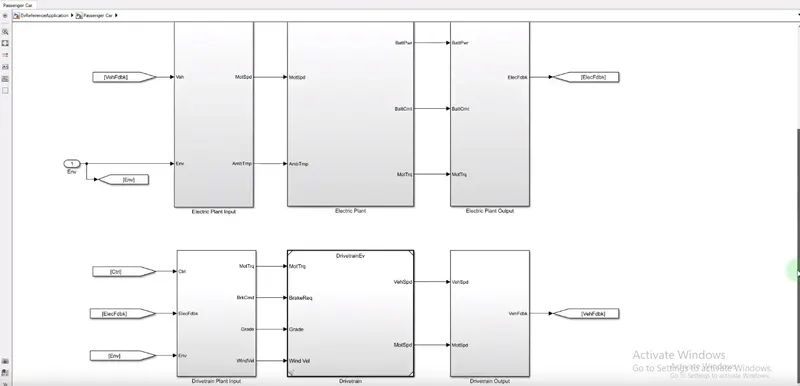
These are the subsystems in the passenger block: electrical plant and drive train. We must move through the electrical plant.
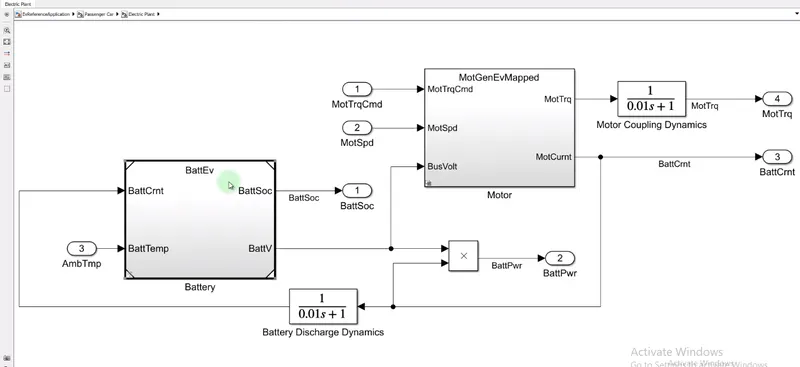
There are batteries and motors in the electrical plant subsystem, and we need to know how to adjust the motor and genetrator block, so we must go through that block.
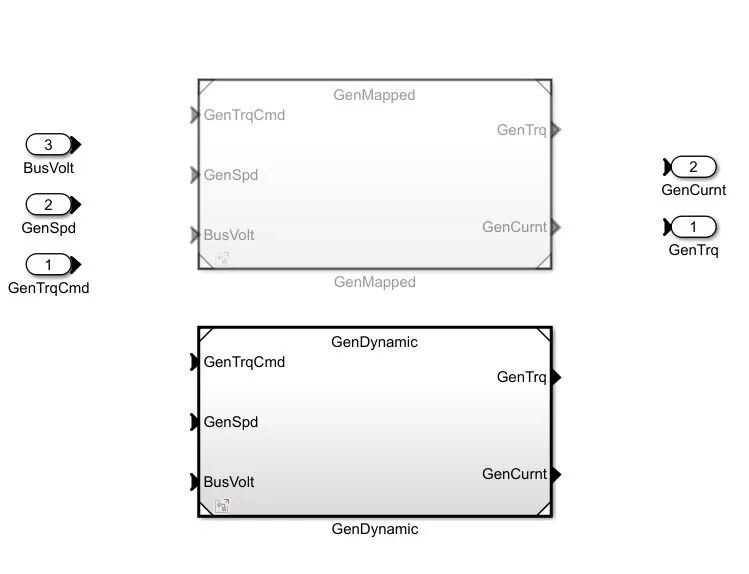
Inside that block, we can see the two block sets that are mapped and dynamic, as well as we can see how to change these models.
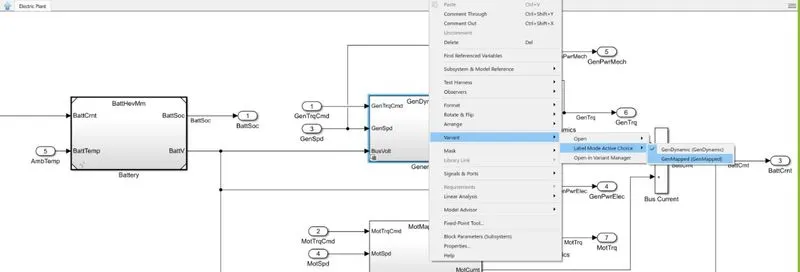
When we go through the electric plant, we must right click in the specific block set to see a variety of options. Then there will be a label model within from which we can choose mapped or dynamic.
2) How does the model calculate miles per gallon? Which factors are considered to model fuel flow?
Miles per gallon (MPG) is a fuel economy rating based on how far a traditional IC Engine vehicle can go on a gallon of gasoline or diesel. In the case of an electric car, this is a measurement of how much electrical energy the battery pack consumes to drive a defined distance.
In the powertrain block set there is a inbuild performance calculation block is there in that we can calculate the miles per gallon
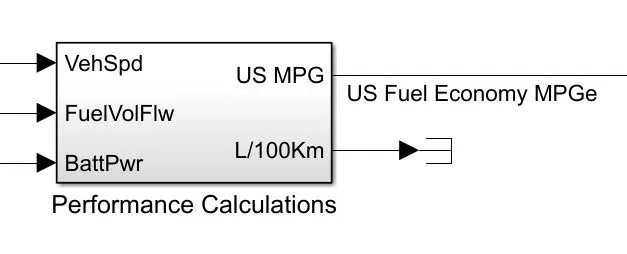
This is the performance calculation block, and the values are measured in miles per gallon here, so we can go through this sub system/
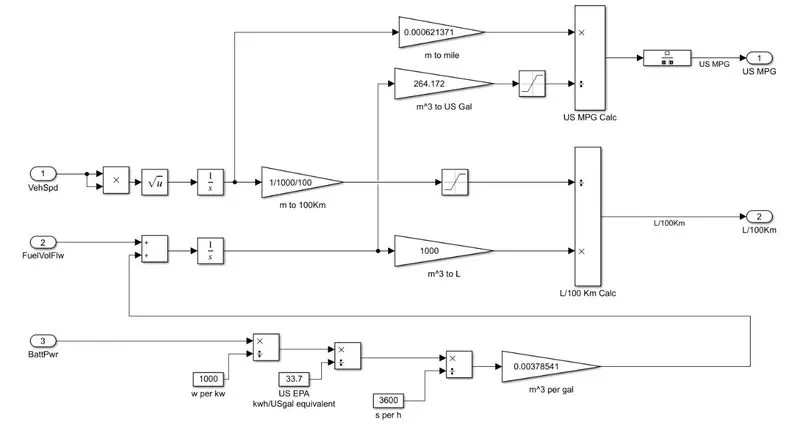
In here we can see that there are threeinputs arwe there that is * vehicle speed * Fuel flow * Batterypower
inside the subsystems these are the blocks are there bythe given three input we get the performance calculation in miles per gallon
- The vehicle speed is input in millimetres per second and translated to miles by multiplying by 0.000621371.
- Similarly, the kilogramme of fuel is translated into cubic metres by multiplying it by 1/(1000*0.739). This cubic metre value is then multiplied by 264.172.
- The battery value is now converted from watts to kwh by dividing by 1000.
- We can then convert it to gallon equivalent by dividing it by 33.7, and we know that 33.7 kwh=1 gallon. then divide by 3600 to get the value in seconds and multiply by 0.00378541 to get the value in cubic metres per gallon.
Factor effecting fuel flow
The factor influencing fuel flow is calculated using the given two inputs: vehicle speed and battery power.
3) Run the HEV ReferenceApplication with WOT drive cycle. Change the grade and wind velocity in the environment block. Comment on the results.
Main System
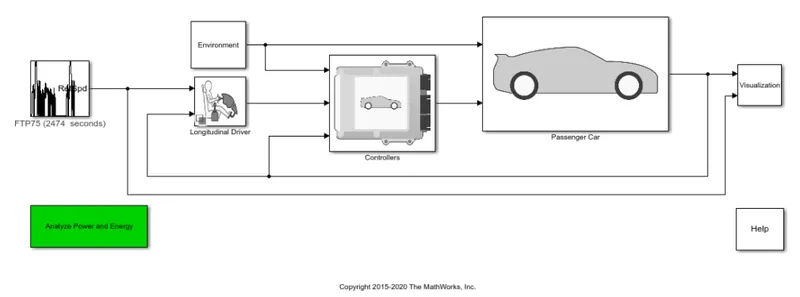
This is the main system of this stimulation, and we can see which is input signal,environmental block,driver block,controllers block,passenger block,so we have to change the input signal and add the Wide open throttle (WOT) in here.
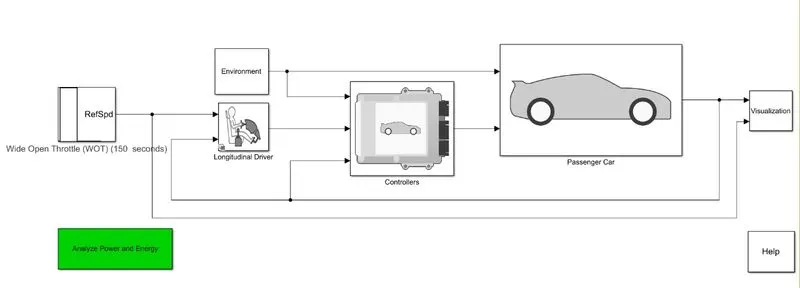
So, as seen in the above system, we changed the input signal to Wide open throttle at 150 seconds.
As we can see from the environmental block, we need to change the grade and wind velocity in that block.
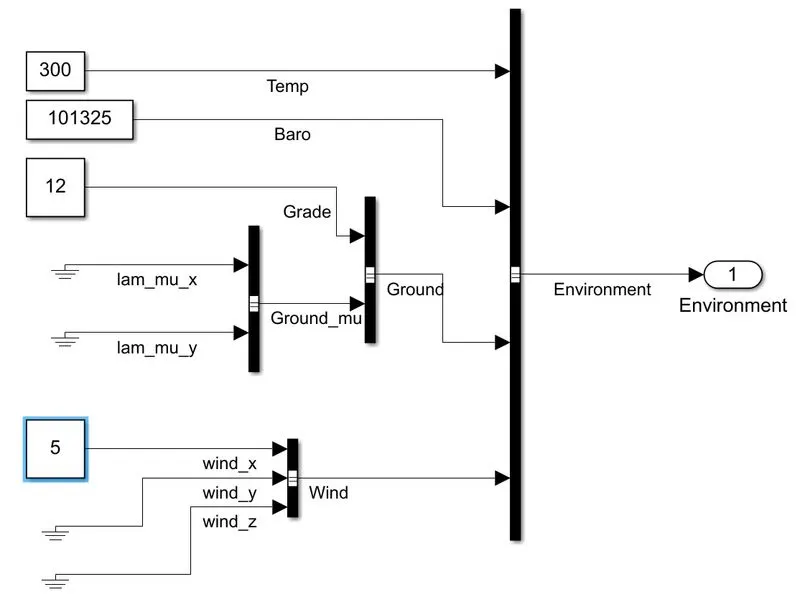
This is the environmental block's subsystem; we changed the grade value to 12 and the wind velocity to 5, and we'll see what output is
Output signal
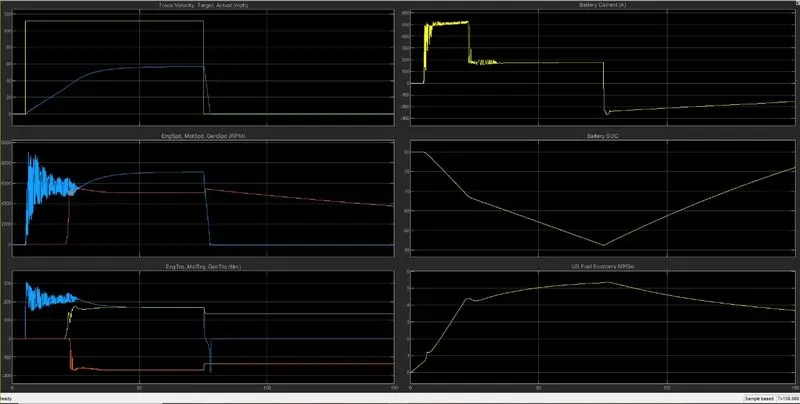
This is the output signal which we get after the stimulation
| PLOT 1 | |
| Top velocity achieved | 59 mph |
| Time taken to accelerate | 75 sec |
| Time taken to deaccelerate | 2 sec |
| PLOT 2 | |
| Top motor RPM | 8700 rpm |
| Top engine RPM | 5600 rpm |
| PLOT 3 | |
| Maximum motor torque | 305 Nm |
| Maximum engine torque | 175 Nm |
| PLOT 4 | |
| Battery current | 190 at maximum throttle |
| PLOT 5 | |
| Battery SOC | 80% to 55 % at acceleration and 55% to 75% at deacceleration |
| PLOT 6 | |
| Fuel economy | 5.3 |
4) Keeping all other parameters same, compare the simulated results of hybrid and pure electric powertrains
simulation result for HEV
Simulation result for EV
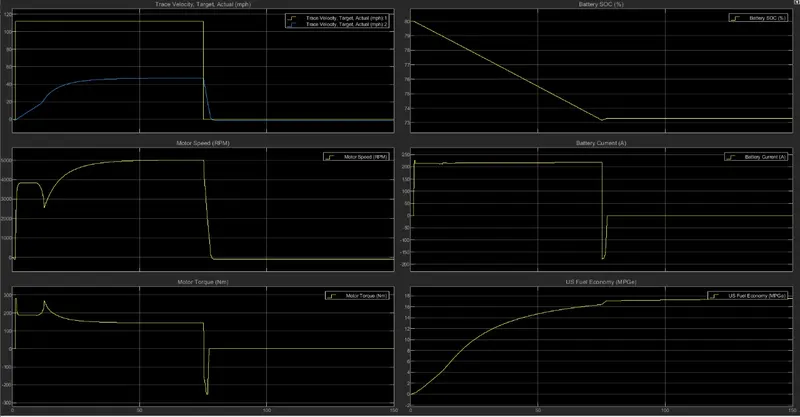
| HEV | EV | |
| PLOT 1 | ||
| Top velocity achieved | 59 mph | 43 mph |
| Time taken to accelerate | 75 sec | 75 sec |
| Time taken to deaccelerate | 2 sec | 2 sec |
| PLOT 2 | ||
| Top motor RPM | 8700 rpm | 5000 rpm |
| Top engine RPM | 5600 rpm | NA |
| PLOT 3 | ||
| Maximum motor torque | 305 Nm | 130 Nm |
| Maximum engine torque | 175 Nm | NA |
| PLOT 4 | ||
| Battery current | 190 at maximum throttle | 230 at maximum throttle |
| PLOT 5 | ||
| Battery SOC | 80% to 55 % at acceleration and 55% to 75% at deacceleration | 80% to 73 % at acceleration |
| PLOT 6 | ||
| Fuel economy | 5.3 | 17.8 |
Observation
- Top Speed achieve by the Hev vehicle is more than the Ev vehicle.
- Since the motor is the only source of propulsion in an EV powertrain, it must produce higher rated power and instantaneous start-up torque in order to propel the vehicle.
- HEVs use lead acid batteries, while EVs use lithium-ion cells, which have a higher energy density.
- HEV has fuel economy than EV