Week - 4
1)
IMPLEMENT CONTROL LOGIC OF A WASHING MACHINE USING STATEFLOW
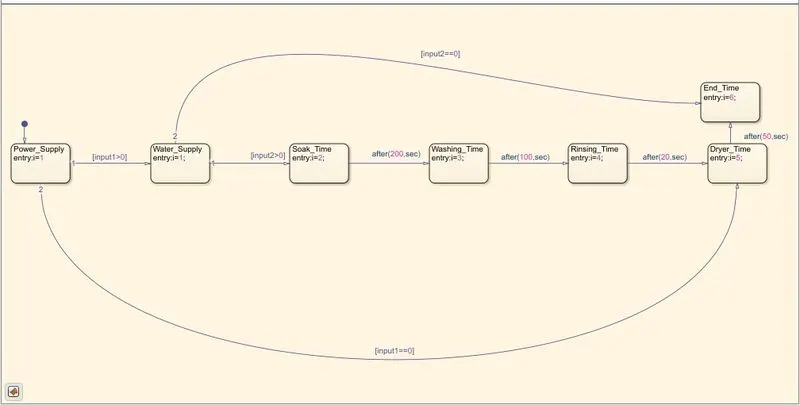
In this section, we will use a stateflow diagram to implement the control logic of a washing machine. First, we must draw a stateflow diagram for the given condition.
State Flow :
Stateflow uses a graphical vocabulary with state transition diagrams, flow charts, state transition tables, and truth tables. By describing how MATLAB algorithms and simulink models respond to input signals, events, and time biassed conditions using stateflow.
Washing machine
The washing machine is used to wash clothes, and many processes take place within the machine. We are all aware that by using a washing machine, the cloth washing process has become automatic. When we start a washing machine, we must place our clothes in it, and the machine will automatically fill with water, soaking the clothes until the washing process begins.The motor begins to work and the clothes are washed. Following the washing process, the clothes are rinsed and dried by the dryer.
These are the process we have to do using the simulink
Block used
Constant block

The Constant block produces a constant value signal that can be real or complex. This block is used to provide a constant signal input.
Chart block

A Stateflow chart is a graphical representation of a finite state machine made up of states, transitions, and details. A Stateflow chart can be used to describe how a MATLAB algorithm or Simulink model responds to external input signals, events, and time-based conditions.
Lamp

To show the value of the input signal, the Lamp block shows a colour. The Lamp block can be combined with other Dashboard blocks to create an integrated dashboard of controls and indicators for your model. During simulation, you can define pairs of input values and colours to provide the information you need.
Steps
- To run the washing machine's assigned sequence operation, we must construct a state flowchart to execute the operation with respect to time.
- If the power supply is available, the device is enabled. To start the device, we must have an input signal using a constant block with a value of 1 defining On and 0 defining Off.
- We will need to have a constant block to inform the circuit about its current state for water supply.
- To complete all of the operations, we must assign a delay after each stage using after logic.
- A lamp block is added to show all of the operations, and each colour is allocated to a different state. We may examine the lamp colour by adjusting the simulation time.
- At the output, a display block is attached to show the time phase.
MAIN SYSTEM
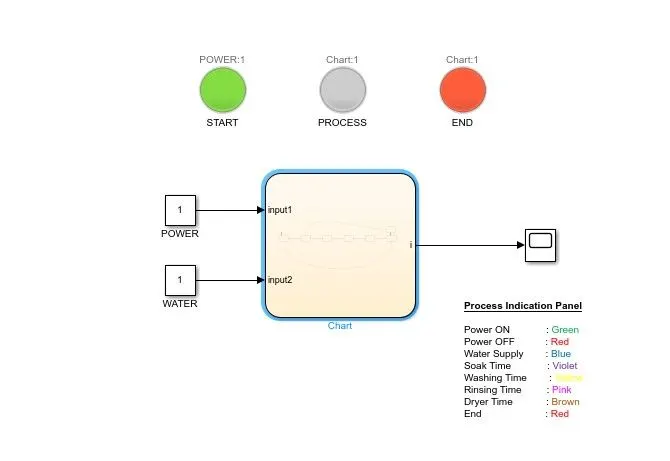
This is the main system for the washing machine in here there are two input POWER and WATER and there are three lamps which indicates process of the washing mahine
* Checking if the power supply is on then system get activated
If the power is off the lamp will be in red colour and if the power is on it wil be in green colour 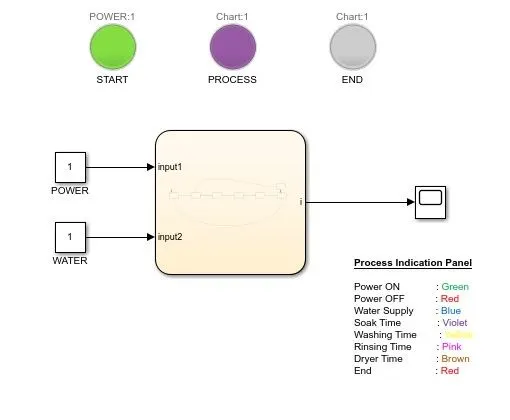
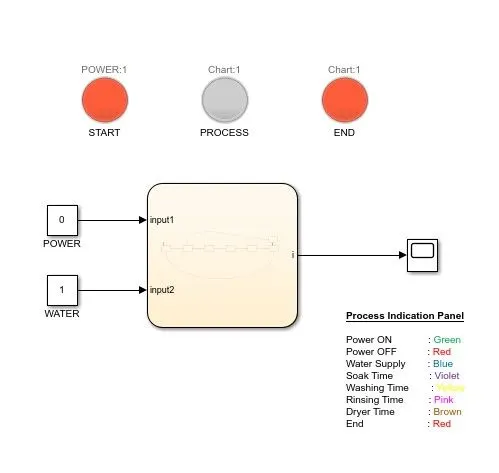
We can see that when the input power is 1, the start lamp colour is green, and when the input power is 0, the start lamp colour is red.
So, when the power is turned on, the device is triggered, and the green colour is shown.
* Checking if the water supply is not available the process stop
If the water supply is zero, the system will be switched off and the stoplamp will turn red.
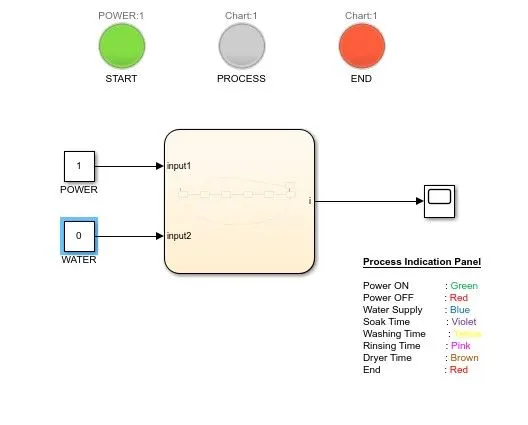
In this case, we can see that the power supply is turned on but there is no water, so the END indicator is flashing red. As a result, we may conclude that the mechanism is ineffective and there is no water flow.
* soaking time should be 200s
When the power supply and the water supply is available then the washing machine starts to work .
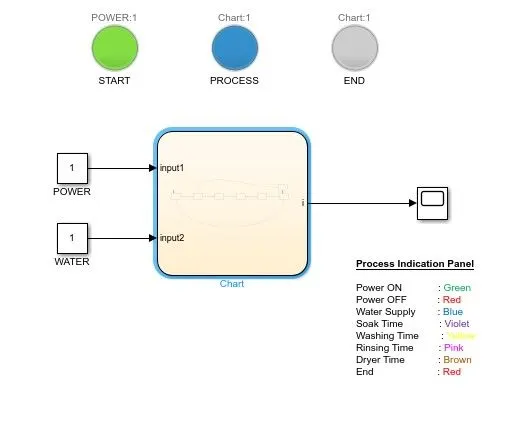
When the machine's power supply and water are turned on for the first time, the start lamp will be GREEN, and the process indicator will be BLUE, indicating that the water is filling.
Following the filling of the water, the clothes would be soaked for up to 200 seconds.
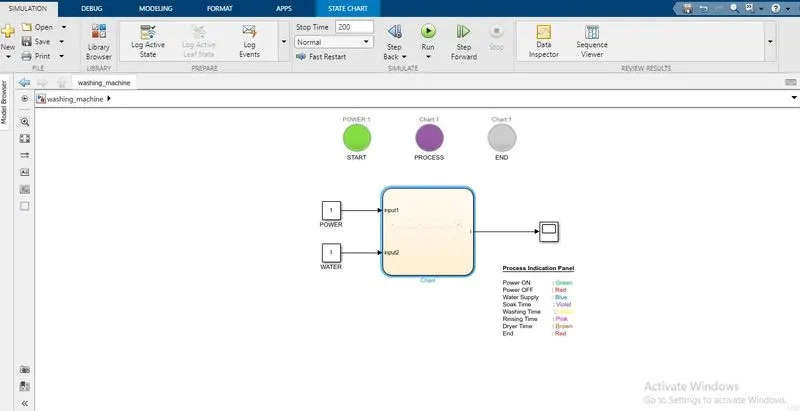
The stop time is 200 seconds, indicating that the process is soaking. The violet colour indicates that the process is soaking.
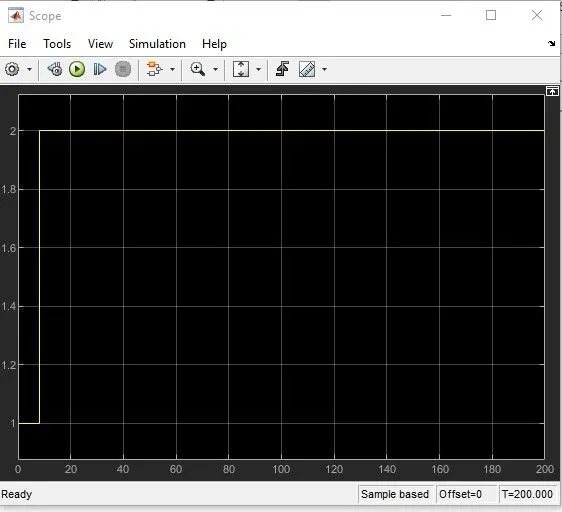
This is the output signal which we get when the time is 200 sec
* Following the soaking process, the washing process will take place for the next 100 seconds.
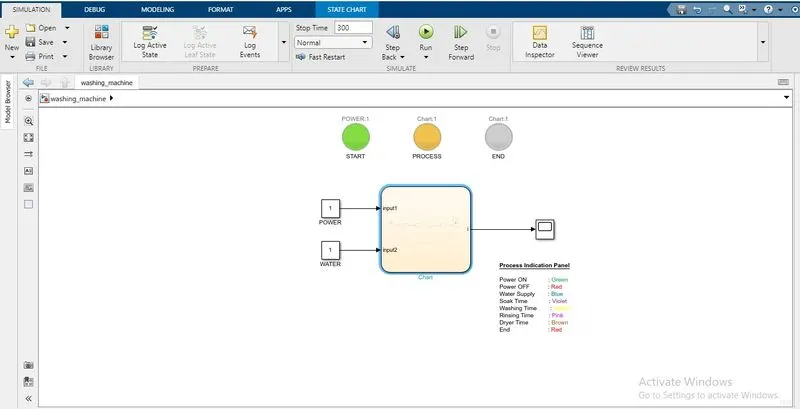
The phase that is taking place here in the 300th second is washing time, during which time the clothes are washed. In here the lamp indicate yellow colour.
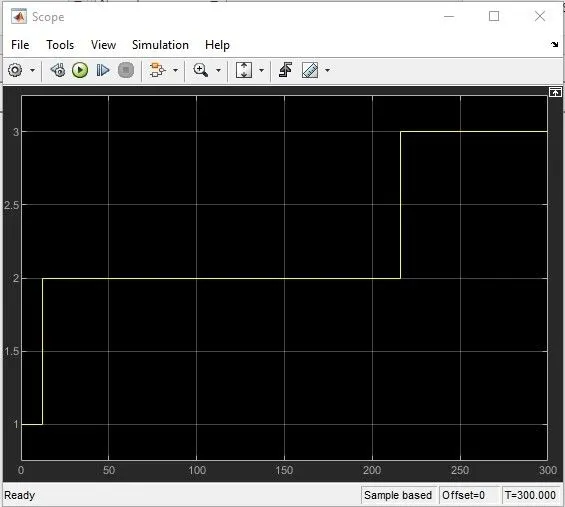
In the washing time the ouput signal will be as shown above
* after the washing process the rinsing process occur for next 20sec
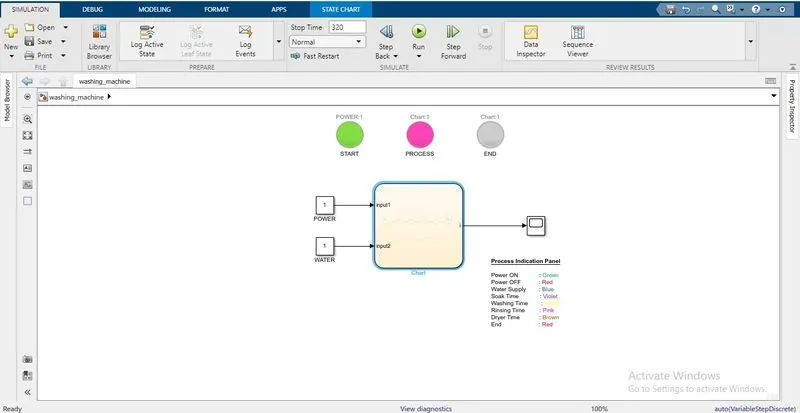
The phase taking place in 320 seconds is rinsing time. After the clothes have been cleaned, they are rinsed and then placed in the dryer.In this time the lamp indicate pink colour.
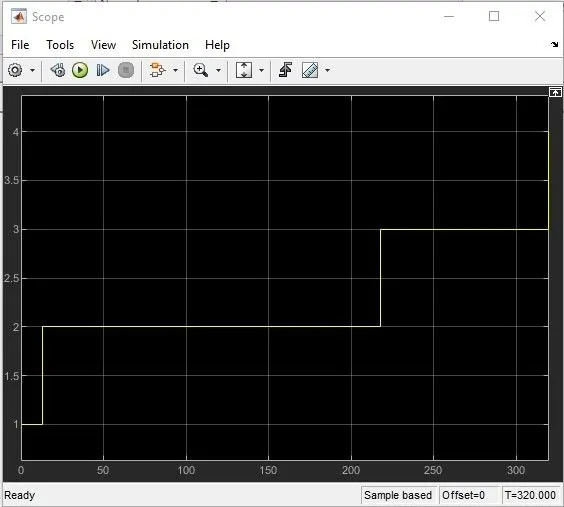
At the 320 sec the output signal willbe as showned above.
* After the rinsing process dryer runs for 50 sec.
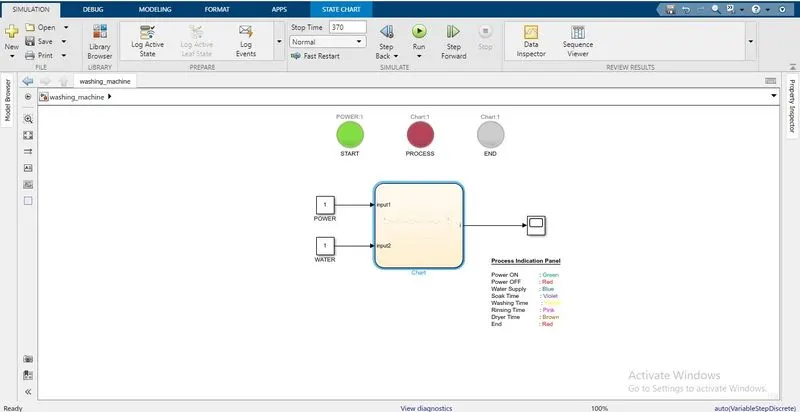
After the rinsing process, the dryer works for 50 seconds. The process in the dryer is that the clothes dry after the rinsing process, and the dryer's lamp indicates a brown colour.
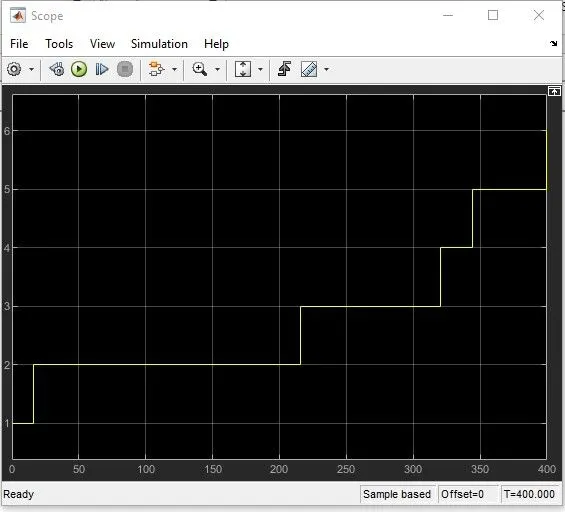
This is the key output signal that we get at the end of the operation.
After the whole procedure has been completed. The stop lamp in the washing machine will be red, indicating that the washing process is complete.
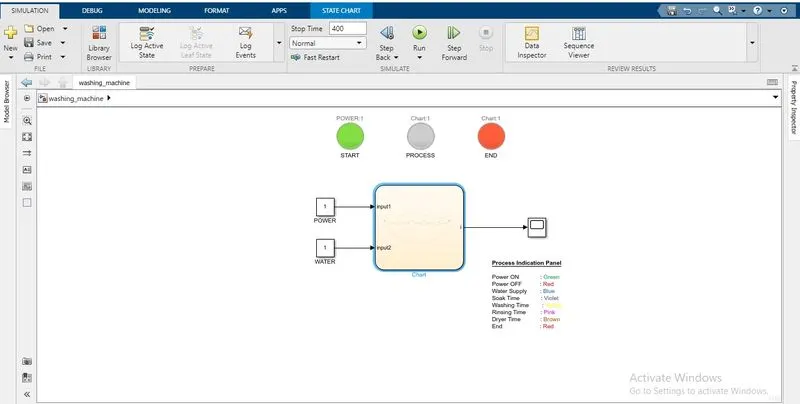
After the whole process is completed, the end lamp will glow red. It denotes that all of the processes have been completed.
2)
Make a Simulink chart for the “Gear shift” logic
Block used
Constant block
The Constant block produces a constant value signal that can be real or complex. This block is used to provide a constant signal input.
Chart block
A Stateflow chart is a graphical representation of a finite state machine made up of states, transitions, and details. A Stateflow chart can be used to describe how a MATLAB algorithm or Simulink model responds to external input signals, events, and time-based conditions.
Lamp block
To show the value of the input signal, the Lamp block shows a colour. The Lamp block can be combined with other Dashboard blocks to create an integrated dashboard of controls and indicators for your model. During simulation, you can define pairs of input values and colours to provide the information you need.
Slider block
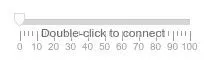
During simulation, the Slider block adjusts the value of the connected block parameter.
steps
- A chart block is generated to perform the gear shifting using the logic of'>= and >= ', and the number as per the speed is shown on the speedometer.
- For each point, a logic is generated based on the given speed range. A constant block is given to turn on the engine, as well as a display block to display the current gear number.
- To allocate speed values, a slider block is used as a speedometer and is connected to a constant block.
- We can check the gear shift number on the display block by adjusting the speed, and lamp blocks are connected at each stage of the gear shift to show the gear position in relation to speed.
MAIN SYSTEM
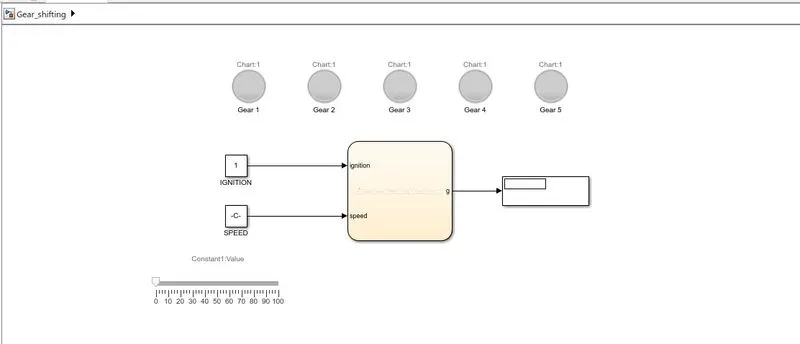
This is the main system of the gear shifting operation, and we can see that we have two constants linked here, one for the ignition and another for the speed. We added a slider for adjusting the speed to the speed constant block. So, using the slider, we can adjust the speed in the chart to which we have linked the state flow diagram, and the speed is recognised and the output is shown in the display block.
state flow diagram
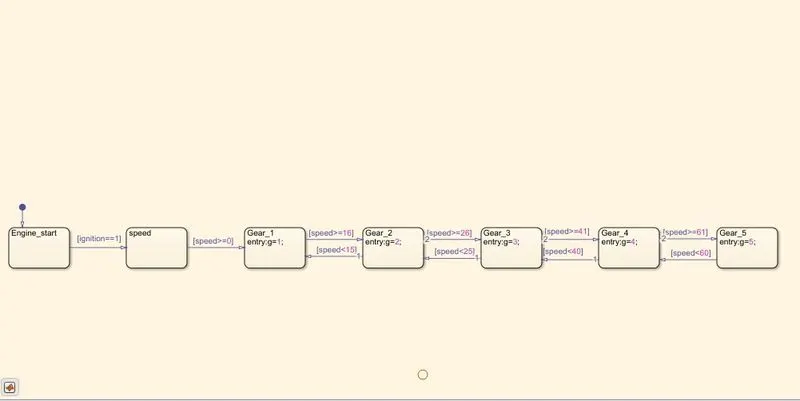
The state flow diagram of the gear shifting mechanism is shown here. First, we check to see if the ignition is turned on or off.
If the ignition is turned on, it will check the speed, i.e. if the speed is between 0 and 15, it will show gear 1.
If it is greater than 15, another condition is verified, like wise the speed is calculated using this flow chart.
* We can check the first condition to see what the performance would be if the speed is between 0 and 15.
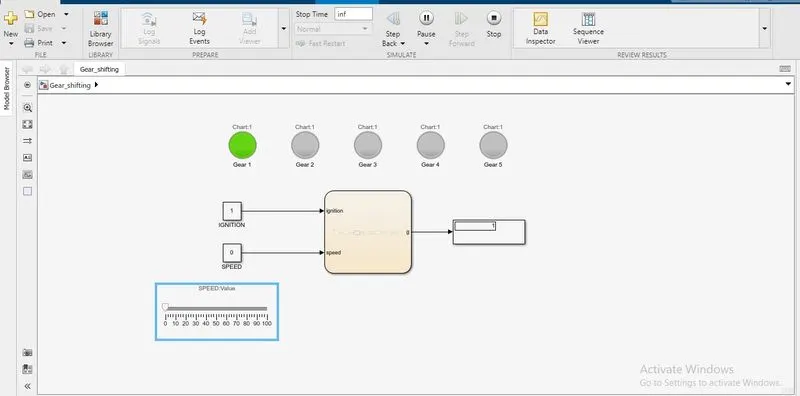
In this case, we can clearly see that the display output is 1 from 0 to 15 speeds, indicating that it is in first gear, and the lamp connected to the displays the output as gear 1.
* So we can check for the next condition from 16 to 25 speed
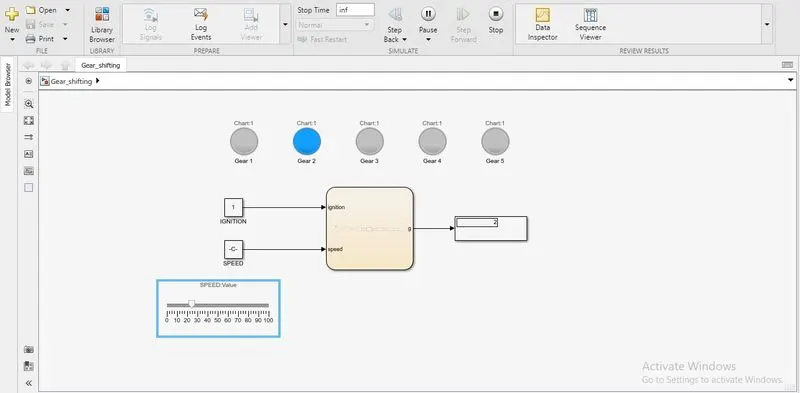
The lamp on this one shows that it is in second gear. We can see that the speed is between 16 and 25 mph, and that the vehicle is in gear 2.
* We can check the condition weather the speed is between 26 to 40 what the gear will be
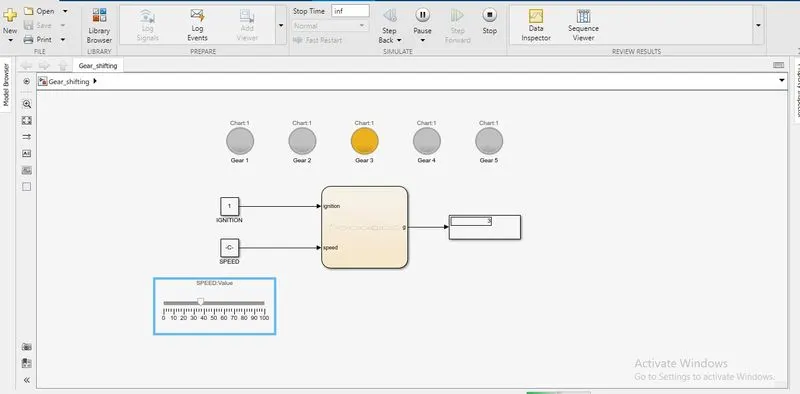
The gear 3 indicator on this indicates that the vehicle is in third gear. And the speed ranges from 26 to 40 miles per hour. The display indicates that it is in third gear.
* From 41 to 60 we can check the gear positon andhiw output will be.
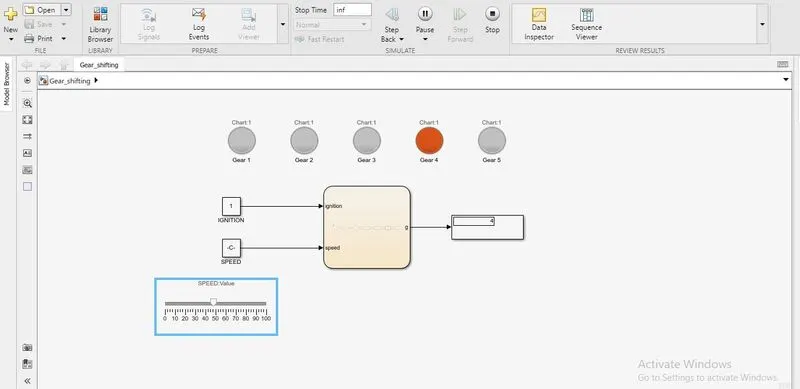
In this case, the gear 4 indicator is flashing, and the display itself indicates that it is in fourth gear, with a speed ranging from 41 to 60 mph.
* we can check for the speed range more than 61
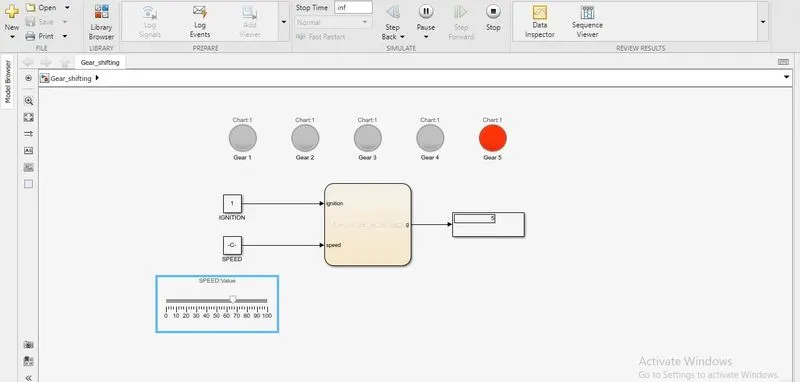
Since the speed range is greater than 61 at this time, the vehicle is in fifth gear, as shown by the display and the indicator lamps.
CONCLUSION'
Using the state flow, we carried out the washing machine process and checked the results. implement the control logic in accordance with the given conditions
Using the simulink chart, we performed gear shift logic and then obtained the output based on the given condition.