Week-4 Challenge WOT Condition Part-2
Aim
Comparing the difference between mapped and dynamic Engine, Motor and Generator and how we can change the actual model type.
Explanation
Mapped Engine, Motor & Generator
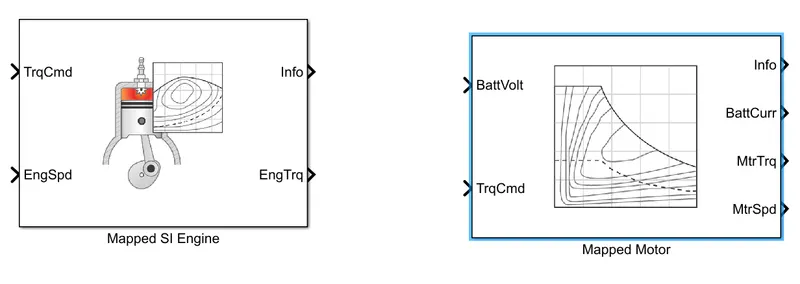
- In mapped Block of Engine, Motor and Generator we are using the known values are given using the Lookup tables
- This can reduce the simulation time compared to the Dynamic Block and which cannot possible to do in real-time scenarios
- The below images shows the mapped Block of the SI Engine, Motor & Generator.
Dynamic Engine, Motor & Generator
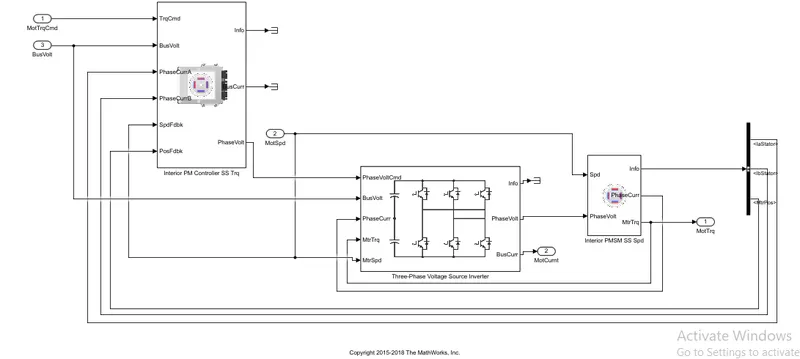
- This Dynamic model is the combination of sub-systems with real-time blocks that gives the real-time output values for the given Drive cycle
- This model will take more simulation time compared to the Mapped Block but the accuracy of the model is high
- the below image shows the Dynamic model Example of the Motor and Generator here we are using the PM Motor instead of Pre-Defined values.
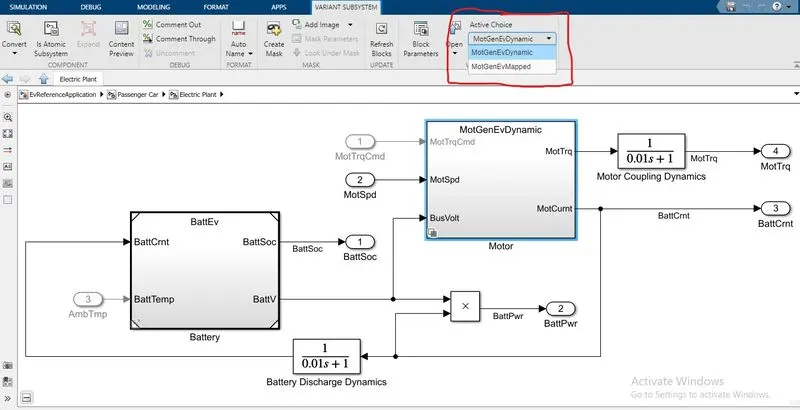
We can change the Actual model type in the vehicle Subsystem by using the Variant Subsystem tab which is on the top right as shown below Image.
Aim
How does the model calculate miles per gallon? Which factors are considered to model fuel flow?
Explanation
Calculation of miles per gallon of the model and the factors considered for the modelling of fuel flow of HEV model as explained below
Below Model shows the Calculation of Miles per gallon for HEV.
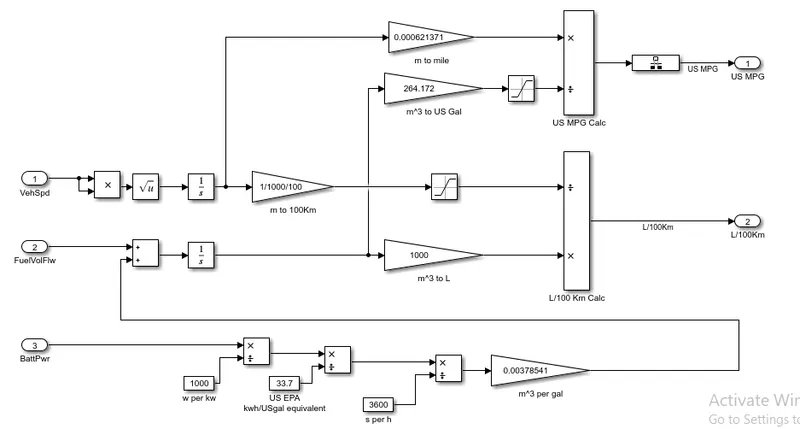
For Calculating the MPG of the HEV model we have to consider both Battery, Fuel Energy and Vehicle speed
- First, we have to convert the vehicle speed from m to Miles
- then we have to convert the battery power from W to KW/h and then convert to m^3 per gallon which can get by multiplying with the standard value of 0.00378541 then this value is added with Fuel Volume and further it is converted to M^3 to the gallon
- this can be done by using the basic Simulink blocks for modelling MPG
the factors considered for the fuel flow of this model are
- Vehicle speed
- Battery power because we are using HEV Model
- fuel flow
AIM
Analysis of HEV Reference model by using WOT Drive cycle by changing the grade value and wind velocity and keeping the other parameter values same and also comparing it with EV Powertrain model
Explanation
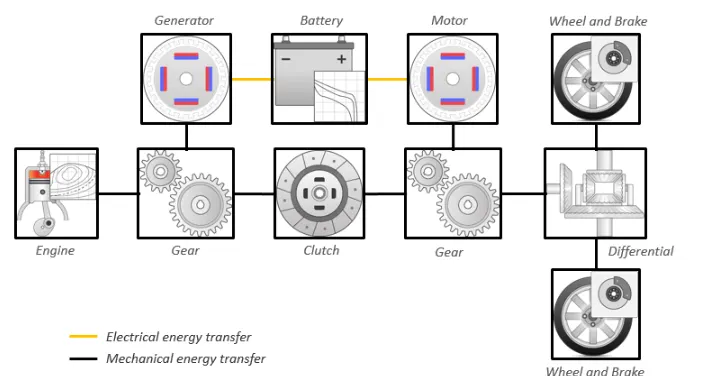
The below diagram shows the HEV powertrain configuration and the HEV application model with WOT drive cycle has shown below
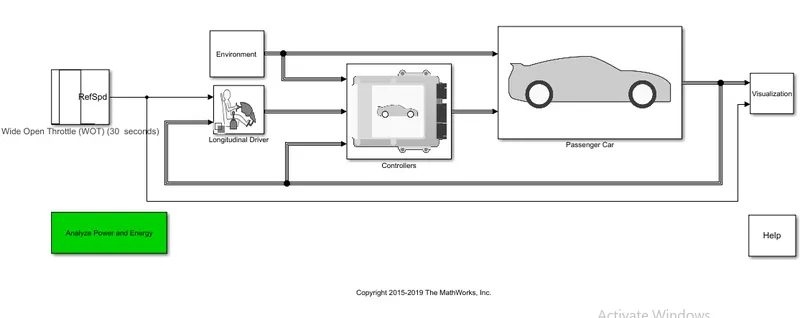
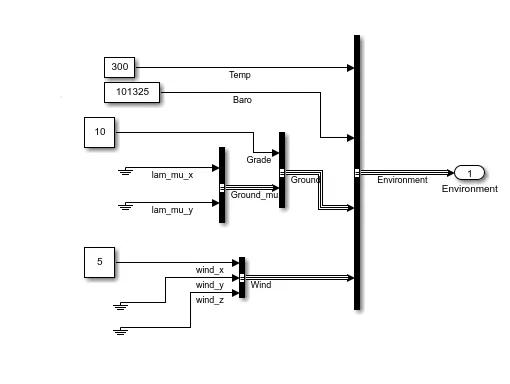
For the above HEV model, we are using WOT drive cycle as input velocity and grade value as 10 and wind velocity as 5 in the environment block as shown below
We can simulate with the above values and we can analyze the output plot shown below
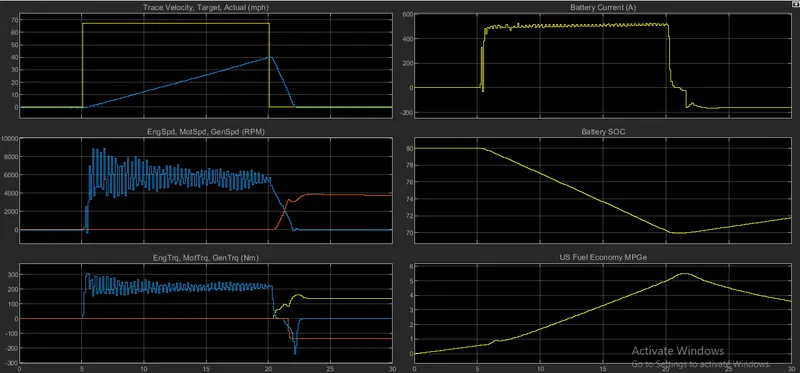
- from the above plot, we can observe the input velocity is not achieved by the vehicle due to grade value and the wind velocity it has reached to 40Mph where the input velocity is 70Mph
- initially, it has taken the only motor power to reach the top speed and the engine running at constant speed if we observe plot 2 due to wind velocity and some gradient value the engine reached to certain rpm were generating the power to the battery
- by seeing plot 5 initially the Battery soc starts decelerating from 80 to 70 after reaching 70 it starts increasing the battery soc which also decreases the fuel economy to down
if we observe the below output plots which have 0-grade value and 0 wind velocity is shown below
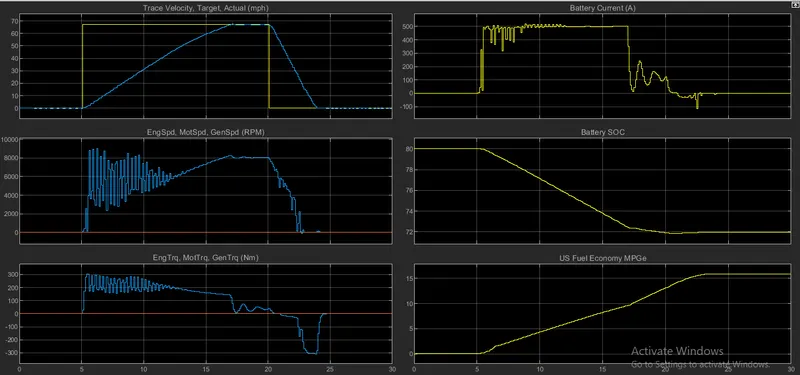
- from the above plot, we can observe the input velocity has been achieved by the vehicle with a top speed of 70Mph within 18 Sec which can be achieved by using motor power by seeing the battery soc it takes 8% of battery power to reach that speed where the engine speed remains at zero.
let us compare the output values of the HEV model with the EV model, The below image shows the EV powertrain configuration and the EV application model with WOT as input drive cycle
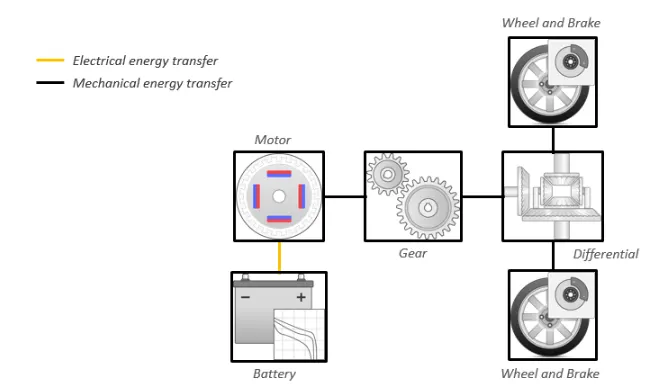
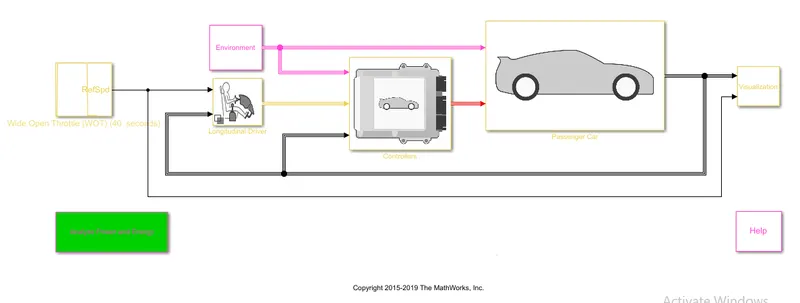
In the above model, we are using the same Drive cycle by keeping the grade and wind velocity zero the below output plot has been shown below
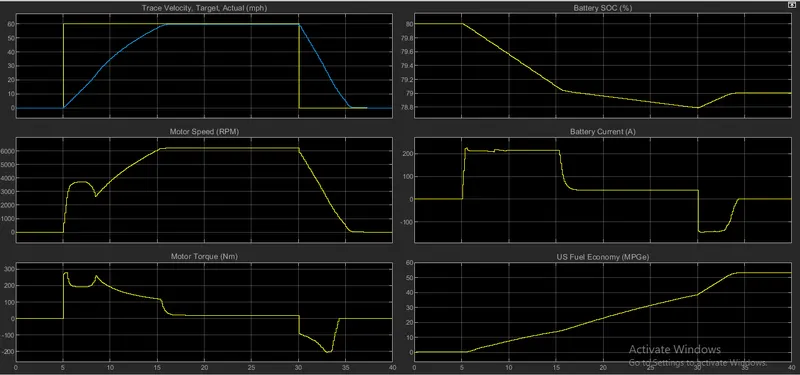
- from the above EV output plot, we can analyze that velocity of the vehicle has reached within 12s with a speed of 60mph which is less than the HEV where it reaches 65 mph within 15s
- In the EV model while decelerating the vehicle speed due to regenerative braking we have gained some Power which has been shown in the battery soc
- we can observe that the Fuel Economy has doubled compared to the HEV model
Conclusion
- from the above study, we can observe the difference between mapped and dynamic model and their uses in analysis in the real-time scenarios and how we can change from mapped to dynamic in the model itself.
- understanding the HEV application model using different drive cycle and comparing it with EV application and analyzing the output results
- we can get to know how to change the parameter values to get the real-time simulation values like by changing the grade value and wind velocity and etc...
References
The above application models are taken from MathWorks powertrain reference applications.