Week-4 Challenge WOT Condition Part-2
1.What is the difference between mapped and dynamic model of engine, motor and generator? How can you change model type?
-
Powertrain Blockset provides two types of combustion engine models: mapped and dynamic.
Mapped model of engine
-
Mapped engines represent macro engine behavior as a set of lookup tables (brake torque, fuel flow, air mass flow, exhaust temperature, efficiency, and emissions) as functions of commanded load and measured engine speed.
- Mapped engine models are suitable for analysis and design activities that do not require engine subsystem dynamic characteristics, for example, in engine and transmission powertrain matching analysis for fuel economy, emissions, and performance tradeoffs
Dynamic model of engine
- Dynamic engines decompose engine behavior into individual component models that account for engine dynamics, most notably intake airflow and turbocharger dynamics.
-
Dynamic engine models are suitable for designing control, estimator, and diagnostic algorithms that depend on dynamic subsystem states, for example, in closed-loop AFR control algorithm development.
-
We can switch between engine model types based on your application.
To open EV model present in matlab type "autoblkEvStart"in worspace.
Inside the EvReferenceApplication/Passenger Car/Electric Plant -motor is present.
Two variants are available1)Mapped model of Motor2)Dynamic model of motor.
Mapped model of Motor
1) The Mapped Motor block implements a mapped motor and drive electronics operating in torque-control mode.
The output torque tracks the torque reference demand and includes a motor-response and drive-response time constant.
Use the block for fast system-level simulations when you do not know detailed motor parameters, for example, for motor power and torque tradeoff studies.
The block assumes that the speed fluctuations due to mechanical load do not affect the motor torque tracking.
You can specify:
-
Port configuration — Input torque or speed.
-
Electrical torque range — Torque speed envelope or maximum motor power and torque.
-
Electrical loss — Single operating point, measured efficiency, or measured loss.
-
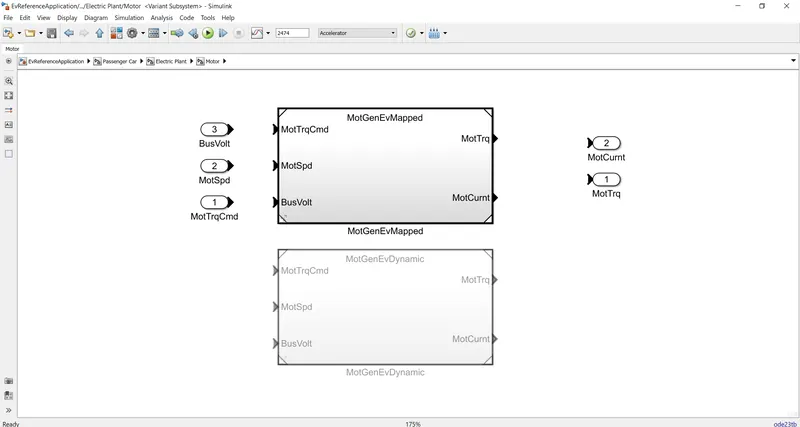
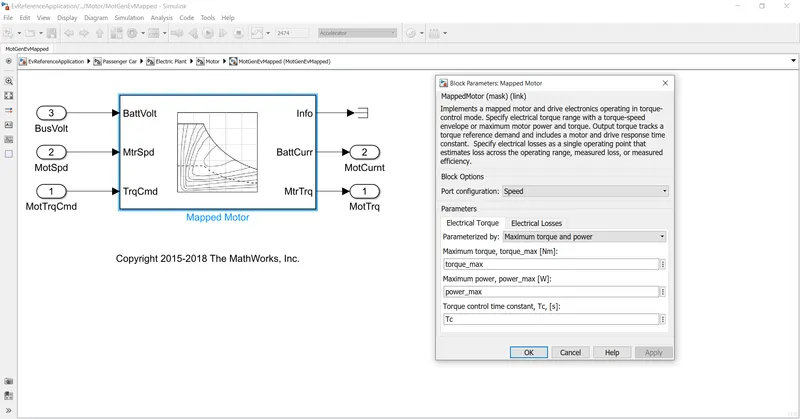
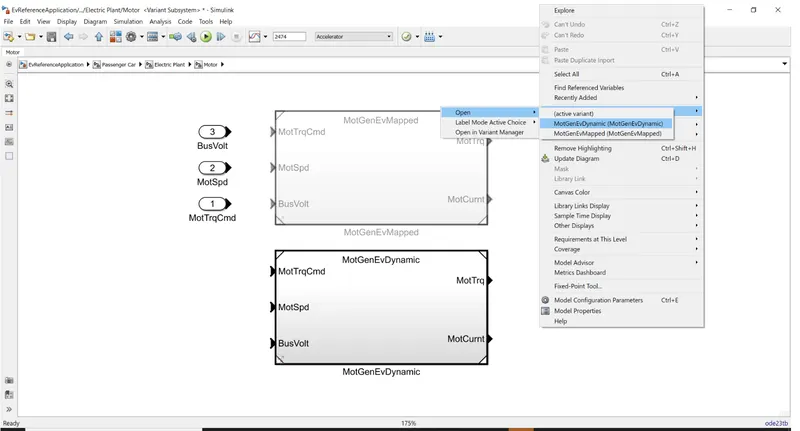
To switch between mapped /dynamaic or vice-versa select->variant->Label Mode Active choice->
MotGenEvMapped/ MotGenEvDynamic
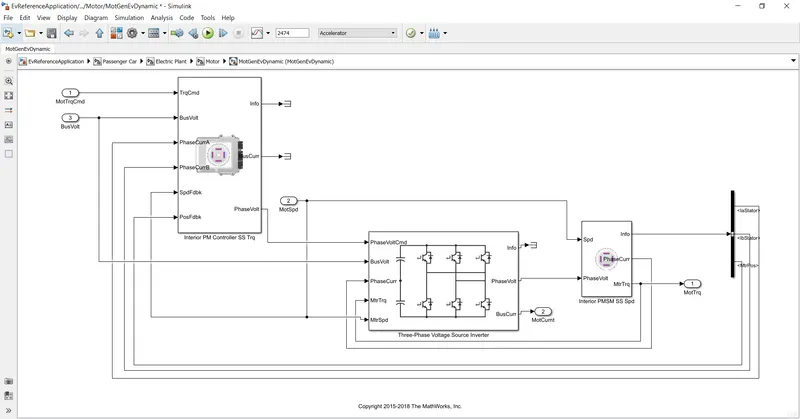
2)Dynamic model of Motor
- It consist of Interior permanent magnet synchronous motor (PMSM) with controller.
- It involves real time output from all subsystem to simulate.
- It is slow to simulate compared to mapped model.
- It makes use of actual model with results of high accuracy.
2.How does the model calculate miles per gallon? Which factors are considered to model fuel flow?
Open the reference EV model presented in matlab:
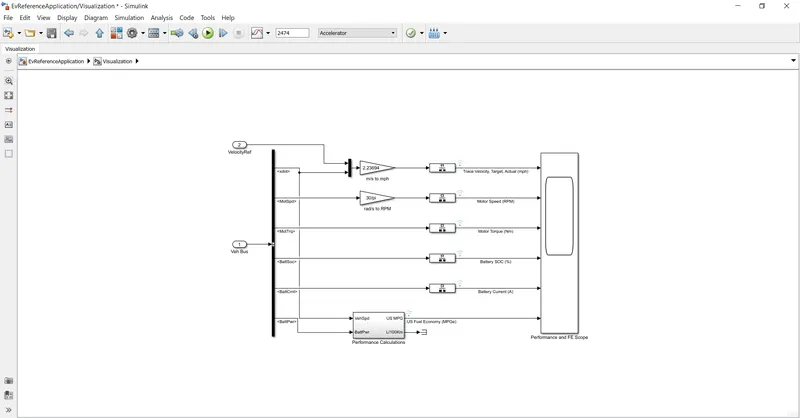
Visualization blockset:
Displays vehicle-level performance, battery state of charge (SOC), and equivalent fuel economy results that are useful for powertrain matching and component selection analysis.
Performance calculations:
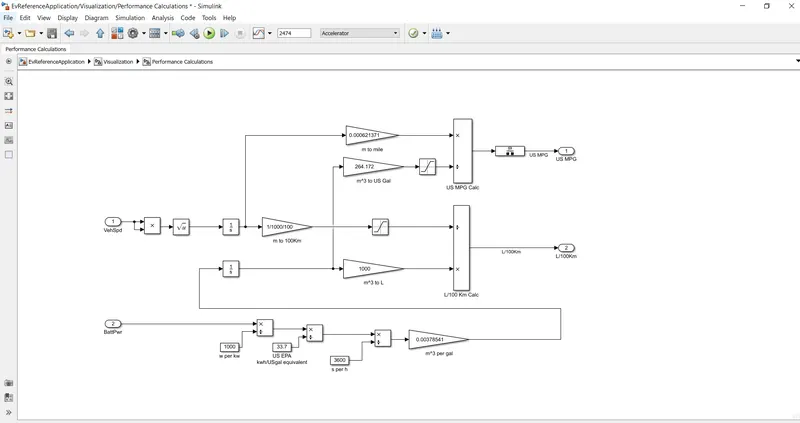
Factors considered to model fuel flow:
- Vehicle speed
- Battery level
Vehicle spped is converted to KM/Miles by integrating distance covered in meters.
The battery power in Watt is converted into m^3 per gal ,it is integrated and converted to US gallon and litre.
The US gal val is then converted to US MPG by dividing it with distance in miles.
Note:Cubic meter to gallons Formula
Formula of Cubic meter to gallons , is 1 cubic meter is equivalent to 264.172 gallon. To calculate just use formula 264.172 gallon * cubic meter.The equation is simple. Alternatively it can be reverse to get gallon to cubic meter .
gallon to cubic meter Formula
gallon to cubic meter=cubic meter x 264.172
3Run the HEV ReferenceApplication with WOT drive cycle. Change the grade and wind velocity in the environment block. Comment on the results.
Open the HEV reference model present.
Step1: Change the drive cycle source to WOT(WideOpen Throttle)
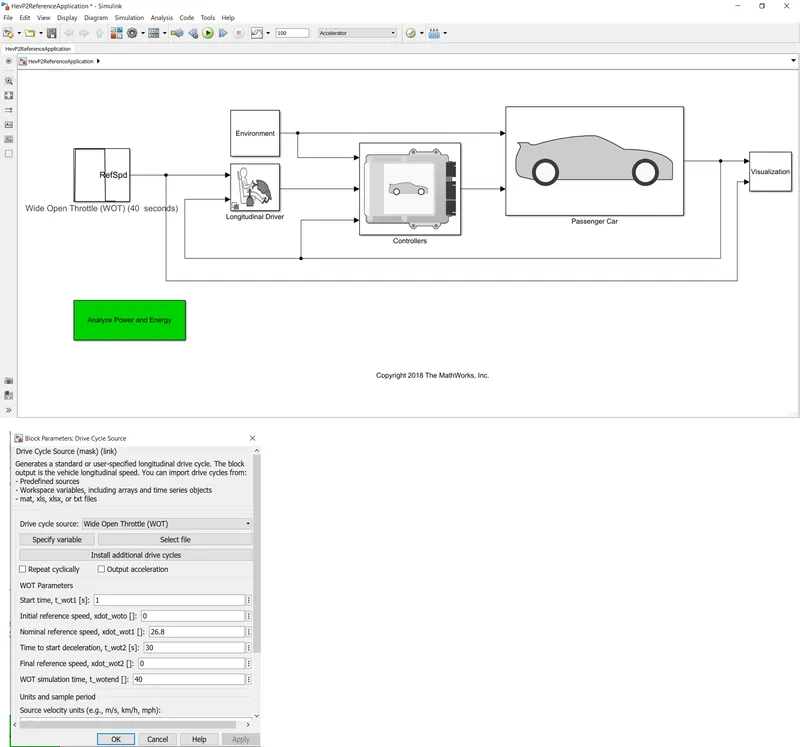
Simulation results:
Grade and wind velocity in the environment block remains unchanged.
Step2: Run the simulation with cycle time for 100 second
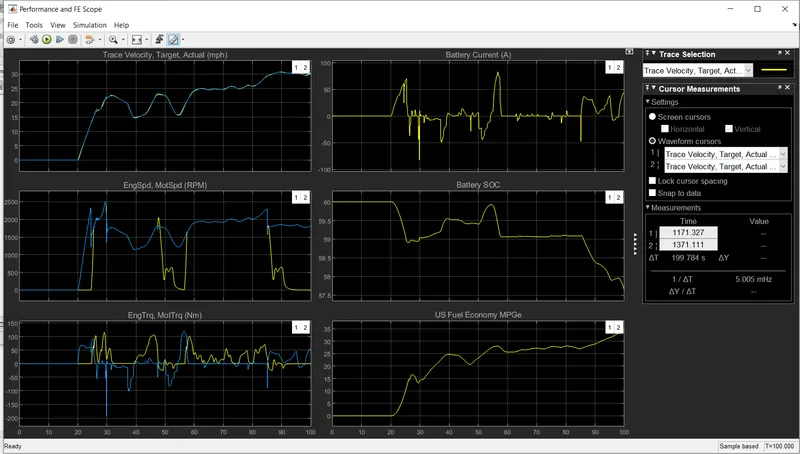
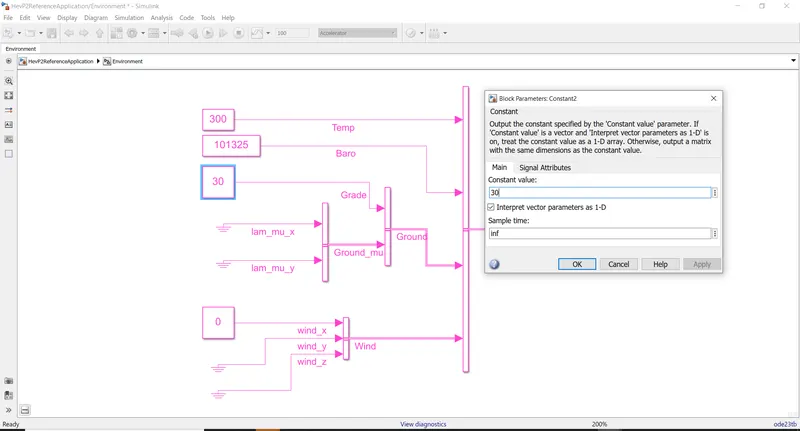
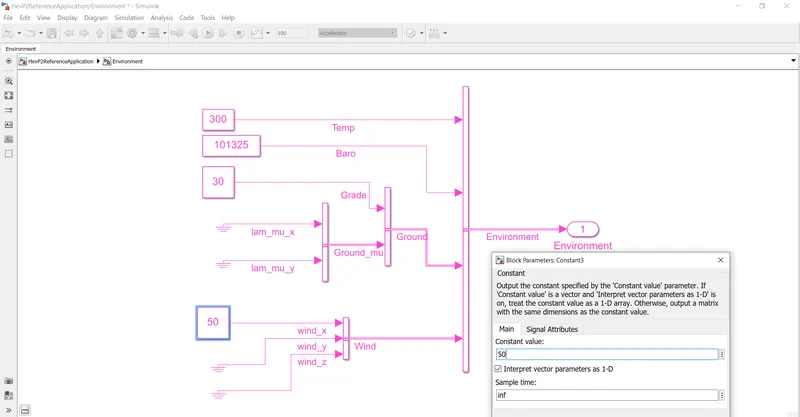
Step3: Change the Grade and Wind in the environment block set.
Set grade->30
Set Wind->50
Run the simulation.
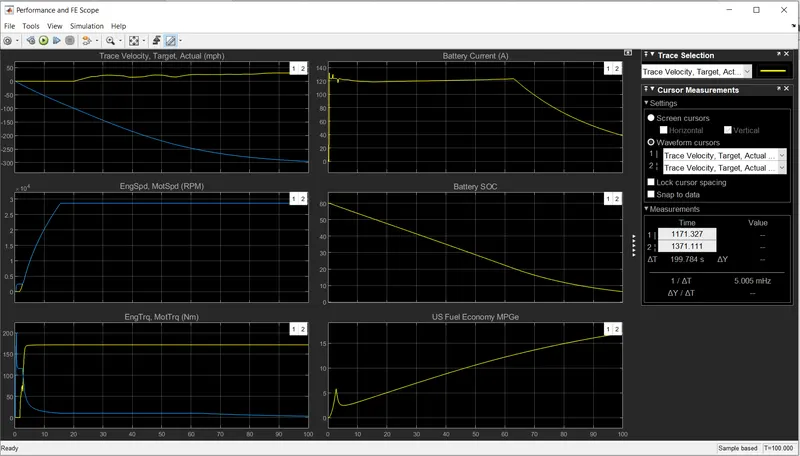
- Plot 1 (Trace Velocity Target vs Actual) - It is infered that as the grade and the wind velocity of HEV Vehicle is increased compared
to the normal state the vehicle is not able to reach the target velocity. - Plot 2 (Engine Speed, Motor Speed) rpm - In this plot comparing with the normal plot the Engine Speed has reduced to a steep slope on the negative side as compared to the normal situation the grade is increasing the load on the engine and thus the targeted Engine Speed is not met.
- Plot 3 (Engine Torque, Motor Torq ue, Generator Torque) Nm - There are multiple variations in all these aspects and the same is visible in both the results of Normal and with the Grade and Wind Velocity.
- Plot 4 (Battery Current) A - Battery current has been fluctuating at a higher range as compared to the normal after the vehicle is reaching near to the steady/stable pace the fluctuation starts and is simulated.
- Plot 5 (Battery SOC) - The Battery State of Charge remains more or less similar in both the cases and are resulted at 65% after the end of the WOT Cycle.
- Plot 6 (US Fuel Economy) MPGe - The average fuel economy is more or less same in both cases.
Conclusion:
From this it is clear that vehicle with low gradeabity and wind speed provide High fuel efficiency,can reach desired speed level to cover target distance and better batter efficiency
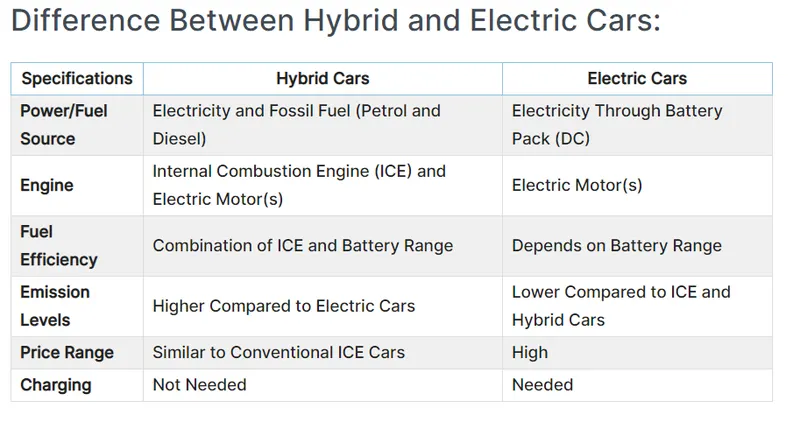
4.Keeping all other parameters same, compare the simulated results of hybrid and pure electric powertrains.
HEV vehicle vs EV vehicle
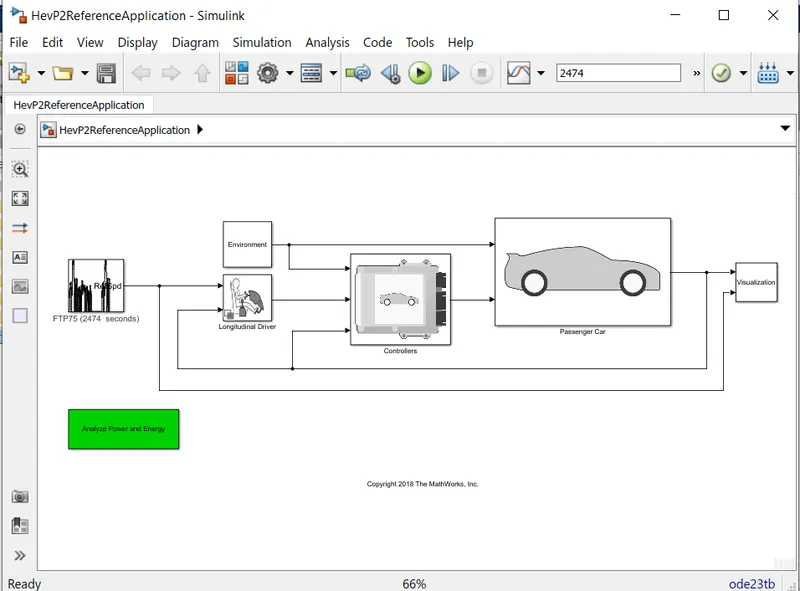
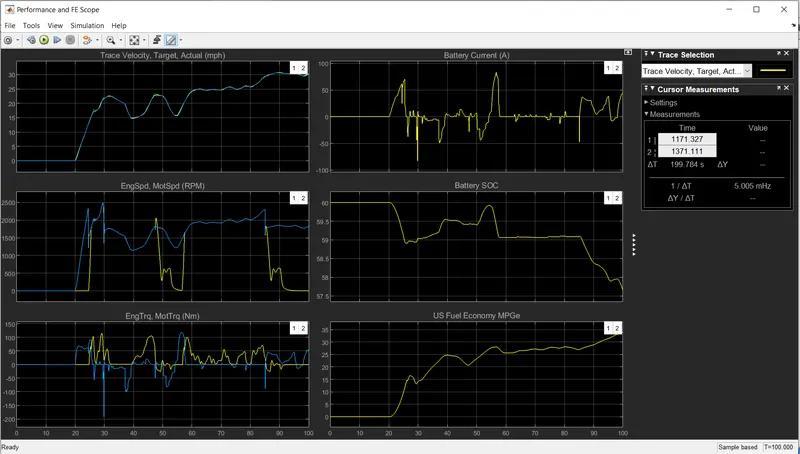
HEV model simulation results:
Step1: Type " autoblkHevP2Start" in matlab worspace to open the HEV model.Run the model with T=100.00
Simulation results:
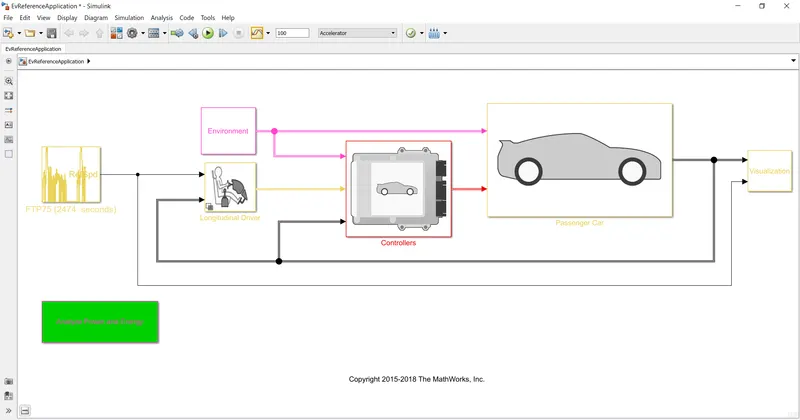
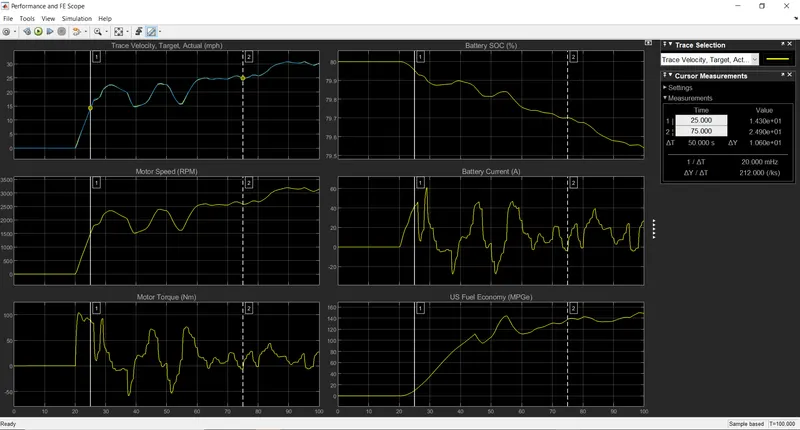
EV model simulation results:
Step1: Type "autoblkEvStart" in matlab worspace to open the EV model.Run the model with T=100.00
Simulation results:
Observation:
- Motor torque and motor speed are stable in EV and they keep fluctuating a lot in HEV during the starting.
- The peak RPM of the motor in EV is less than HEV.These differences can be attributed to the fact that the battery power of EV is more than HEV.
- The fueleconomy of EV is significantly greater than HEV.This is because an electric motor is more efficient than an engine.
- It is notified that top speed in EV is less because of the higher power demand required for the vehicle with greater grade and wind velocity value is better supplied by the HEV than its EV counterpart.
- Target and actual velocity graph performance is almost the same. the reason is the fact that in that particular region only motor was operating so the performance in both EV and HEV is simiar.
Result:
The following results are achieved.
- Difference between mapped and dynamic model of engine, motor and generator is explained.
- The model calculating miles per gallon is studied and factors to model fuel flow is identified.
- To Run the HEV ReferenceApplication with WOT drive cycle by Changing the grade and wind velocity in the environment block. Comment on the results are provided.
- Keeping all other parameters same, hybrid and pure electric powertrains simulated results are compared.