Week-4 Challenge WOT Condition Part-2
1.
| Mapped | Dynamic | |
| Engine, motor, and generator |
|
|
2.
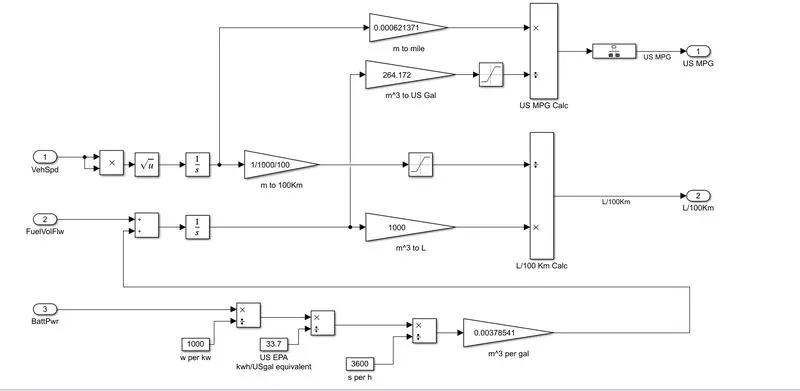
calculation of miles per gallon.

- battery power is converted from watts to kilowatts by dividing it by 1000.
- it's divided by 33.7(US EPA i.e kWh/US gallon equivalent) this is a universal kind for measuring the HEV and EV mileage by using this calculation we can compare the battery-run vehicles with fuel-run vehicles by using the above calculation.
- followed by a division of 3600 where it is converted into hours from seconds.
- The Gain block multiplies the input by a constant value (gain). The input and the gain can each be a scalar, vector, or matrix. here it is multiplied with the number 0.00378541 to convert it to per gallon value
- fuel flow is added with the battery output and given to the integrator block.
- and it multiplied with 1000 to convert from ml to L
- and also it is given to gain multiplier to multiply it with 264.172 to convert into US gallon and it is given to the saturation block where it gives lower limit and higher limit depending on the input fed.
- vehicle speed output is integrated and it is converted from meters to KM and again using gain block it is converted into miles by multiplying with 0.000621371.
factors considered:
- vehicle speed
- battery power
- fuel volume flow
3.
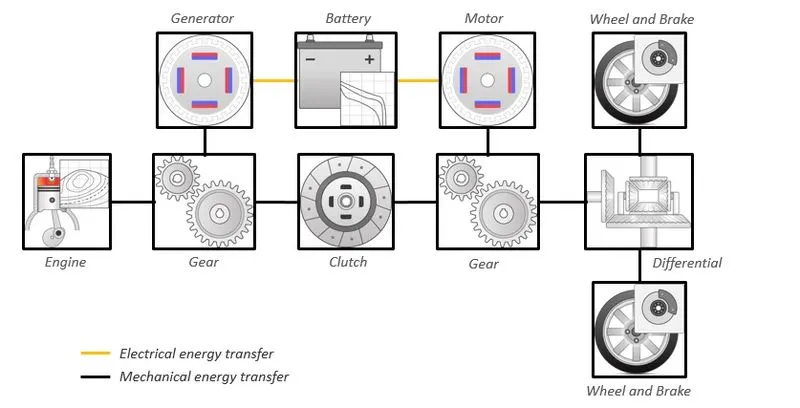
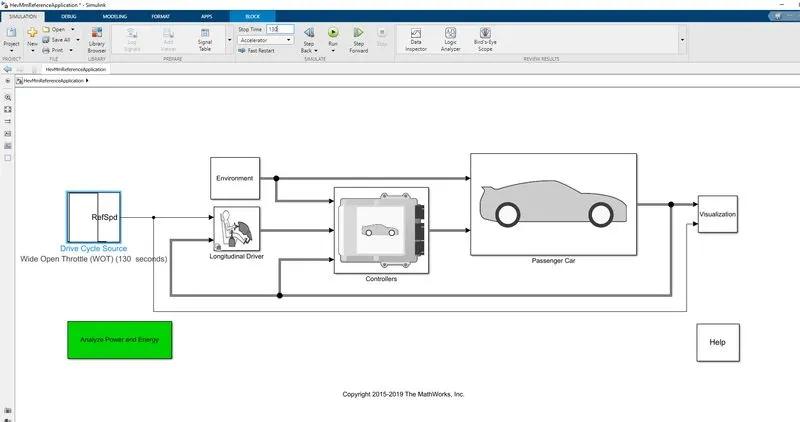
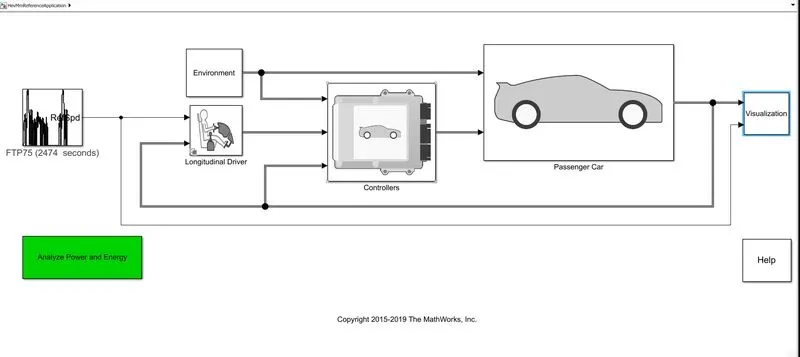
running the model in WOT
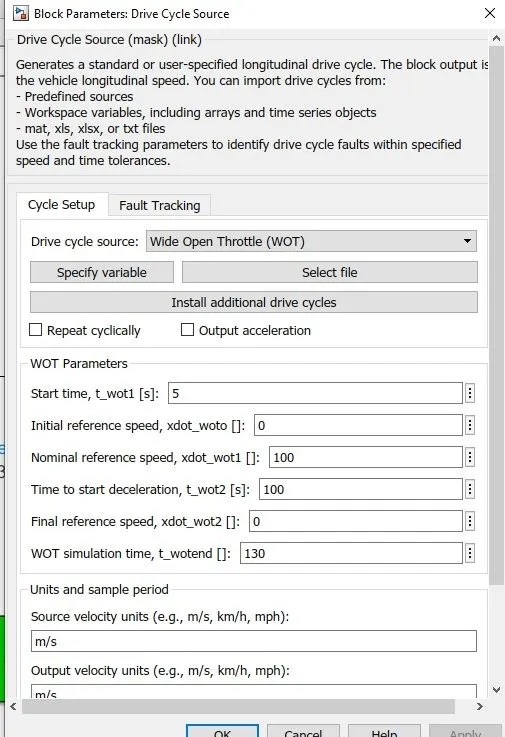
- double click on the drive cycle source then a window appears to change the values as shown above to run the above simulation
observation:
before changing the environment parameters
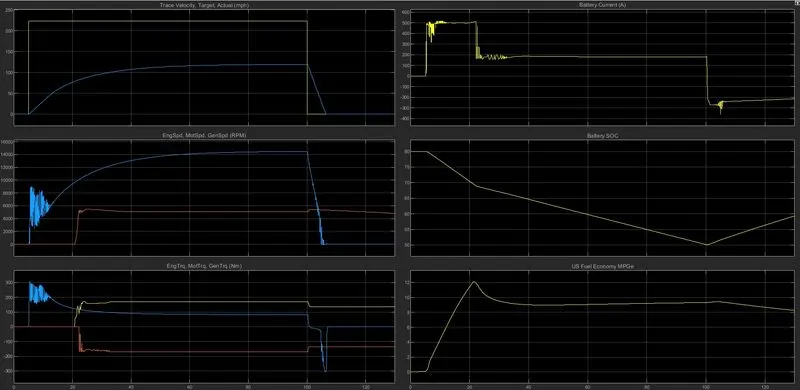
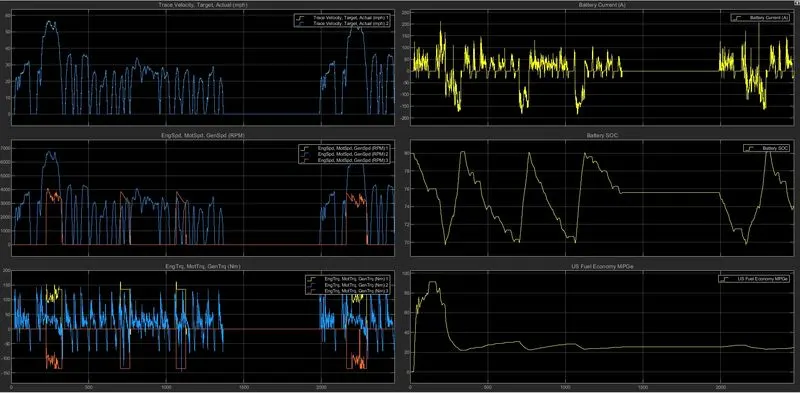
- graph-1: shows the trace and target velocity of the vehicle. where the trace is the designed velocity and target/actual is model velocity.
- graph-2: shows the engine, motor, and generator speed. you can observe from the plot that the motor speed is initially high indicating initial energy is supplied by the motor and it starts to increase and gets saturated at nominal reference speed. and also after some time initially since the model is in WOT condition after some reference speed around 60mph engine starts to run supplying power both to transmission and also to the battery through the generator. and hence even the generator speed is also shown and at the time deceleration motor speed decrease drastically and generator speed is slightly increased.
- graph-3: shows engine, motor, and generator torque. the above explanation applies the same to the torque also but it is interesting to observe that the motor torque tends to negative indicating its acting as a regenerative braking system.
- graph-4: battery current shows the amount of current drawn initially when the only motor is running you can observe there 500A of current is drawn and after some time when the engine starts to rin its discharge is reduced. and finally, at braking the current flow is negative indicating the model is charging the battery.
- graph-5: battery SOC indicates the amount of charge present in the battery.
- graph-6: US fuel economy MPGe shows at a particular instant of time how is the mileage of the model.
changing the parameters of the environment.
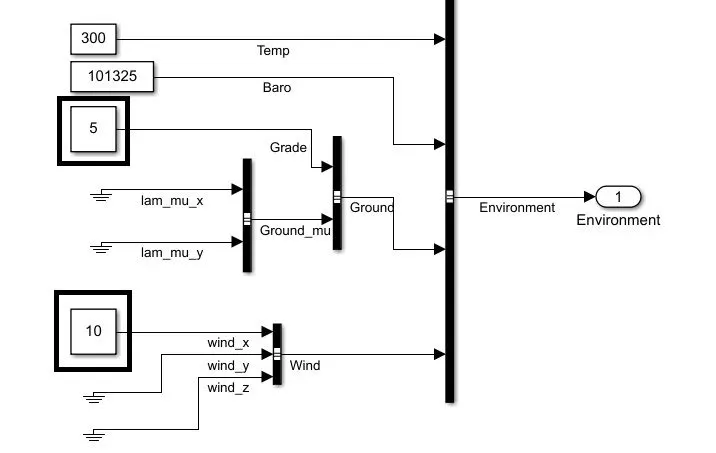
- go to environment blockset and change the values of grade and wind velocity.
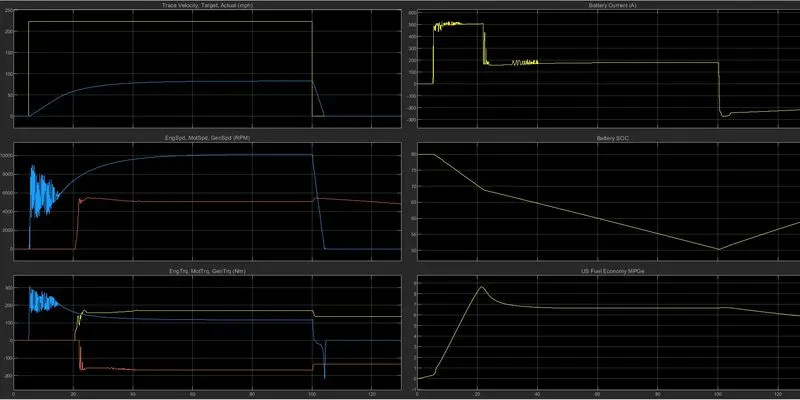
- from the above graph, you can observe that the mileage is decreased.
- and also the speed which we expected is not reached due to the uphill and air dynamic force which is opposite to the motion.
- also reverse flow of current is not that high because when braking there is also supportive force from wind and gravity due to uphill and hence complete energy is not transferred to the battery.
4.
EV model
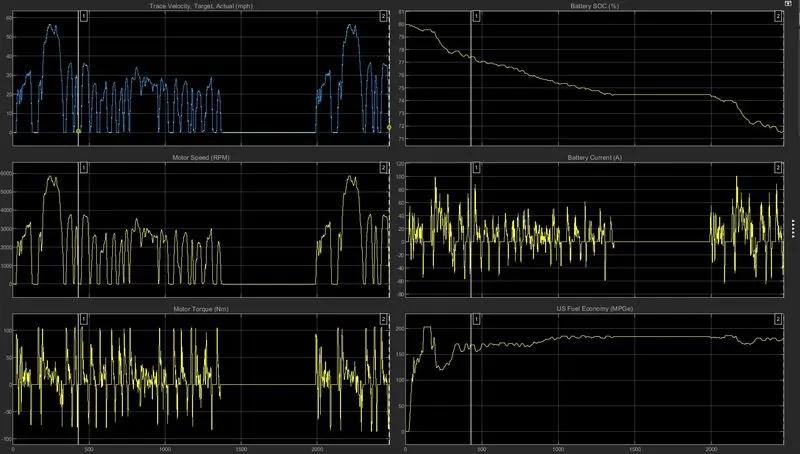
HEV model
results:
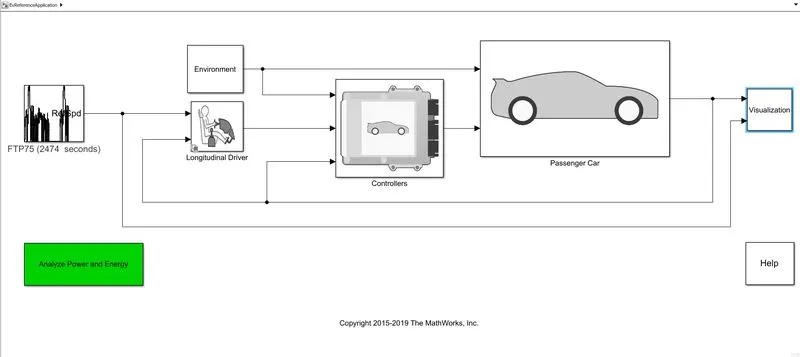
- from the plots we can observe torque and speed remains the same but there is a change in battery current and SOC ann also US fuel economy/mileage.
- in the case of EV, the battery is not charged i.e is the SOC(state of charge) is not increased even when the model is decelerating it remains constant but in the case of HEV, due to the energy supplied by the engine generator turns on and energy is supplied to the battery, when the battery is charged to given peak level it starts to discharge by giving more load to the motor than the engine and the process continues.
- when compare the mileage between them EV is performing very well in case of this because electric motors are efficient compared to IC engine even in HEV model regenerative braking is there but its mileage is very less because generation of electricity is more efficient compared to the generation of mechanical energy from an IC engine.