Week-4 Challenge WOT Condition Part-2
Week-4 Challenge WOT Condition Part-2
AIM 1: To table the difference between mapped and dynamic models of engine, motor, and generator and also the methods to change the model type.
ANS: When you customize an application, we can either use mapped or dynamic models for engines, generators, and motors.
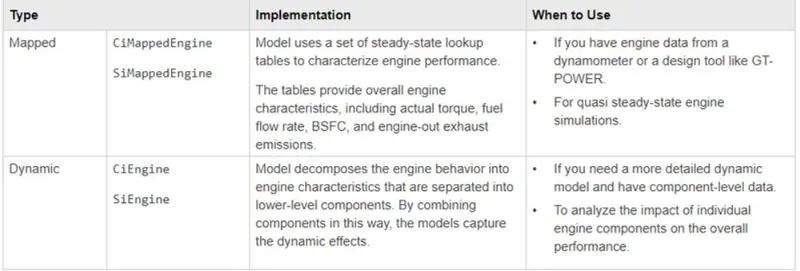
MAPPED:
- This model utilizes look-up tables to simulate vehicle characteristics.
- They are utilized when detailed component monitoring is not required
- They are faster to simulate
- It works on a larger or a macro level, which uses general performance characteristics to achieve an approximate result of the vehicle.
DYNAMIC:
- They use runtime data or real-time data to calculate vehicle characteristics.
- They work on a micro-level, where individual components are analyzed and give the performance as a whole.
- They are used when the components have to be studied individually
- They take a much longer time to simulate
MAPPED ENGINE
1. Mapped SI engine
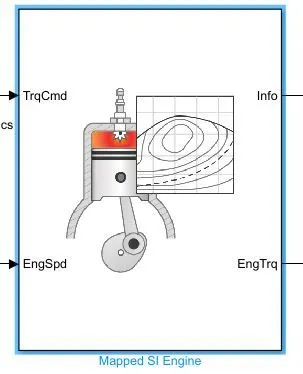
The mapped SI engine block implements a mapped SI engine model using power, air mass flow, fuel flow, exhaust temperature, efficiency, and emission performance lookup tables.
The block enables you to specify lookup tables for these engine characteristics. The lookup tables, developed with the Model-Based Calibration Toolbox™, are functions of commanded torque, Tcmd, brake torque, Tbrake, and engine speed, N. If you select Input engine temperature, the tables are also a function of engine temperature, TempEng.
2. Mapped CI engine
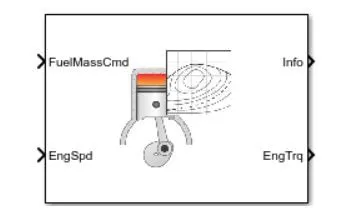
The mapped CI engine block implements a mapped CI engine model using power, air mass flow, fuel flow, exhaust temperature, efficiency, and emission performance lookup tables.
The look-up table developed is a function of injected fuel mass, engine speed, and engine torque.
3. Mapped Motor
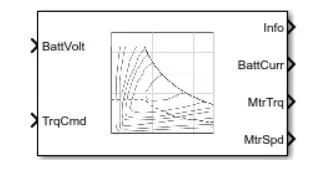
The Mapped Motor block implements a mapped motor and drives electronics operating in torque control mode. The output torque tracks the torque reference demand and includes a motor-response and drive-response time constant. Use the block for fast system-level simulations when you do not know detailed motor parameters, for example, for motor power and torque tradeoff studies. The block assumes that the speed fluctuations due to mechanical load do not affect the motor torque tracking.
DYNAMIC MODEL
MOTOR
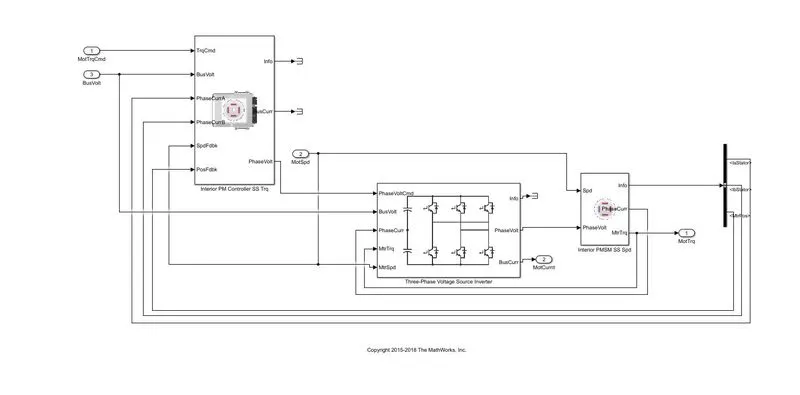
CHANGING THE MODEL TYPE
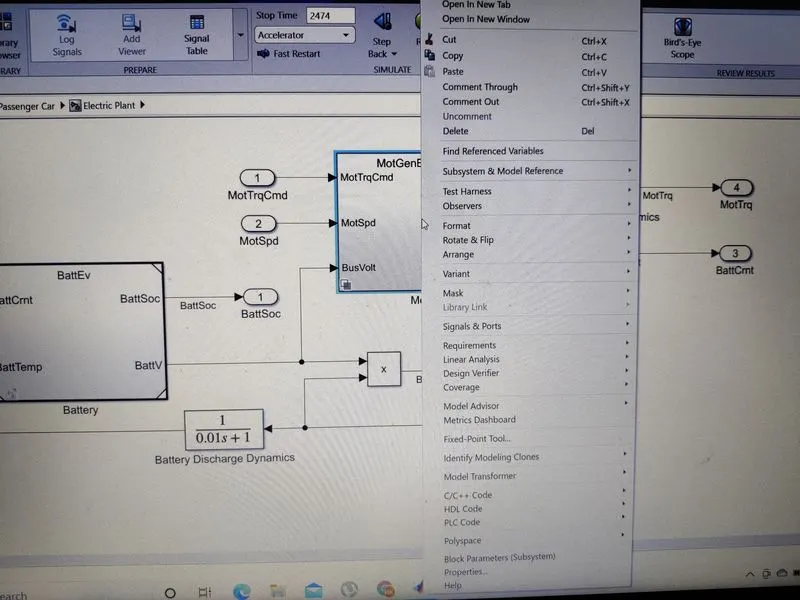
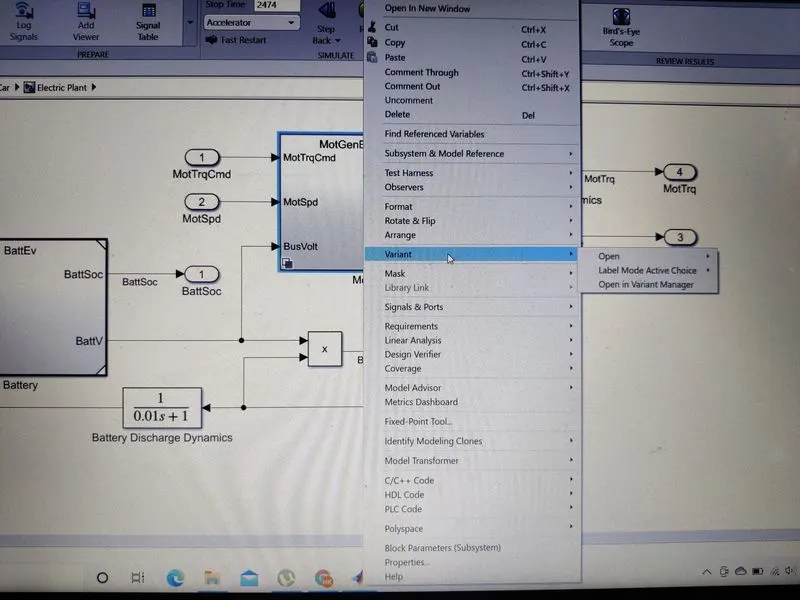
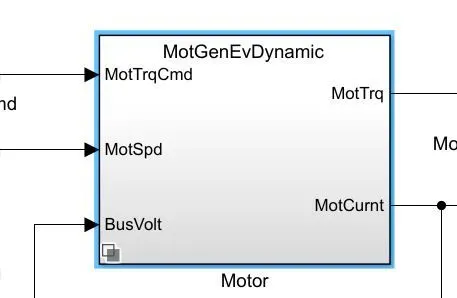
- In order to change the model from mapped to dynamic or vice versa, right-click on the model
- Click on Variant--->Label mode active choice---->select dynamic mapped
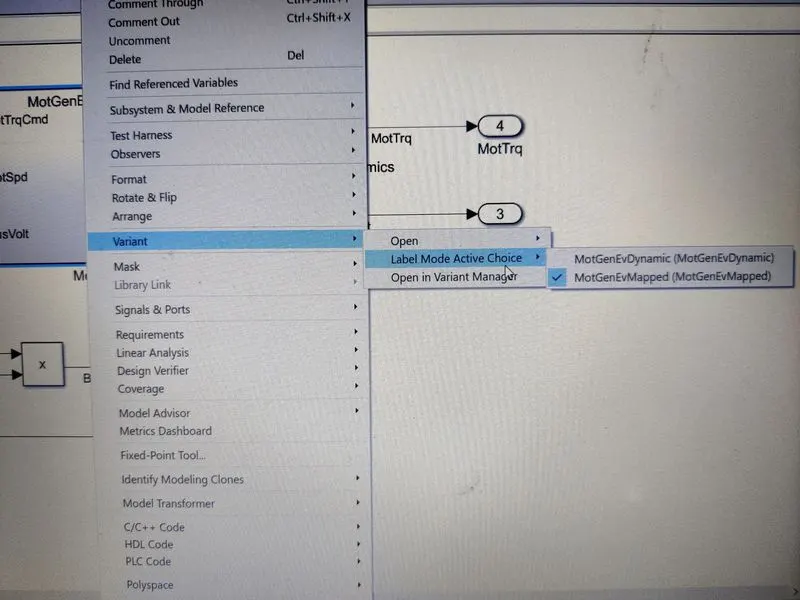
Once converted, it looks like this:
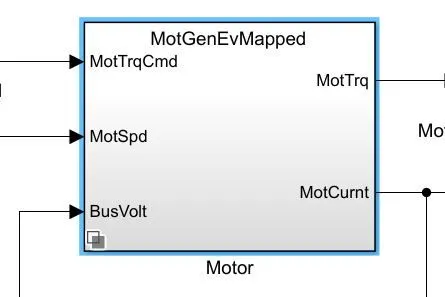 <---------->
------------------------------------------------------------------------------------------------------------------------------
AIM 2:How does the model calculate miles per gallon? Which factors are considered to model fuel flow?
ANS: Miles per gallon: It is a fuel economy rating determined by how far a vehicle can travel with one gallon of gasoline/ diesel. In the case of an electric vehicle, it is how much electricity is consumed by the battery pack to travel a fixed distance.
One gallon produces 121.3 MJ of electricity. The corresponding gallon equivalent of electricity is 33.7kwh. So if an EV can travel 80 miles with a consumption of 33.7 Kwh, then the rated MpGe of the vehicle is 80.
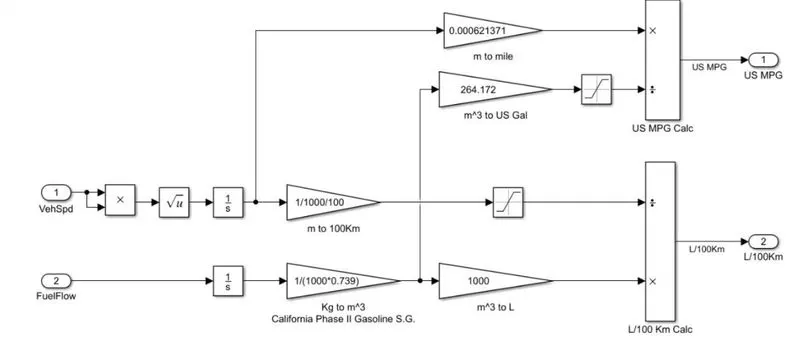
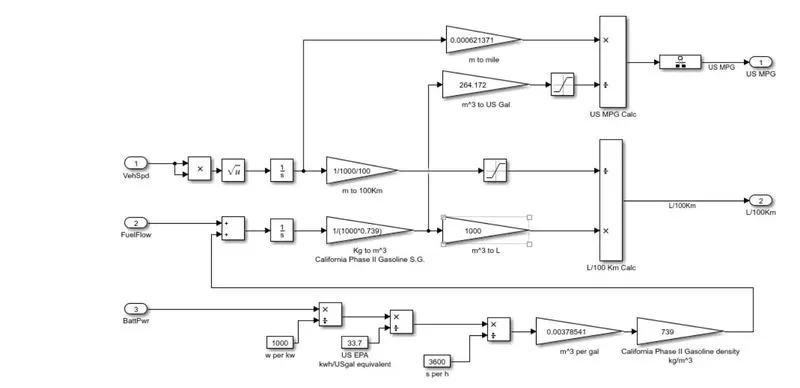
the calculation blockset for different vehicle system is given below:
1. For a conventional IC engine
2. For a Hybrid Electric Vehicle
3. For a complete EV
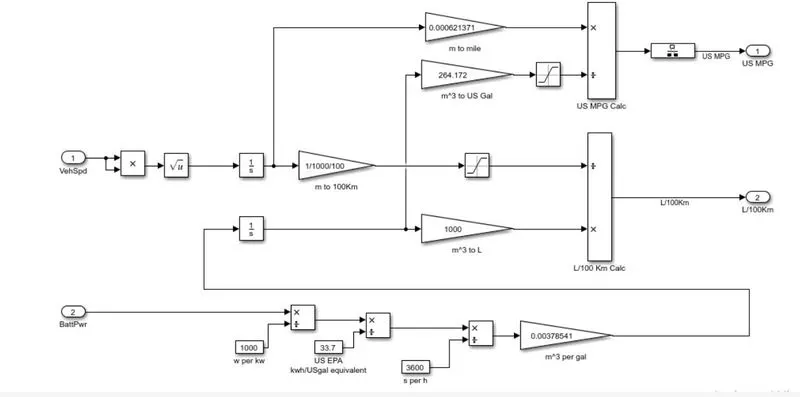
In the model, the fuel consumption is calculated in miles per gallon. The calculation is shown below:
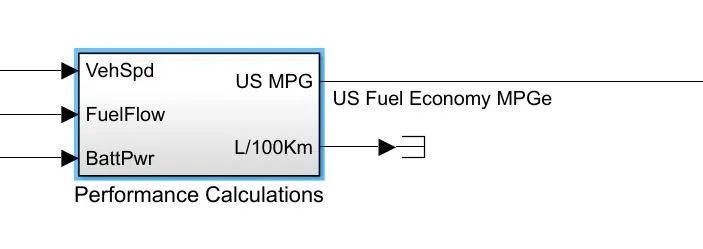
In the performance calculation block three parameters are taken into consideration while calculating miles per gallon:
- vehicle speed
- fuel flow
- battery power
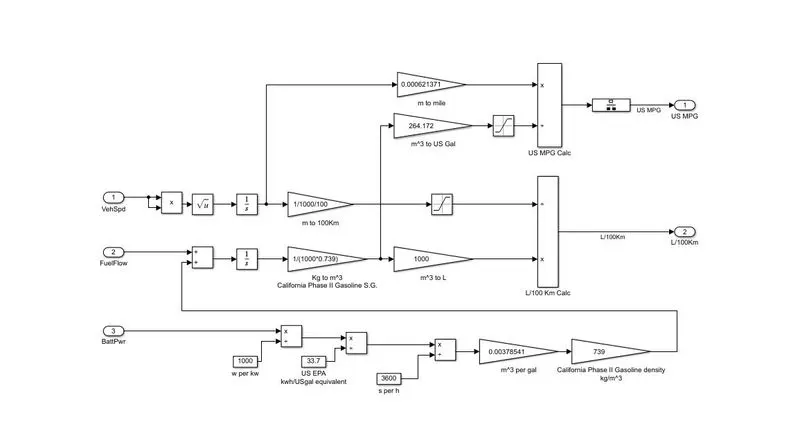
BATTERY POWER
- The power from the battery is converted from watt-hour(w-h) to Kilowatt-hour(kW-h).
- Since 33.7 Kwh is is the energy equivalent of burning one gallon of gas, the value is divided by 33.7 .
- The value is further divided by 3600 to convert to sec. So (US gallon /sec).
- Since 1US gallon is 0.00378541 m^3,the current value is divided by 0.00378541 to obtain the value in m^3/s.
- Now, California's phase II Gasoline density is 739 kg/m^3. (m^3/s *kg/m^3) will give the values in kg/sec, which is the mass flow rate of the fuel.
FUEL FLOW
- The fuel flow and the equivalent fuel flow from the battery is added.
- What we have is the instantaneous fuel flow. The integrator block is used to get the value in kg, that is the total fuel flow.
- Now, it is further converted to m^3( California phase II Gasoline SG).
VEHICLE SPEED
- The instantaneous vehicle speed is integrated using the integrator block to get the total distance in meters
- The value is converted to miles.
- And finally, the value of the miles is divided by the total fuel flow to get the final output.
-----------------------------------------------------------------------------------------------------------------------------------
AIM 3: Run the HEV ReferenceApplication with WOT drive cycle. Change the grade and wind velocity in the environment block. Comment on the results.
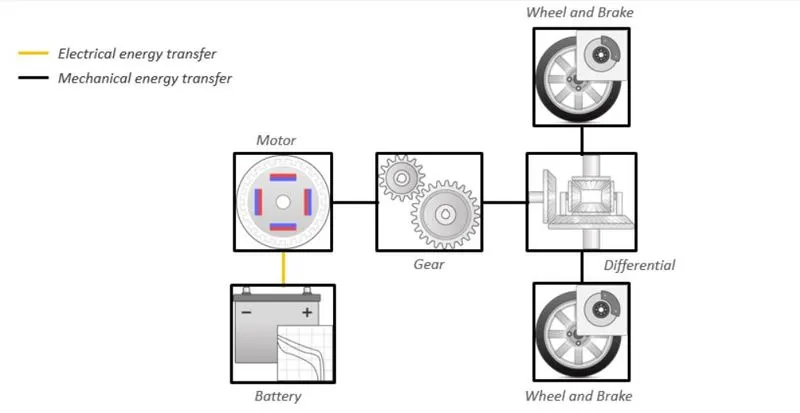
ANS: The electric vehicle reference application represents a fully electric vehicle model with a motor-generator, battery, direct-drive transmission, and associated powertrain control algorithms.
The powertrain configuration diagram is given below:
The model is given below:
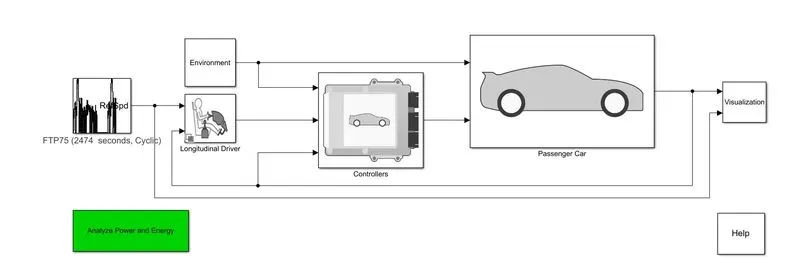
Descriptions of the block and sub-systems
1. Environment: Creates environment variables, including road grade, wind velocity, and atmospheric temperature and pressure.
2.Longitudinal driver: Uses the Longitudinal Driver or Open Loop variant to generate normalized acceleration and braking commands.
The longitudinal Driver variant implements a driver model that uses vehicle target and reference velocities.
Open Loop variant allows you to configure the acceleration, deceleration, gear, and clutch commands with constant or signal-based inputs.
3.FTP75:Generates a standard or user-specified drive cycle velocity versus time profile. Block output is the selected or specified vehicle longitudinal speed.
4.Controller: Implements a powertrain control module (PCM) containing an input power-split hybrid control module (HCM) and an engine control module (ECM).
5.Passenger Car: implements a hybrid passenger car that contains drivetrain, electric plant, and engine subsystems.
In order to change the drive cycle source, click the drive cycle block and change the drive cycle source to WOT
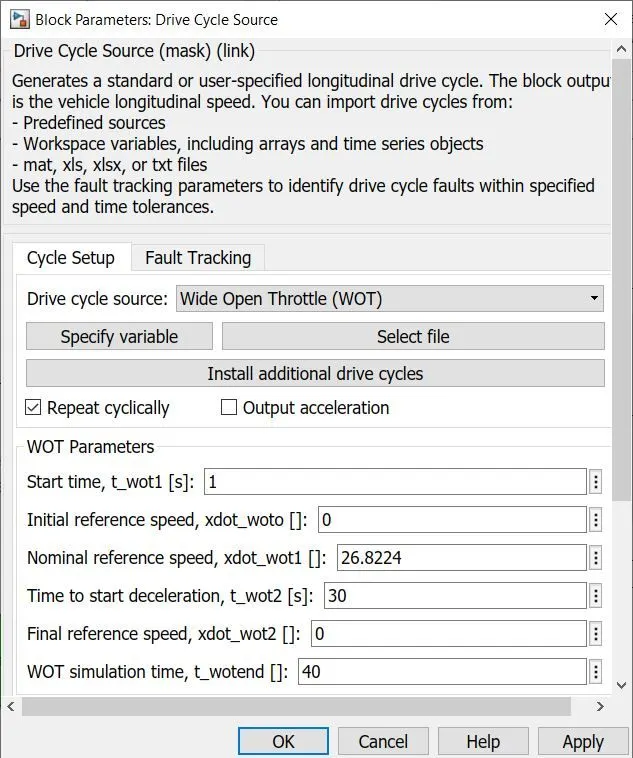
RESULTS
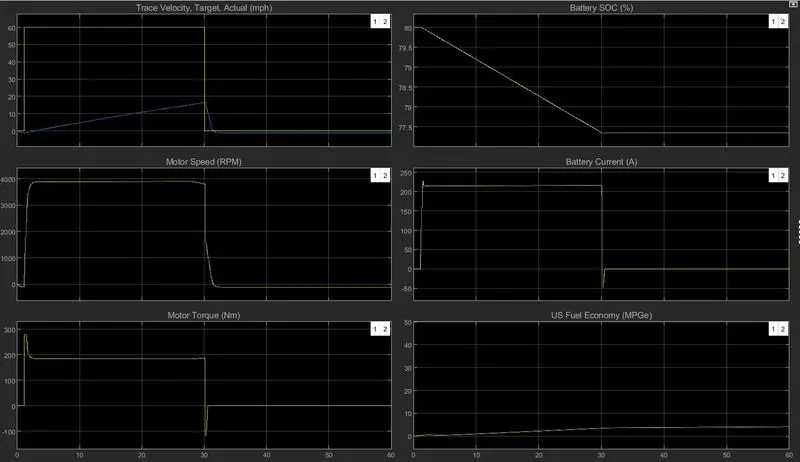
The above graph is for a simulation time of 60 sec
Wind Speed is 10m/s
Gradeability is 15%
Drive Cycle: WOT( wide open throttle)
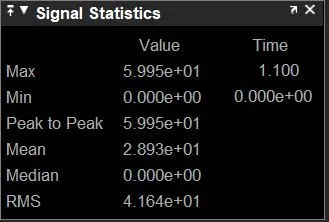
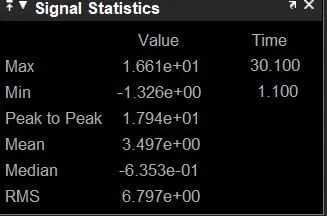
- PLOT 1: It can be seen that actual velocity and target velocity are completely different. The target velocity is around 60 km/hr whereas the achieved velocity is around 17. This is because the maximum current it can provide is 220 Ampere. So if we can increase the size of the battery pack or also the capacity of the battery pack, then we can obtain a faster acceleration. When the current is going negative, the vehicle is decelerating. Signal Statistics for Target and Act Velo:
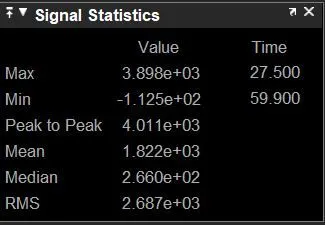
- PLOT 2: Motor speed reaches a value of 3890in WOT condition.
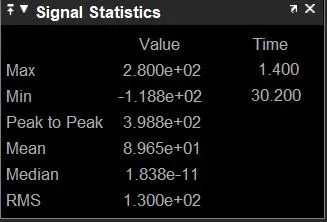
- PLOT 3: The maximum value of motor torque is 370 , the value then reaches negative when the vehicle decelerates.
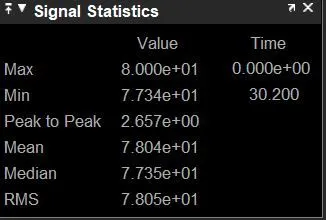
- PLOT 4: With the initial acceleration in the WOT condition, there is a drastic reduction in the SOC to 77.5, later after the value remains constant.
- The current and Fuel economy details are given below( PLOT 5 and PLOT 6)
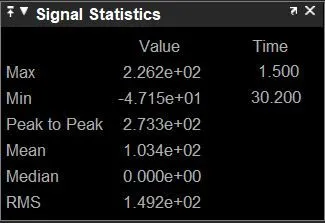
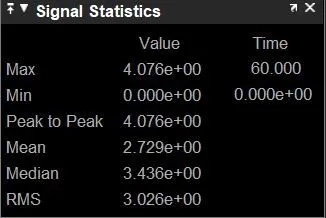
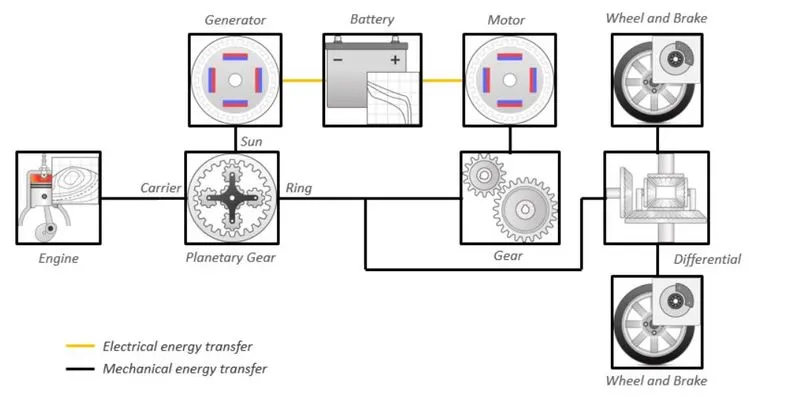
Now, the same simulation is conducted for a hybrid model. The powertrain configuration is given below:
RESULTS
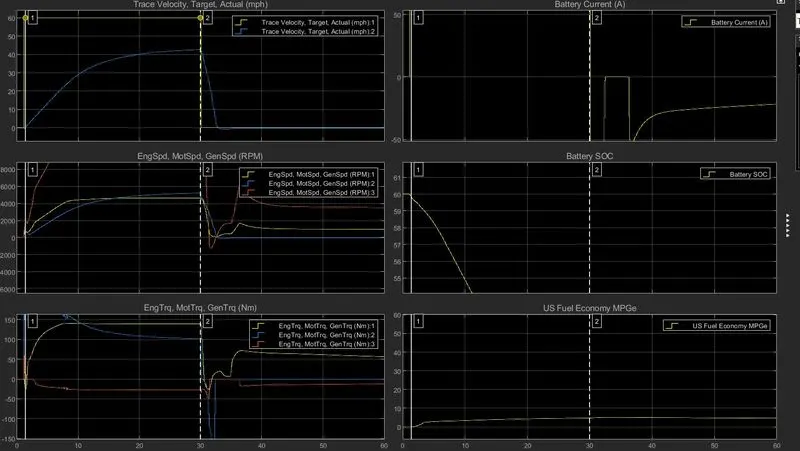
- Plot 1: The target speed and the actual speed are different. This is again due to a lack of current supply. Increasing the battery capacitance or the size of the battery pack will fix this.
- Plot 2: Top generator RPM is above 8000 and the top engine rpm is around 4500.
- Plot 3: It can be seen that motor torque is reaching a highly negative value when there is deceleration wherease engine and generator torques are not highly negative.
CONCLUSION
Comparing both EV and HEV, we can find that:
- The top speed achieved by HEV is more than that of pure EV
- The battery capacity of a pure EV is much greater than that of an HEV
- Fuel economy is almost similar for both
-------------------------------------------------------------------------------------------------------------------------------------