Project 1 - Parsing NASA thermodynamic data
PROJECT REPORT
AIM: Write a Matlab program that obtains the 14 coefficients from the NASA data and calculate enthalpy, entropy, and specific heat. Also, calculate the molecular weight of each species.
OBJECTIVE:
- To create a Matlab code and obtain the entropy, enthalpy, and specific heat values
- display the graphs of all the three
- Calculate the molecular weights of all the elements
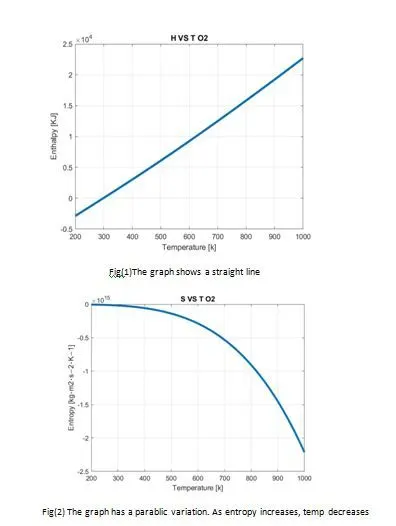
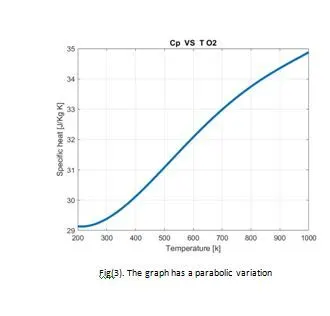
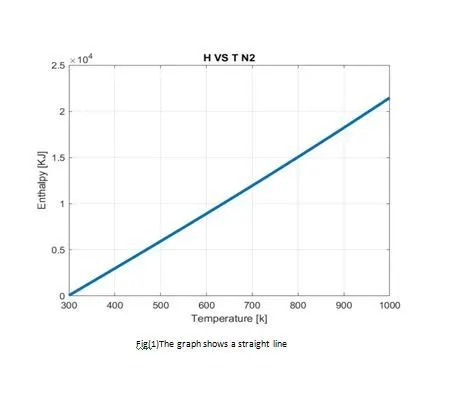
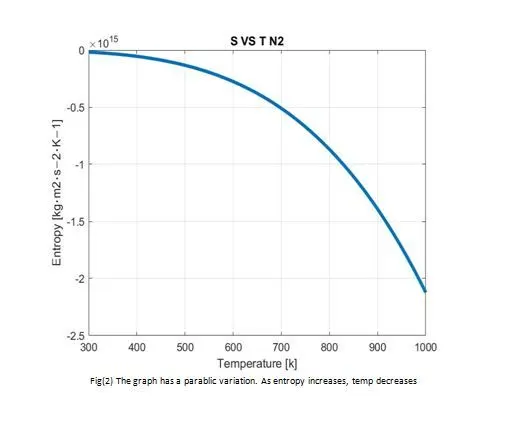
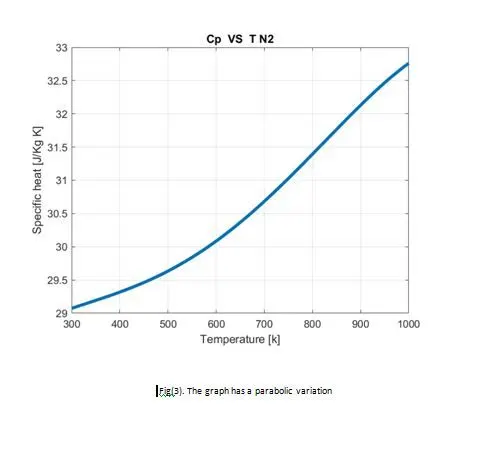
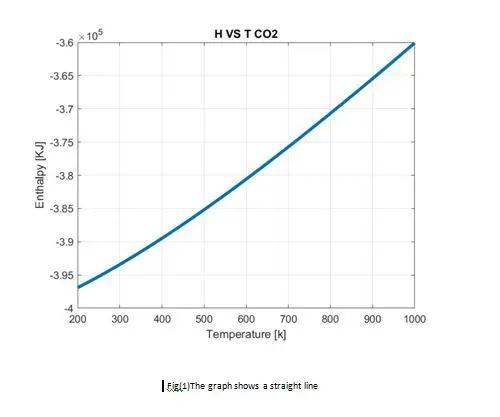
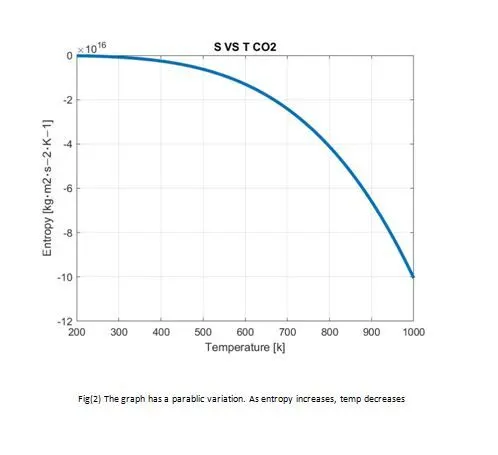
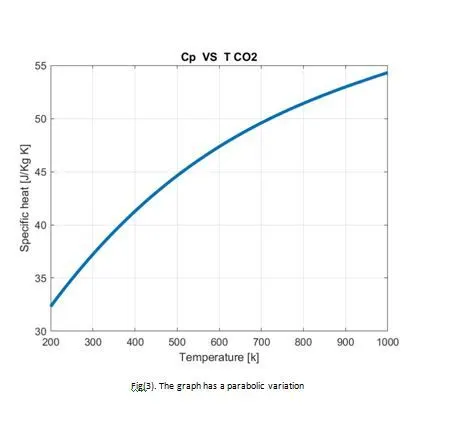
- Show plots for N2, Co2, and o2
THEORY:
Files Parsing
File parsing is the method by which how information can be read from a text file or any form of file and how that information can be used in computer programming. With the help of file parsing, one can read data from a file or write data to a file.
Commands used in a file
1.fopen: This command is used to open a file and give permission either to read from a file or write to a file.
Eg:f2=fopen('data.txt','r')
In this, we open a text file name 'data' and we give permission to read from it.
If 'w' is given instead of 'r', we give permission to write to it.
2.fprintf: This command is used to write data to a file.
Eg:fprintf(f2,'hey there')
3.fclose: This command is used to close the file once data has been added or been extracted.
Eg:fclose(f2)
4.fgetl: This command is used to go to the next line of the data from a file.
Eg:fgetl(f2)
5.fscanf: This command is used to read data from a text file.
THEORY BEHIND THE PROGRAM
Nasa came up with polynomials that can be used to evaluate some thermodynamic properties like entropy, enthalpy, and specific heat. In this program, 14 coefficients are obtained using Matlab, and these are substituted in three formulas to obtain the value for thermodynamic properties. The formulas are given below:
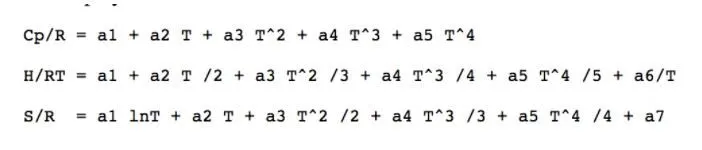
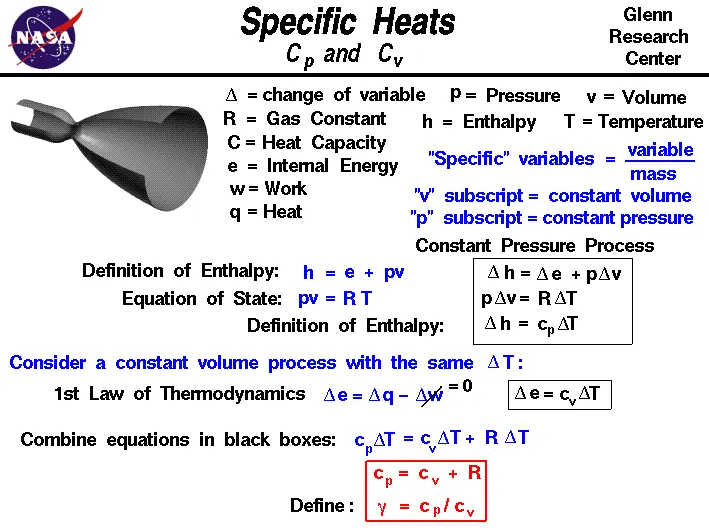
Specific heat(cp): The ratio of the quantity of heat required to raise the temperature of a body one degree to that required to raise the temperature of an equal mass of water one degree. The term is also used in a narrower sense to mean the amount of heat, in calories, required to raise the temperature of one gram of a substance by one Celsius degree.
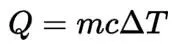
here, Q=heat energy, m=mass, c=specific heat capacity, T=temperature difference
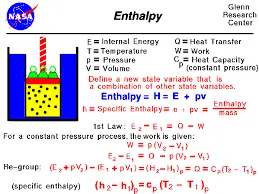
Enthalpy(H): the sum of the internal energy and the product of the pressure and volume of a thermodynamic system. Enthalpy is an energy-like property or state function—it has the dimensions of energy (and is thus measured in units of joules or ergs), and its value is determined entirely by the temperature, pressure, and composition of the system and not by its history.
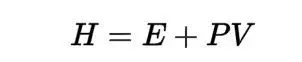
here, H=enthalpy, E=internal energy, P=pressure, V=volume
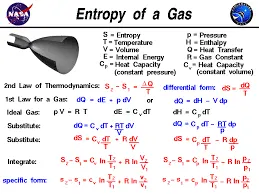
Entropy(S): the measure of a system’s thermal energy per unit temperature that is unavailable for doing useful work. Because work is obtained from ordered molecular motion, the amount of entropy is also a measure of the molecular disorder, or randomness, of a system. The concept of entropy provides deep insight into the direction of spontaneous change for many everyday phenomena.
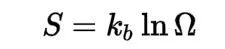
here, S=entropy, Kb = Boltzman's constant, omega is the number of natural configuration.
CODE AND EXPLANATION
clear all
close all
clc

data=fopen('THERMO.txt','r')
fgetl(data); %this is command is used to get the first line
global_temp=fgetl(data); %this sets all the temperatures to the variable global temp
T=strsplit(global_temp,' ');%this command will split the temperature


global_temp_1=str2num(T{2});%all the global temperatures have been saved into the variables
global_temp_2=str2num(T{3});
global_temp_3=str2num(T{4});

fgetl(data);%fgetl is used to print these dat in order to reach the species data
fgetl(data);%this is also avoided
fgetl(data);

 for i=1:53 %this loop is to access every line of the code
  tline=fgetl(data);
    A=strsplit(tline,' ');
    species_name=A{1};

    %extracting the temperatures


    low_temp=str2num(A{end-3});
    mid_temp=str2num(A{end-2});
    high_temp=str2num(A{end-1});

    temp_range=linspace(low_temp,high_temp,500);
    %extracting the coefficients

    coefficient=fgetl(data);
    k=findstr(coefficient,'E'); %finding the position of E

    a1=coefficient(2:k(1)+3); % coefficients in line 1
    a1=str2num(a1);
    a2=coefficient(k(1)+4:k(2)+3);
    a2=str2num(a2);
    a3=coefficient(k(2)+4:k(3)+3);
    a3=str2num(a3);
    a4=coefficient(k(3)+4:k(4)+3);
    a4=str2num(a4);
    a5=coefficient(k(4)+4:k(5)+3);
    a5=str2num(a5);

    coefficient_2=fgetl(data);
    c=findstr(coefficient_2,'E');

    a6=coefficient_2(2:c(1)+3); %coefficients in line 2
    a6=str2num(a6);
    a7=coefficient_2(c(1)+4:c(2)+3);
    a7=str2num(a7);
    a8=coefficient_2(c(2)+4:c(3)+3);
    a8=str2num(a8);
    a9=coefficient_2(c(3)+4:c(4)+3);
    a9=str2num(a9);
    a10=coefficient_2(c(4)+4:c(5)+3);
    a10=str2num(a10);

    coefficient_3=fgetl(data);
    m=findstr(coefficient_2,'E');

    a11=coefficient_3(1:m(1)+3);  %coefficients in line 2
    a11=str2num(a11);
    a12=coefficient_3(m(1)+4:m(2)+3);
    a12=str2num(a12);
    a13=coefficient_3(m(2)+4:m(3)+3);
    a13=str2num(a13);
    a14=coefficient_3(m(3)+4:m(4)+3);
    a14=str2num(a14);

 cp=specific_heat(a1,a2,a3,a4,a5,a6,a7,a8,a9,a10,a11,a12,temp_range,mid_temp)%function to calculate Cp
 mkdir(['C:\Users\user\Documents\MATLAB\PLOTS\',species_name]);
 figure(1)
 plot(temp_range,cp,'linewidth',3)
 grid on
 xlabel('Temperature [k]')
 ylabel('Specific heat [J/Kg K]')
 title(sprintf('Cp  VS  T %s',species_name));
 mkdir(['C:\Users\user\Documents\MATLAB\PLOTS\',species_name]);
 cd(['C:\Users\user\Documents\MATLAB\PLOTS\',species_name]);
 saveas(figure(1),'specific_heat.jpg');
 mkdir(['C:\Users\user\Documents\MATLAB\PLOTS\',species_name]);


 E=enthalpy(a1,a2,a3,a4,a5,a6,a7,a8,a9,a10,a11,a12,a13,a14,temp_range,mid_temp)%function to calculate enthalpy
 figure(2)
 plot(temp_range,E,'linewidth',3)
 grid on
 xlabel('Temperature [k]')
 ylabel('Enthalpy [KJ]')
 title(sprintf('H VS T %s',species_name));
 mkdir(['C:\Users\user\Documents\MATLAB\PLOTS\',species_name]);
 cd(['C:\Users\user\Documents\MATLAB\PLOTS\',species_name]);
 saveas(figure(2),'enthalpy.jpg');
 mkdir(['C:\Users\user\Documents\MATLAB\PLOTS\',species_name]);


 S=entropy(a1,a2,a3,a4,a5,a6,a7,a8,a9,a10,a11,a12,a13,a14,temp_range,mid_temp)%function to calculate entropy

 figure(3)
 plot(temp_range,S,'linewidth',3)
 grid on
 xlabel('Temperature [k]')
 ylabel('Entropy [kg⋅m2⋅s−2⋅K−1]')
 title(sprintf('S VS T %s',species_name));
 mkdir(['C:\Users\user\Documents\MATLAB\PLOTS\',species_name]);
 cd(['C:\Users\user\Documents\MATLAB\PLOTS\',species_name]);
 saveas(figure(3),'entropy.jpg');
 mkdir(['C:\Users\user\Documents\MATLAB\PLOTS\',species_name]);


 w=molecular_weight(species_name)


end
EXPLANATION OF THE CODE
- The code starts with the clear all, close all and clc
- fopen command is used to open a text file named 'THERMO'.
- fgetl command is used to go to the next line.
- This reads the global temperatures and strsplit command is used to split the line into an array.
- str2num command is used to convert the number string to numbers an it is stored in the global_temp variables.
- Since there are 53 elements, the loop is run from 1 to 53
- Inside the loop initially, the line where the species name is present is read.Strsplit command is used to split and the name of the species is assigned to a variable species_name.
- Now the local temperature values are extracted and its assigned to variables.
- The temp range is defined using the lenspace command .
- Now in order to extract the coefficient values, you find the position of the 'E' and extract the values relative to that.
- in total, there are 14 coefficients, so give the positions accordingly.
- Now , the function to calculate the Cp, H and S are written. Following function we have commands to save the plots as it is generated.
- The ploy command is used to plot the graph between temperature and H,S,Cp.
- labels are given and it is finally saved in a folder.
NOW,THE FUNCTIONS ARE MENTIONED BELOW:
1.FUNCTION FOR Cp
function [Cp]=specific_heat(a1,a2,a3,a4,a5,a6,a7,a8,a9,a10,a11,a12,temp_range,mid_temp)
    R=8.314;
   for i=1:length(temp_range)
      if(temp_range(i)>=mid_temp); %checking whether the temp is lesser or greater than the mid_tm
        Cp(i)=R*(a1+(a2*temp_range(i))+(a3*(temp_range(i)).^2)+(a4*(temp_range(i)).^3)+(a5*(temp_range(i)).^4))
      else;
        Cp(i)=R*(a8+(a9*temp_range(i))+(a10*(temp_range(i)).^2)+(a11*(temp_range(i)).^3)+(a12*(temp_range(i)).^4))
   end


end- In this, every element in the temperature array is checked and if the temp is lesser than the mid temp temp, else condition is executed else if condition is executed.
2.FUNCTION FOR H
function [H]=enthalpy(a1,a2,a3,a4,a5,a6,a7,a8,a9,a10,a11,a12,a13,a14,t,mid_temp)
R=8.314;

for i=1:length(t)
     if(t(i)>=mid_temp);
        H(i)=(a1+((a2*t(i))/2)+((a3*t(i).^2)/3)+((a4*t(i).^3)/4)+((a5*t(i).^4)/5)+(a6/t(i)))*R.*t(i)
     else;
        H(i)=(a8+((a9*t(i))/2)+((a10*t(i).^2)/3)+((a11*t(i).^3)/4)+((a12*t(i).^4)/5)+(a13/t(i)))*R.*t(i)


end

end- The condition is checked. If the temp is greater than the mid temp, if is executed else the else condition is executed.
3.FUNCTION FOR S
function [s]=entropy(a1,a2,a3,a4,a5,a6,a7,a8,a9,a10,a11,a12,a13,a14,temp_range,mid_temp)


R=8.314;
for i=1:length(temp_range)
  if(temp_range(i)>=mid_temp);
   s(i)=(a1*log(temp_range(i))+(a2*temp_range(i))+(a3*temp_range(i).^2./2)+(a4*temp_range(i).^3./3)+(a5*temp_range(i).^4./4)+a7).*R
  else;
   s(i)=(a8*log(temp_range(i))+(a9*temp_range(i))+(a10*temp_range(i).^2./2)+(a11*temp_range(i).^3./3)+(a13*temp_range(i).^4./4)+14).*R


end

end
A similar pattern is followed for this function too.
4.FUNCTION FOR MOLECULAR WEIGHT
function [W]=molecular_weight(species_name)
   ele={'H','C','N','O','Ar'};
   mass=[1 12 14 16 40];
   W=0;
   for i=1:length(species_name);
       for j=1:length(ele);
           if strcmp(species_name(i),ele(j));
               W=W+mass(j);
               position=j;
           end
       end
       o=str2num(species_name(i));
       if o>1
           W=W+(mass(position)*(o-1));
       end
   end
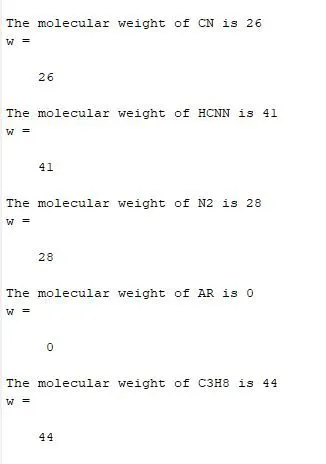
  fprintf('The molecular weight of %s is %d',species_name,W)
- In this function, 2 arrays are declared. One with the name of the element and other with its corresponding molecular mass.
- 2 for loops are used in this. The first loop is run for the length of species name . Eg if species name is HCN, the loop is run from 1 to 3.
- The second loop is run for the element array
- If species(i) and element(i) match, for which the strcmp is used, the atomic mass of that particular element is added.
- The the position is saved in a new varible.
- Now the str2num is used to convert the species name into an array.
- It is assigned to a variable o.
- For example, if CH3 is the name of species, then str2num saves the variable 3 in 0 and now if the condition is satiesfied, that is if o>1, that value minus one is multiplied to the value at position(position).
- In the case of CH3, (o-1) which is 2 is multipied to 1(the mass of hydrogen).
OUTPUT
The screen shot of the saved folders are shown.


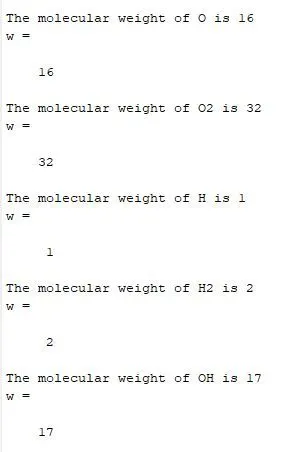
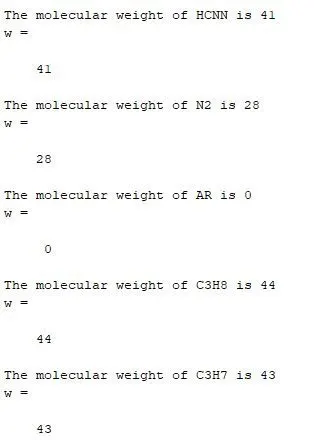
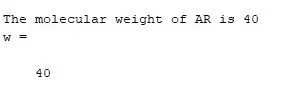
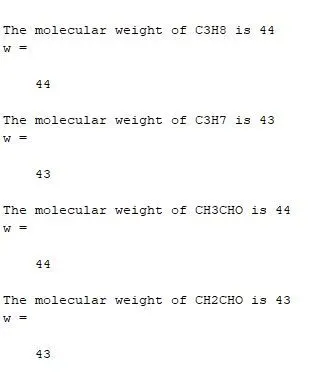
screenshot of the calculated molecular masses after running the code.
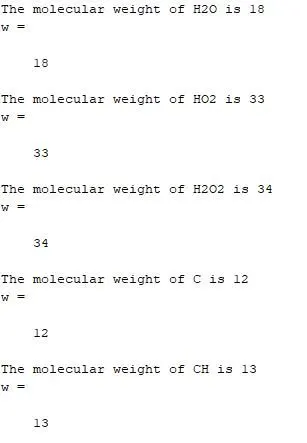
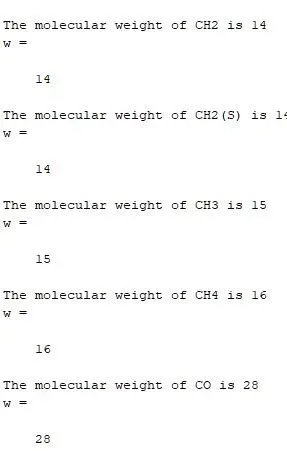
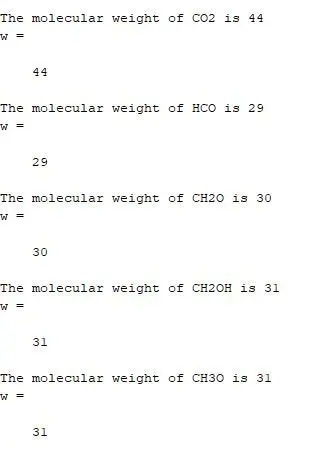
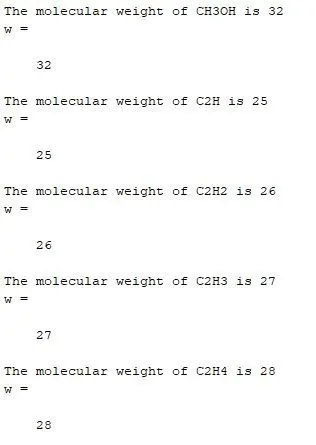
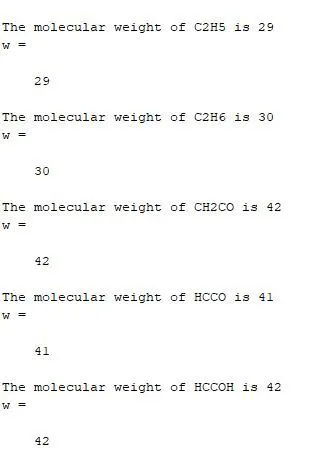
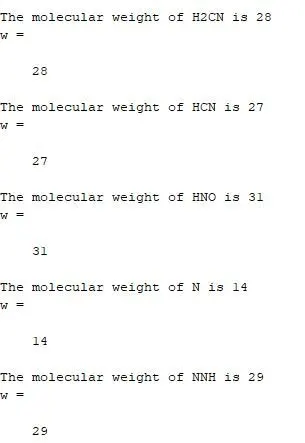
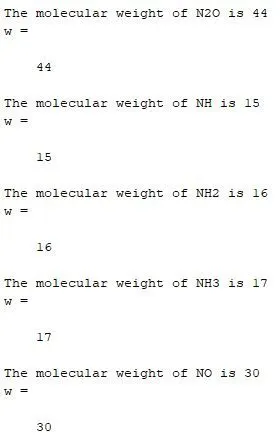
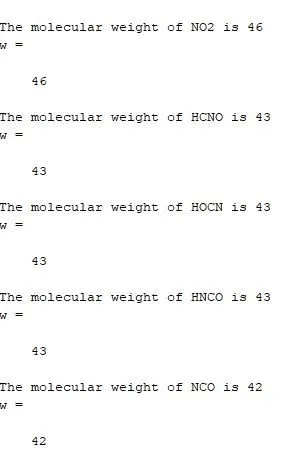
Screenshots of the graphs
O2
N2
CO2
ERRORS DURING PROGRAMMING

This error occurs if you forget to close the brackets once you call a function.
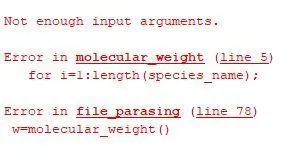
This error occurs if the number of arguments passed in a function does not match.
RESULTS
From the graphs , we can find that enthalpy has a linear variation with temperature but entropy has variation that is almost parabolic and specific heat has a variation that is in between linear and parabolic for mos of the cases.
One exception is Argon where specific heat remains constant.
All the graphs have been plotted and molecular mass has been calculated.
REFERENCES
1.https://skill-lync.com/projects/Parsing-NASA-Thermodynamic-data-44062
2.https://www.engineeringtoolbox.com/oxygen-d_1422.html
3.https://in.mathworks.com/help/matlab/
4.https://www.merriam-webster.com/dictionary/entropy