Week-4 Challenge WOT Condition Part-2
- What is the difference between the mapped and dynamic model of engine, motor and generator? How can you change model type?
- Mapped Model
- Mapped engines represent macro engine behaviour as a set of lookup tables as function of commanded load and measured engine speed.
- In the Mapped models the data is taken from the lookup tables. Such as Engine, motor, generator characteristics at certain conditions as parameters.
- Mapped models are very less time-intensive and require less processing power.
- Mapped engine models are suitable for analysis and design activities that do not require engine subsystem dynamic characteristics, for example in engine and transmission powertrain matching analysis for fuel economy, emission and performance tradeoffs.
- Dynamic Model
- It combines the result of different components to get the dynamic effect.
- Dynamic engines decompose engine behaviour into individual component models that account for engine dynamics, most notably intake airflow and turbocharger dynamics.
- It is used for the case of detailed component level analysis.
- Dynamic engine models are suitable for designing control, estimator, and diagnostic algorithms that depend on dynamic subsystem states, for example, in closed-loop AFR control algorithm development.
- How to change the model type?
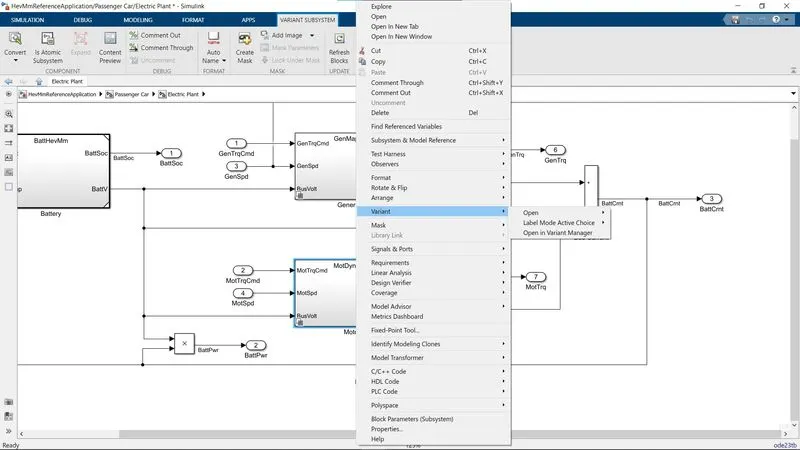
- Open the powertrain blockset for the required vehicle and go to the passenger vehicle block and select engine plant or electric plant.
- Then right-click on the engine/ motor/ generator and go to variant and change the mapped to dynamic model or vice-versa.
2.How does the model calculate miles per gallon? Which factors are considered to model fuel flow?
Miles per gallon (MPG):
- MPG is a Fuel economy rating determined by how far a car can travel on a gallon of gasoline or diesel. Although the metric version would be kilometres per litre, MPG is adopted in many metric-system countries, like Canada, UK.
- While it is both cheaper and better for the environment to achieve a higher MPG rating, there is a curve, that the EPA calls the "MPG Illusion" that shows the cost-benefits of increasing MPG decrease with a higher rating.
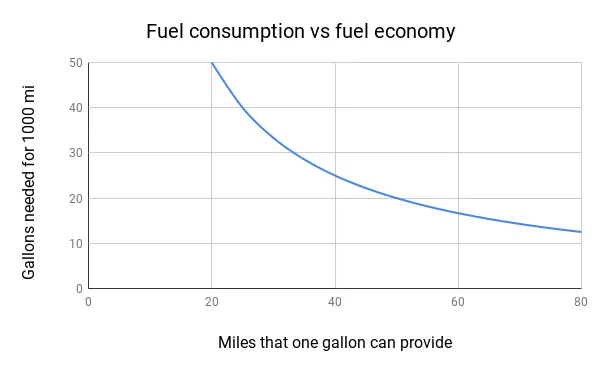
- That fuel consumption does not decrease at a linear rate with MPG increase.
Factors that affect the fuel Economy:
- Excessive Short Trips
- Frequent Cold Weather Travel
- Heavy Braking or Acceleration
- High Vehicle Weight or Towing Weight
- Speeding
3. Run the HEV ReferenceApplication with WOT drive cycle. Change the grade and wind velocity in the environment block. Comment on the results.
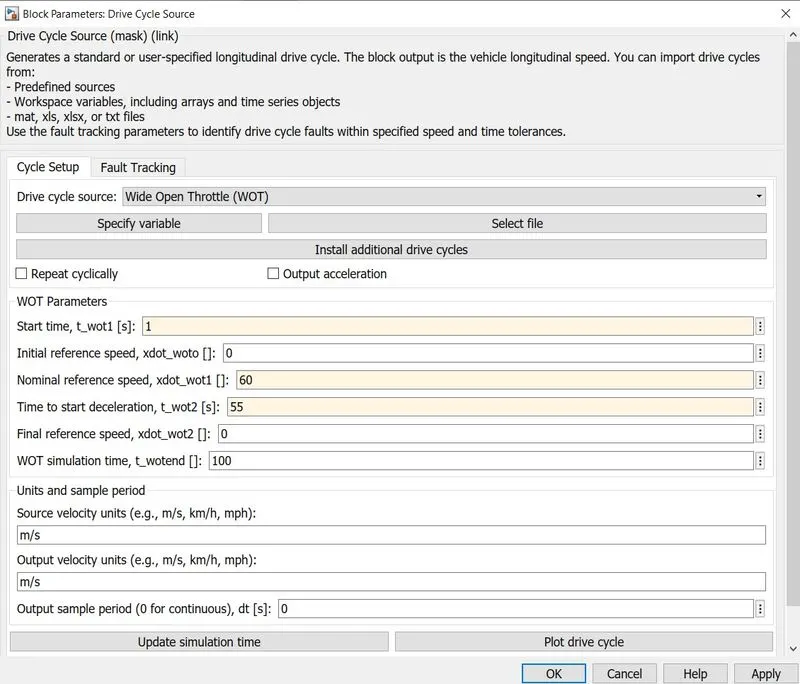
To make a simulation of WOT (Wide Open Throttle) of a hybrid vehicle in HEV ReferenceApplication we have to open the HEV Reference Application and change the drive cycle to WOT as following-
Let's consider the starting time to be 1s
The highest speed to be reached is 60 m/s
Deceleration starts in 55th second from the start
The whole simulation is done for 100 seconds.
Case-1:-
- Now considering the Ideal case as no grade and wind velocity-
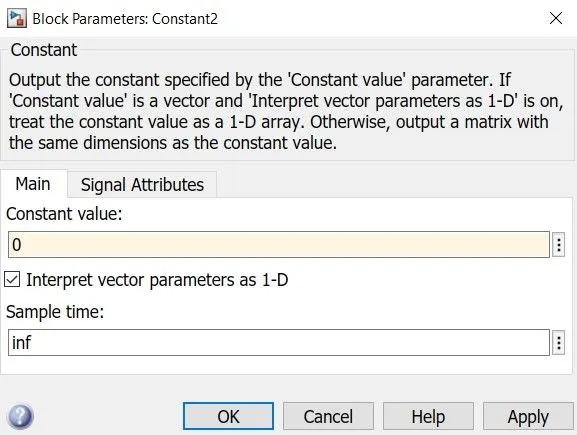
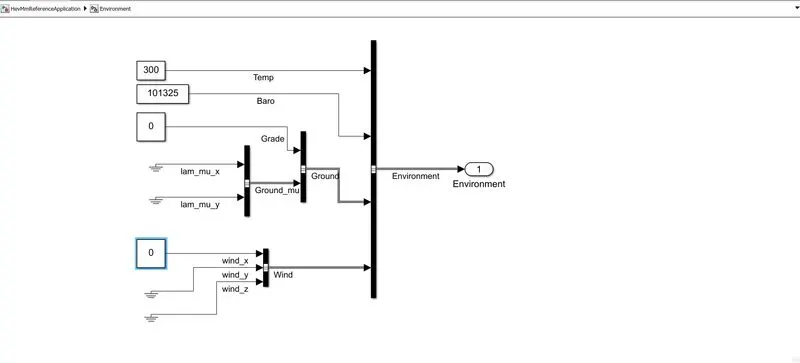
We can check the wind velocity, and grade in the environment block. Shown below-
Here wind velocity is zero.
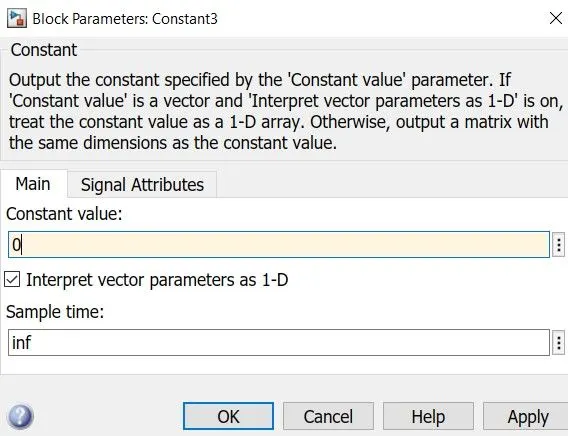
Here the grade value is zero.
By leaving all other parameters as default and running the simulation for 100 seconds and visualising the results we see some astonishing results.
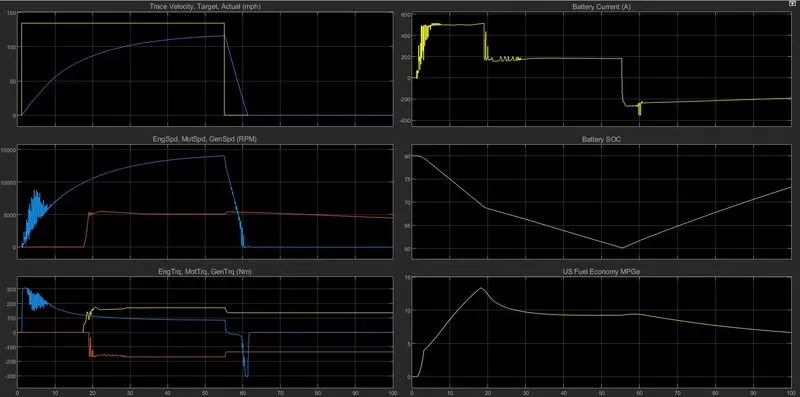
- Results for case 1-
- As we are discussing the wot condition so the initial velocity is zero but we are rapidly increasing the acceleration and for this, the whole battery gets discharged quickly, this results in a high torque in the initial stage, which affects the battery SOC, fuel economy.
- When the vehicle starts to decelerate we see a rapid change in battery SOC and battery current which flows in a negative direction as to recharge the battery which means a negative torque is generated due to regenerative braking.
Case-2:-
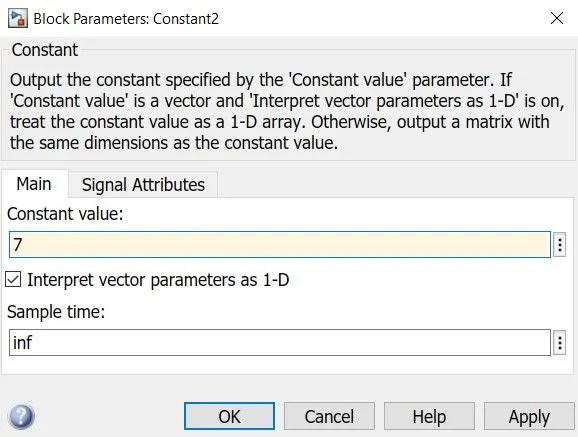
- Now considering the grade and wind velocity-
For wind velocity-
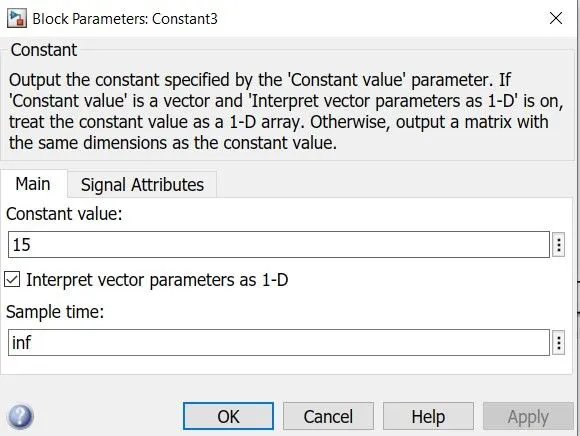
For Grade-
By leaving all other parameters as default and running the simulation for 100 seconds and visualising the results we see some astonishing results.
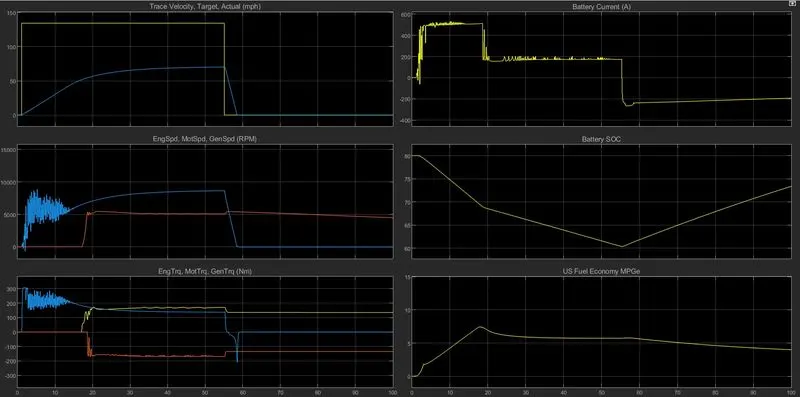
- Results for case 2-
- As the wind velocity is along the direction of the vehicle the rate of battery dissipation is less but the grade adds a toll on the battery system
- Due to the grade, the actual velocity achieved in WOT condition is slightly less which implies the battery current flow in the circuit, which reduced slightly while peeking performance.
Conclusion-
- The main difference between the two cases are the environment where we clearly found that performance is equally not less important than other factors.
- As the second case is more battery efficient than first one just due to the supportive wind resistance but initially, due to the grade, it requires more current to achieve the same speed as before.
- In the first case, we achieved more actual speed than the second. The second case is fuel-intensive because of its high fuel demand to fulfill the acceleration requirements. It's a reason we get slightly better battery performance.
4. Keeping all other parameters same, compare the simulated results of hybrid and pure electric powertrains.
We'll conduct a simulation for the reference application of EV and HEV for WOT type drive cycle. Let's assume that all the other parameters are kept constant and visualise using the scopes given for Energy and Emissions.
Case-1: Hev Reference Application-
Let's start with the Hev Reference model and make it a WOT drive cycle and keep all other parameters as it is.
Let's see the visualisation scope see how the Hybrid vehicle responded to the WOT condition.
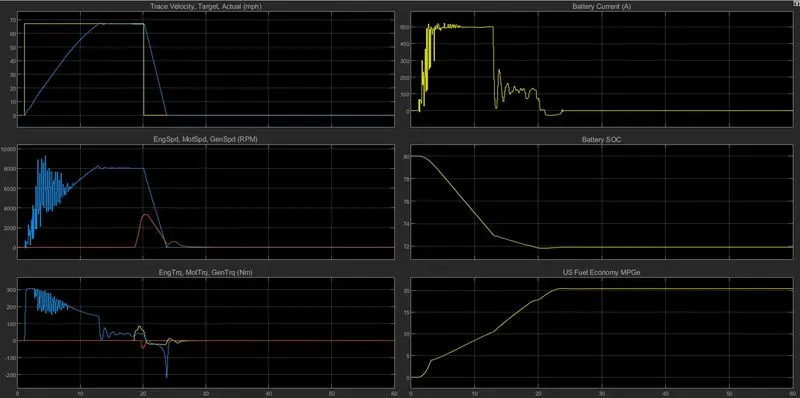
- When a vehicle is increasing the velocity initially we observe that the engine/ motor torque is decreasing gradually. The maximum torque is 300 Nm.
- SOC is changed from 80% to 71% in this whole driving cycle and the maximum current through the circuit was 500A.
- As the vehicle achieved higher speeds the Fuel economy is increased and reached the optimum.
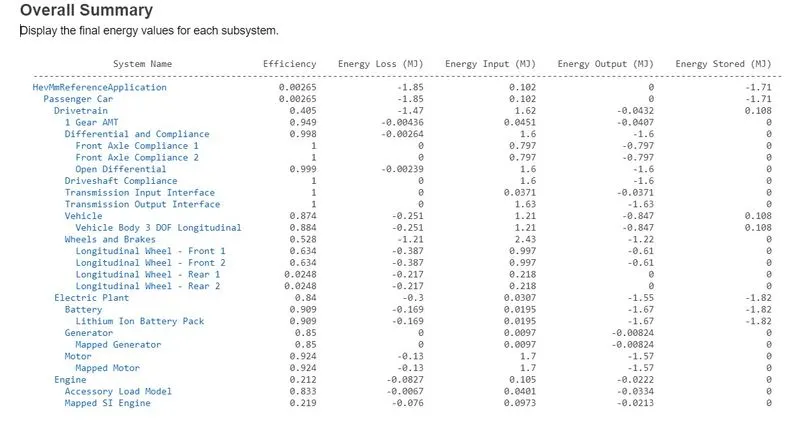
- Overall Summary of the HEV -
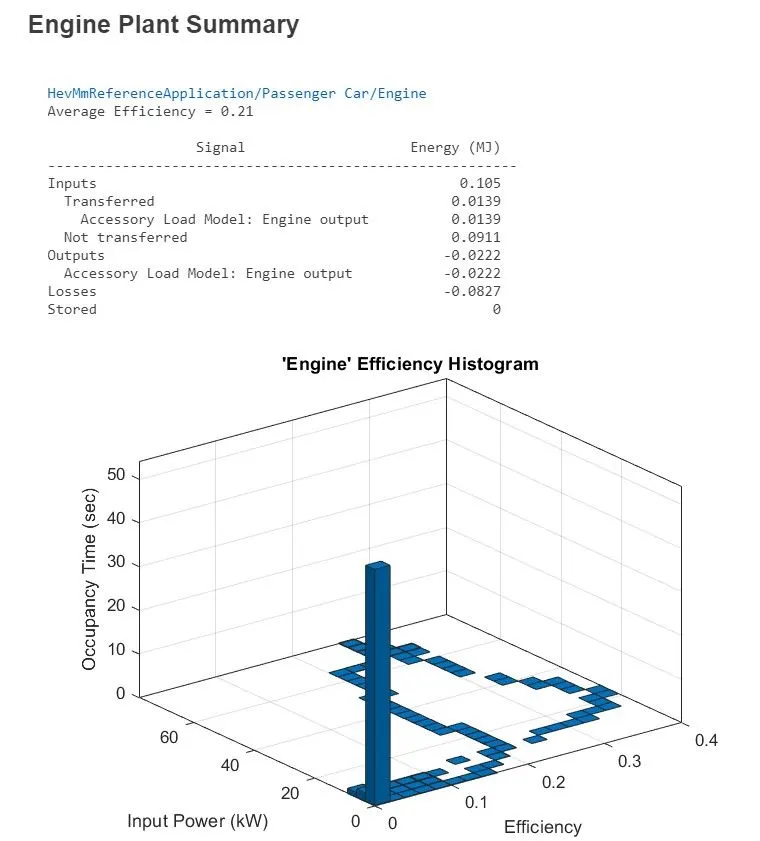
- Engine plant Summary-
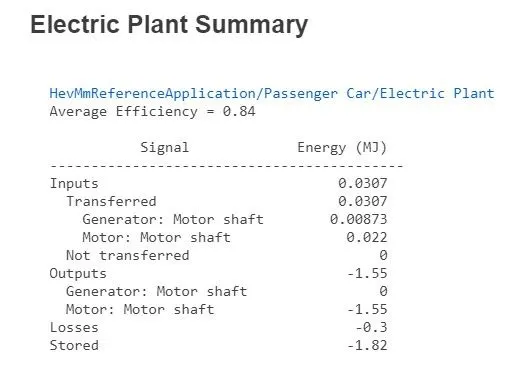
- Electric plant Summary-
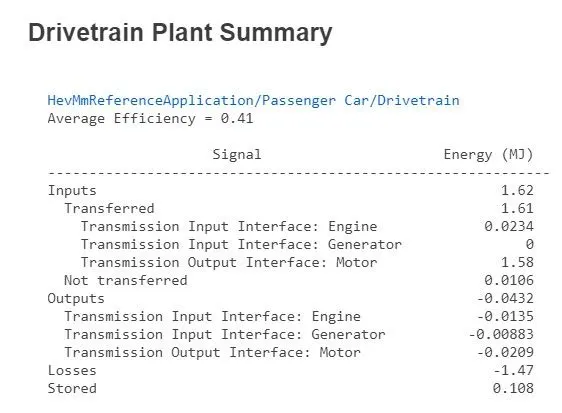
- Drivetrain Plant Summary-
Case-2: Electric Vehicle Reference Application-
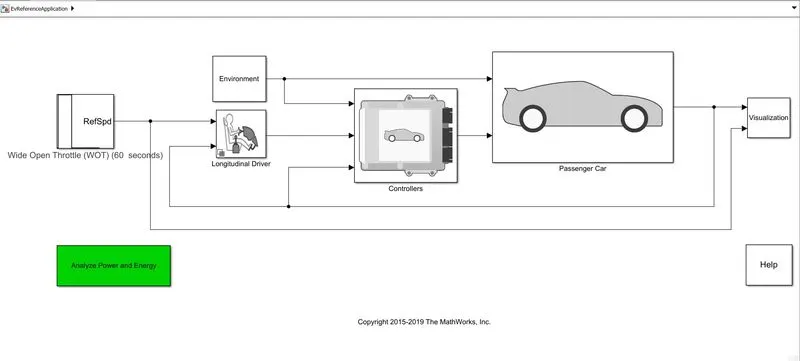
- Simulation of EV-
- Results-
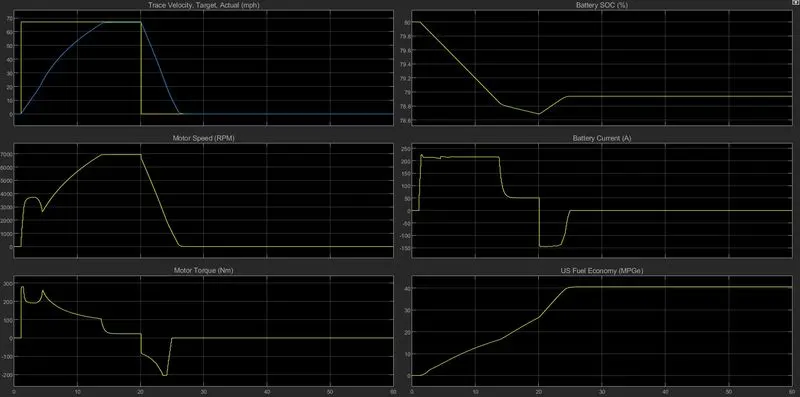
- In the case of EV, the fluctuation of speed is negligible and the speeding curve is smooth, the motor torque was high initially 290Nm and decreased as the speed increased but not strictly. The motor torque characteristics were not so smooth.
- For the whole drive cycle, the maximum current achieved was 220A and the change in SOC was from 80% to 77% which is quite appreciable.
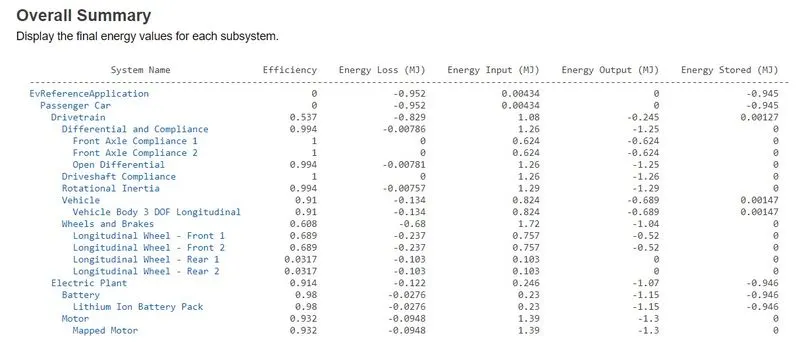
- Overall Summary of the EV -
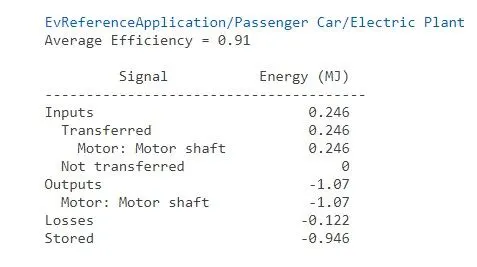
- Electric plant Summary-
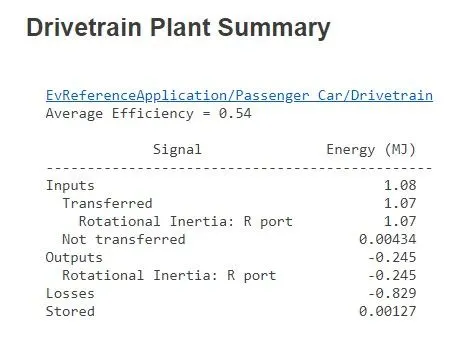
- Drivetrain Plant Summary-
- Comparision-
| Parameters | HEV | EV |
| SOC reduced to | 9 | 3 |
| Current Produced | 500A | 220A |
| Motor Speed | Avg. 5800RPM (Fluctuate between 2000-9600 RPM) | 4000 RPM(Fluctuate between 1000-7000 RPM) |
| Motor Torque | Fluctuates rapidly and reduces | Abruptly reduces not in a steady manner |
| Average Efficiency of Drivetrainplant | 41% | 54% |
| Average Efficiency of Electric plant | 84% | 91% |
| Wheel & Brakes Efficiency | 52.8% | 60.8% |
| Vehicle Efficiency | 87.4% | 91% |