Week-4 Challenge WOT Condition Part-2
Wide Open Throttle (WOT) condition Part-2
Aim:
- Differentiate the mapped and dynamic model of engine, motor and generator. To change the model type.
- To calculate miles per gallon and the factors considered to model fuel flow.
- To run the HEV Reference Application with WOT drive cycle and change the grade and wind velocity in the environment block.
- To keep all the parameters same and compare the simulated results of hybrid and pure electric powertrains.
Mapped and Dynamic models:
Mapped model (engine/motor/ generator): can be defined as a model in which the data is taken from a lookup tables which are predefined in the system and are characteristic under certain parameters. These models can solve faster.
- these implements mapped motor and drive electronics operating in torque-control mode. The output torque tracks the torque reference demand and includes a responses w.r.t motor and drivetrain time constant.
- The output values are stored for the given inputs of the engine/ motor/ generator.
- The accuracy of the mapped model is quite low not as high as dynamic models as it take on overall run time so that leads to fast simulation.
Dynamic model (engine/motor/ generator): in these the data is driven from the individual components to get the dynamic effect. These are used for more detailed and component data and to analyze the impact of individual components on overall performance.
- these include the individual component models that are responsible for the engine dynamics like intake airflow and turbocharger dynamics.
- This runs by the real time simulations that required input from the backward cycle and for these individual real times are performed by summing up all the results of the subsystems that gives the final output.
- The accuracy of these models is very high compared to the mapped models as it goes under the subsystem level of solving.
Steps to select the type of model:
- In the powertrain block set, the vehicle type has to been chosen whether it is a electric or hybrid model else the conventional model.
- Now we can go to the motor/generator/engine block based on the vehicle mode and select the variant and label model by right clicking the block.
- The selection of mapped or dynamic model can be done in the label model active choice option.
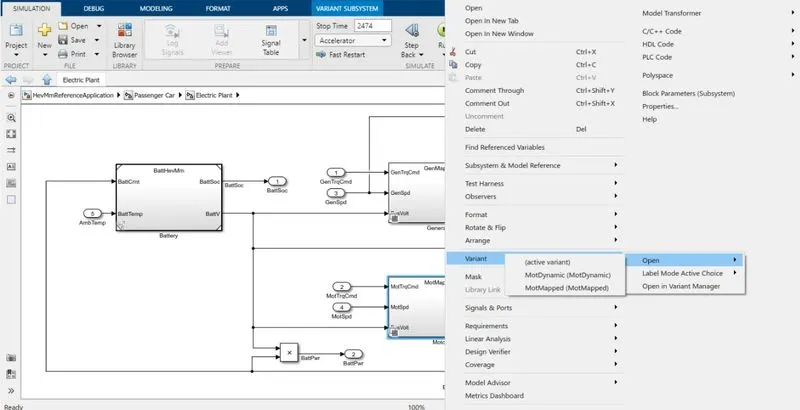
2: Calculating the miles per gallon and factors considered to model the fuel flow:
- The miles per gallon is a fuel economy rating which is gives the information about the range of the vehicle can travel per a gallon of fuel for a conventional vehicle.
- The energy required to propel the vehicle through a distance that is equivalent to an engine powered car is considered for an electric vehicle. The amount of fuel requirement for conventional vehicle and battery-operated vehicle.
Below a model block diagram is provided which represents the conversion of battery power to miles per gallon.
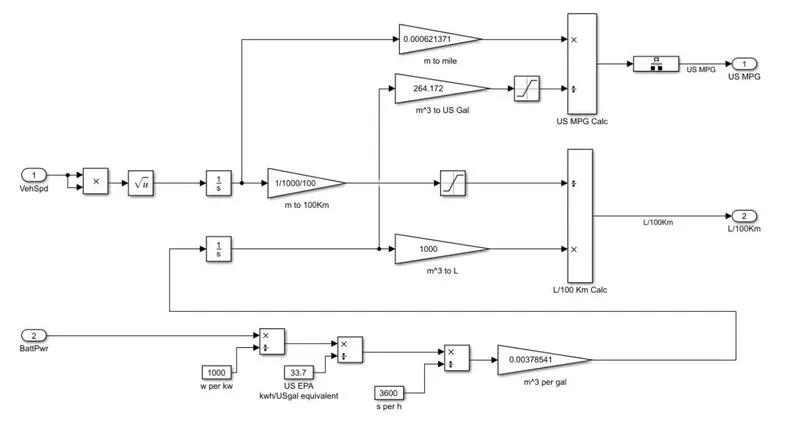
Block diagram:
- In the block diagram, the battery power(W) is converted into kilowatts (KW) by dividing it with 1000.
- then the as per US EPA (environment protection agency), the kw is converted to equivalent Gallons (USgal) by dividing it with 33.7.
- this USgal is converted to seconds by dividing it with 3600 and multiplied with (0.00378541) to convert into (m^3/sec).
- the input from the vehicle speed in terms of distance is taken in miles by multiplying with (0.00621371) to the distance which is in meters.
- Finally, the inputs from battery and fuel energy (if considered) in terms of m^3 is converted to US gallons by multiplying with 264.172.
- then these two parameters which are in miles and gallons are further divided to get the miles/gallon conversion.
FACTORS TO BE CONSIDERED IN FUEL FLOW:
- weight of the body.
- Breaking and acceleration (rapid).
- Weather conditions etc.
3: Running the HEV Reference Application with WOT drive cycle and change the grade and wind velocity in the environment block:
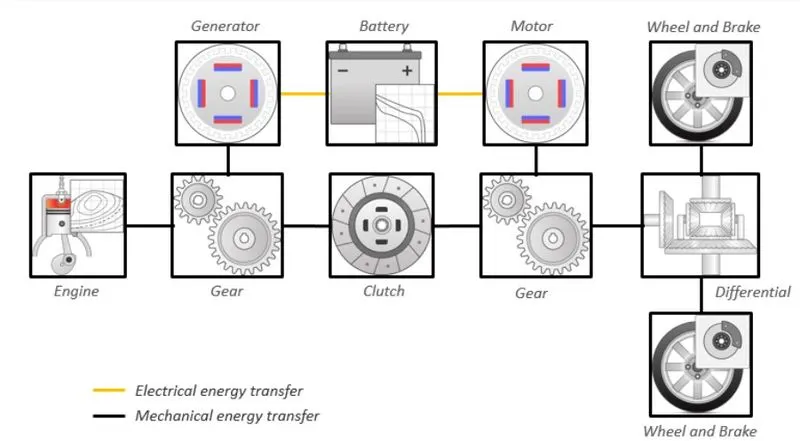
In the powertrain block set the Hybrid electric vehicle reference application is selected and the reference drive cycle is changed to the WOT condition and by default the system considers the engine specification as SI mapped engine and the environment conditions are changed by changing the grade value from 0 to 6 and the wind velocity to 10m/s.
The run time is set to 50seconds and the results are observed.
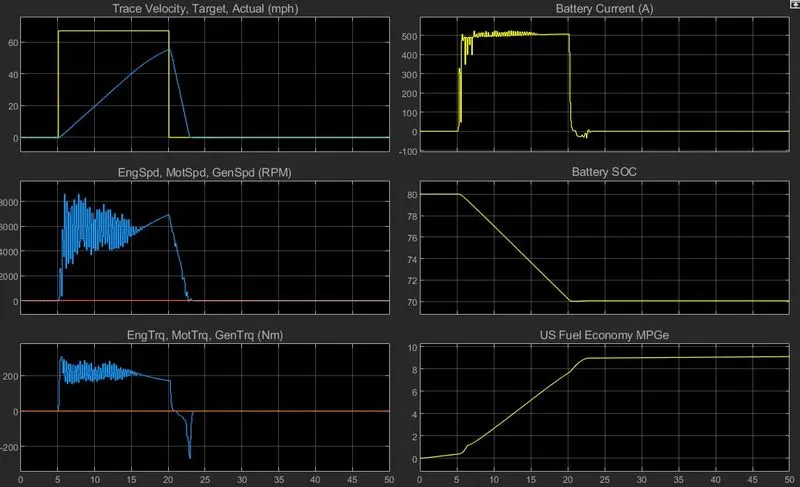
Observation:
- We can know that the vehicle is in rest for first 5 seconds and then it starts to accelerate until 20seconds.
- For the next 20 seconds the vehicle decelerates comes to rest to 30th
- The state of charge of the vehicle reduced from 80% to 70% from 5-20 seconds and the battery current goes to 500A in this duration.
- As the deceleration takes place from 20 to 30th second, the battery current reduced from 500 to -40 an again gains to zero.
- The fuel economy in MPGe is increased gradually during 5-20seconds and later increased at very slow rate as the vehicle is retarding.
4: keeping all the parameters same and to compare the simulated results of hybrid and pure electric power trains:
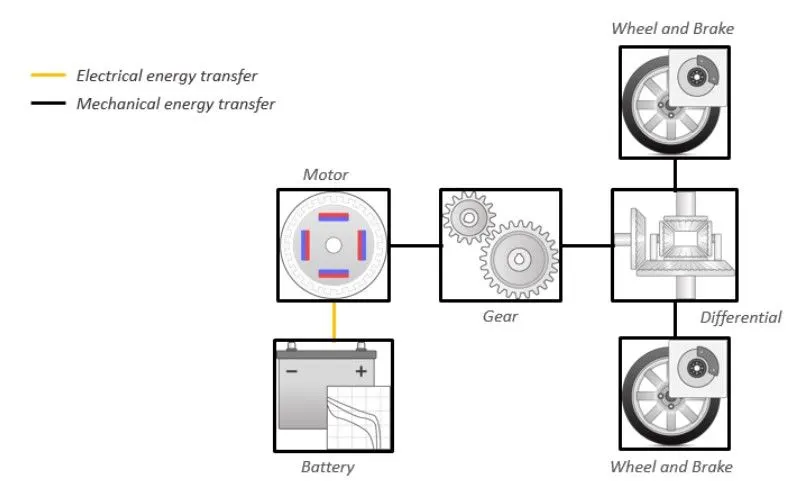
For the hybrid electric power train, we can consider the above case’s model, setup and results for this case also. Below picture represents the Powertrain configuration of pure electric vehicle. The settings are given the same as the hybrid vehicle for pure electric in the environment block. The rest of the blocks are same and simulated for 40 seconds.
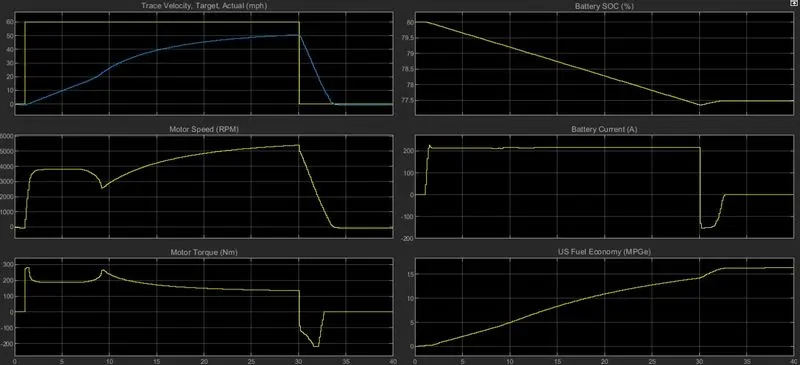
Observation:
- The vehicle starts acceleration from 1 to 30 seconds on rest till 1st
- It starts to decelerate after 30seconds and simultaneously we can observe the motor acting as generator through regenerative braking system.
- The battery current increased to 210A till 1st second and remains almost constant till the acceleration stops and when the retardation takes place the battery current does falls to -150A and then goes to zero.
- The battery charge (state of charge) does go from 80 to 77.5 and increased slightly during the retardation takes place.
Results:
we can conclude that the effciency of the pure elecrtric is much high than the hybrid vehicle. with the same environmental conditions the hybrid vehicle shows higher performance than electric vehicle. the emmission rate of the electric vehicle is zero where as the hybrid electric vehicle porduces so amount of emmsions. the powertrain blocksets are simulated.