Project 1 - Parsing NASA thermodynamic data
PARSING NASA THERMODYNAMIC DATA
Aim:
- To write a function that extracts 14-coefficients and calculate the specific heat, enthalpy and entropy for all the species in the data file.
- To calculate the molecular weights of individual species and display in the command window.
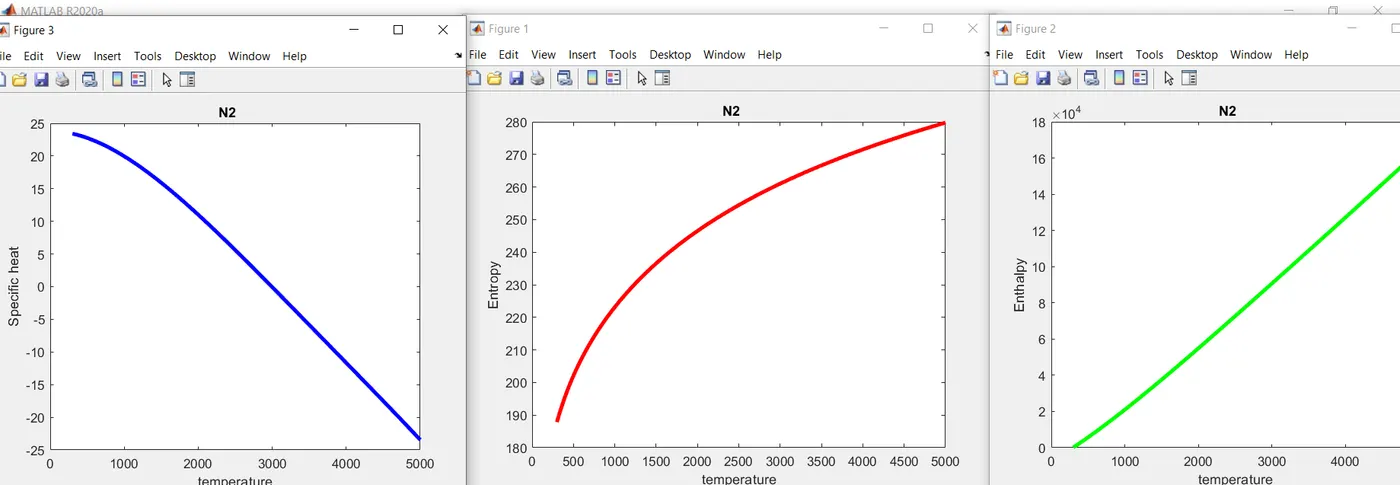
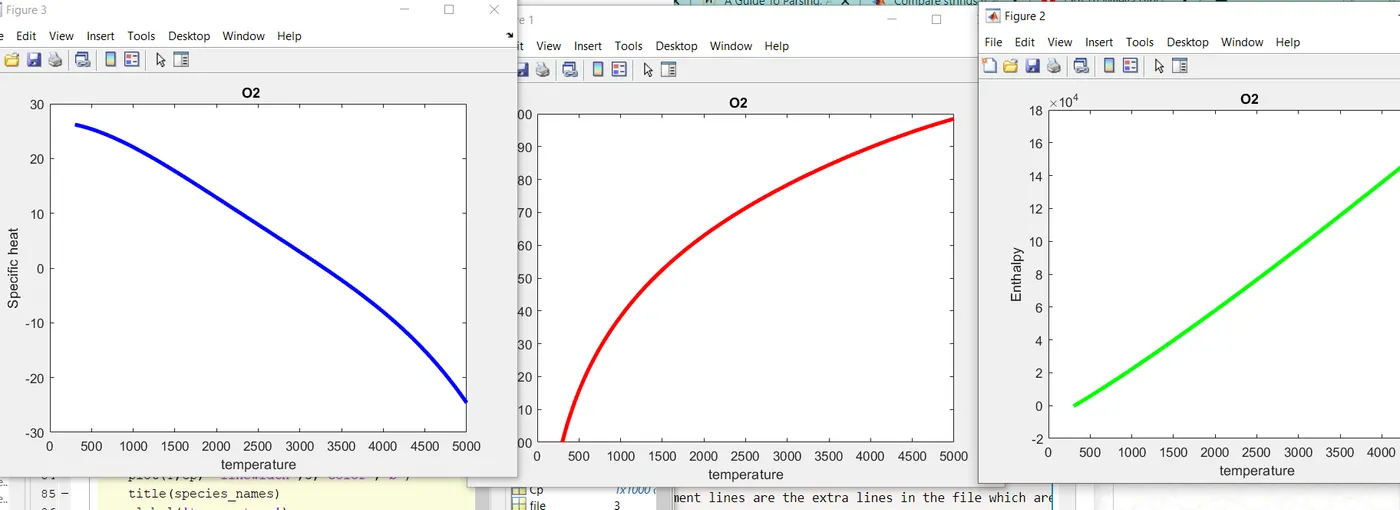
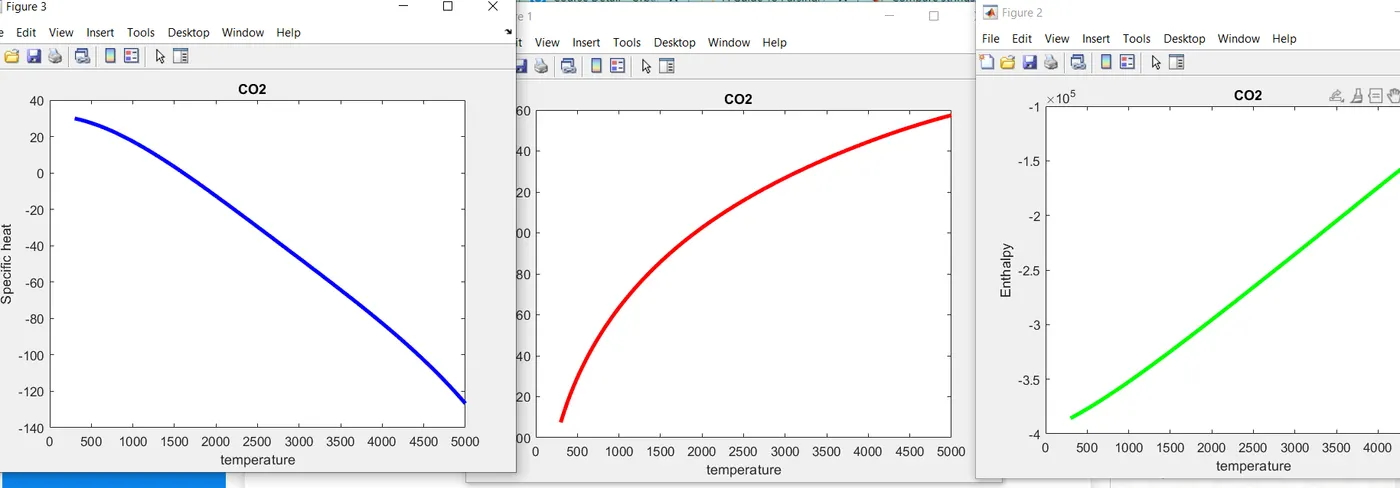
- To plot the Cp, Enthalpy, Entropy for the local temperature range for all species.
- To present the plots in images with appropriate names and placed in a folder with relevant names to them which are to be generated automatically.
Inputs: NASA thermodynamic data file ‘THERMO.dat’.
Theory:
File parsing is an analysis of a input to organize the data according to the rule of a grammar. It builds data structure depending on the tokens. In parsing it takes the inputs from the tokens and gives the output in the form of parse tree.
Major codes used:
- fopen() - opens a data file that has been defined either to read or write the data.
- fgetl() - reads the first lien of the data.
- strsplit() - to split the text data at desired position.
- str2double() – to convert string format into double.
- strfind() – to find the given input argument that has been defined using (“ ”);
- mkdir() - to create a directory file at a position.
- cd() - to get back into previous folder.
- Strcmp() – this command is used to compare two strings.
Formulae:
- Universal gas constant (R) J/(mol).K
`R = 8.314`
- Formula for calculation of specific heat, enthalpy, entropy.
`Cp//R = a1 + a2T +a3T^2 +a4T^3+a5T^4`
`H//RT = a1+a2 T//2 +a3 T^2//3 +a4 T^3//4 +a5 T^4//5 +a6//T`
`S//R = a1 lnT +a2 T +a3 T^2//2 + a4 T^3 3//3 +a5 T^4 //4 +a7`
where Cp is teh specific heat (cal/(mol k))
R is the universal gas constant J/(mol)K
H is the enthalpy (cal/mol)
T is the temperature (K)
S is the entropy (cal/(mol k))
Procedure:
- Open the data file using the fopen();
- Using the fgetl() command to read the lines. And by using the code
- For defining the temperature ranges for local and global tempratures, the sentences in the document THERMO.dat are splitted usin strsplit() and low, mid and high temperature ranges are defined and converted from string format to double.
- total no. of species are calculated by checking the the data file and called out again by using fgetl() command.
- the coefficients for the calculation if specific heat, enthalpy and entropy are defined and chaged their format from string to double.
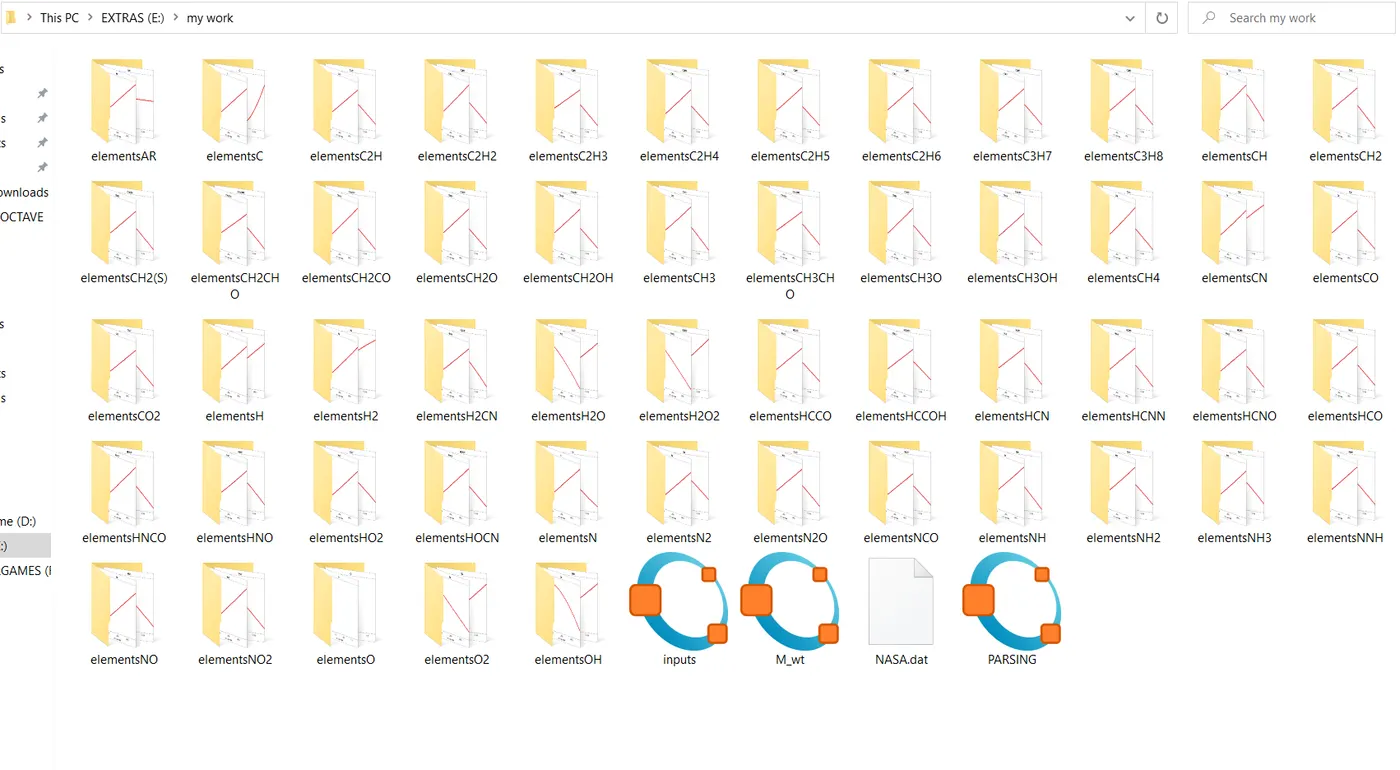
- For the plots to be saved at a single place a folder is created using mkdir([]) command
- A separate fucntion has been coded for the calculation of Cp , H, S and named as inputs.m in which the coefficients are choosen by temperature that has been provided. it is done by using the if-else loop.
- the plots for the calculated values are plotted simultaneously and saved using saveas() command.
- for the calculation of the molecular weights in the comand window a function has been coded named as M_wt where the species_names are taken as input and they are converted into upper case letters as the elements are in upper case letters.
- the atomic weights to the individual elements are provided and by using the for and if loop the molecular weights have been calculated.
Code:
1: main code:
%%  PARSING NASA THERMODYNAMIC DATA FILE


clc
clear all
close all
%INPUTS : 'THERMO.dat' file.
% universal gas constant (R) = 8.134 J/(mol).K.

file        =  fopen('THERMO.dat', 'r');  %% opening the file in the read mode
text1       =  fgetl(file);               %% reading the first line in the file  i.e, heading.
text2       =  fgetl(file);               %% reading the second line in the file i.e, local & global temperatues.

comment1    =  fgetl(file);               %% the comment lines are the extra lines in the file which are not used in the code.
comment2    =  fgetl(file);
comment3    =  fgetl(file);
%% defining the temperatur ranges
range             =  strsplit(text2,' '); %% splitting the senstence for defining the  temperature range
global_low_temp   = str2double(range{2});
global_mid_temp   = str2double(range{3});
global_high_temp  = str2double(range{4});
R                 =  8.134;


%% counting the no.of species in the file
% total lines in the file are 217, but 2 lines are defining the details, 3 other lines are general statements so left over are 212 lines
% each species is taking 4 lines
for i = 1:53
    names_of_species = fgetl(file);
    species_names    = names_of_species(1:6);

    line1   = fgetl(file);
    L_1     = strfind(line1, 'E');
    coeff1  = str2double(line1(1:(L_1(1)+3)));
    coeff2  = str2double(line1((L_1(1)+4) : (L_1(2)+3)));
    coeff3  = str2double(line1((L_1(2)+4) : (L_1(3)+3)));
    coeff4  = str2double(line1((L_1(3)+4) : (L_1(4)+3)));
    coeff5  = str2double(line1((L_1(4)+4) : (L_1(5)+3)));


    line2   = fgetl(file);
    L_2     = strfind(line2, 'E');
    coeff6  = str2double(line2(1:(L_2(1)+3)));
    coeff7  = str2double(line2((L_2(1)+4) : (L_2(2)+3)));
    coeff8  = str2double(line2((L_2(2)+4) : (L_2(3)+3)));
    coeff9  = str2double(line2((L_2(3)+4) : (L_2(4)+3)));
    coeff10 = str2double(line2((L_2(4)+4) : (L_2(5)+3)));


    line3    = fgetl(file);
    L_3      = strfind(line3, 'E');
    coeff11  = str2double(line3(1:(L_3(1)+3)));
    coeff12  = str2double(line3((L_3(1)+4) : (L_3(2)+3)));
    coeff13  = str2double(line3((L_3(2)+4) : (L_3(3)+3)));
    coeff14  = str2double(line3((L_3(3)+4) : (L_3(4)+3)));

    %% CREARATING THE FILE FOLDER FOR THE PLOT RESIDUALS

    mkdir(['E:\my work\elements',species_names])


    %% CALCULATING THE VALUES OF SPECIFIC HEAT, ENTHALPY AND ENTROPY
    T        = linspace(300,5000,1000);
    R        =  8.134;
   [Cp,H,S]  = inputs( coeff1, coeff2, coeff3, coeff4, coeff5, coeff6, coeff7, coeff8, coeff9, coeff10, coeff11, coeff12, coeff13, coeff14, R, T, global_mid_temp);
    %% PLOTTING THE REQUIRED GRAPHS

    figure(1)
    plot(T,S, 'linewidth',3,'color','r')
    title(species_names)
    xlabel('temperature')
    ylabel('Entropy')


    figure(2)
    plot(T,H, 'linewidth',3,'color','g')
    title(species_names)
    xlabel('temperature')
    ylabel('Enthalpy')


    figure(3)
    plot(T,Cp, 'linewidth',3,'color','b')
    title(species_names)
    xlabel('temperature')
    ylabel('Specific heat')


    cd(['E:\my work\elements',species_names])   %% to get back from the folder

    saveas(1,'Entropy.jpg');
    saveas(2,'Enthalpy.jpg');
    saveas(3,'specific heat.jpg');

    cd('E:\my work')


     M  = M_wt(species_names)          %% calling out the  molecular weight fucntion


end
code-2: writing the code for calculation of molecular weights
%FUNCTION FOR CALCULATION THE MOLECULAR WEIGHTS OF THE IDIVIDUAL SPECIES.

function [M]        =   M_wt(species_names)

names_of_species      = upper(species_names);

individual_elements  =   {'C','H','O','N','A','S'};

atomic_weight        =   [12,1,16,14,40,32];

M              = 0;

for                i = 1:length(names_of_species)
    for            j = 1:length(individual_elements)
       if strcmp(names_of_species(i),individual_elements(j))
        M       =  M + atomic_weight(j);
        pos          = j;

       end
    end


        num          = str2double(names_of_species(i));


    if            num>1

              M = M +(atomic_weight(pos).*(num-1));

    end
end
code-3: writing a function code for the calculation of spcific heat, enthaly, enatropy.
% FUCNTION FOR THE CALCULATIONS OF SPECIFIC HEAT, ENTROPY AND ENTHAPLY FOR
% ALL SPECIES

function[Cp,H,S] = inputs( coeff1, coeff2, coeff3, coeff4, coeff5, coeff6, coeff7, coeff8, coeff9, coeff10, coeff11, coeff12, coeff13, coeff14, R, T, global_mid_temp)

for i = 1:length(T)
    if T(i)>global_mid_temp


        Cp = (coeff1 + coeff2 + coeff3.*T.^2 + coeff4.*T.^3 + coeff5.*T.^4).*R;
        H  = (coeff1 + (coeff2.*T)./2 + (coeff3.*T.^2)./3 + (coeff4.*T.^3)./4 + (coeff5.*T.^4)./5 + coeff6./T).*T.*R;
        S  = (coeff1.*log(T) + coeff2.*T + (coeff3.*T.^2)./2 + (coeff4.*T.^3)./3 + (coeff5.*T.^4)./4 + coeff7).*R;

    else
          Cp = (coeff8 + coeff9 + coeff10.*T.^2 + coeff11.*T.^3 + coeff12.*T.^4).*R;
          H  = (coeff8 + (coeff9.*T)./2 + (coeff10.*T.^2)./3 + (coeff11.*T.^3)./4 + (coeff12.*T.^4)./5 + coeff13./T).*T.*R;
          S  = (coeff8.*log(T) + coeff9.*T + (coeff10.*T.^2)./2 + (coeff11.*T.^3)./3 + (coeff12.*T.^4)./4 + coeff14).*R;
    end
end
end
Errors:
1: In the coefficients the function variable coeff15 has been unrecognized.
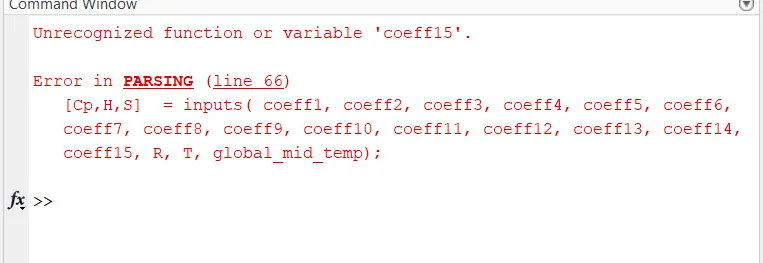
this error has been corrected by removing the coeff15 because these is no 15th coefficient.
Results:
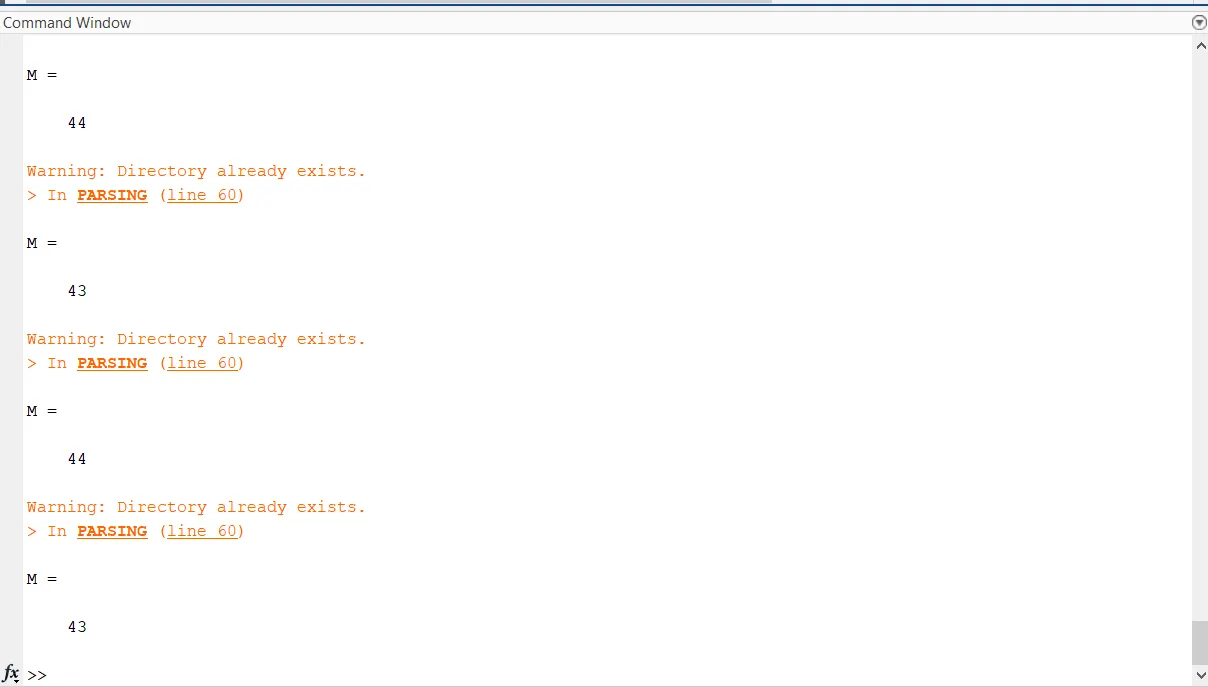
1: molecular weights of the species executed in the command window.
2: the plots of the species that have been saved automatically by creating a folder by the program.
3: the plots of N2, O2 and CO2