Week-4 Challenge WOT Condition Part-2
AIM:
- What is the difference between mapped and dynamic model of engine, motor and generator How can you change model type
- How does the model calculate miles per gallon Which factors are considered to model fuel flow
- Run the HEV Reference Application with WOT drive cycle. Change the grade and wind velocity in the environment block. Comment on the results.
- Keeping all other parameters same, compare the simulated results of hybrid and pure electric powertrains.
THEORY:
Powertrain blockset that provides fully assembled reference application models of powertrains which include diesel, gasoline, hybrid and electric systems. It includes a component library which simulates engine subsystems, transmission assemblies, traction motors, and battery pack and controller models. A dynamometer is also included in the power train blockset which is used for virtual testing. MDF file support provides a standard – based interface for calibrating the tools which helps in importing the data.
Powertrain blockset is used for design trade off analysis and component sizing and hardware – in – the –loop testing.We can customize the models by changing the components in a reference application with your own data. Powertrain blockset provides a standard model architecture which can be reused throughout the development process.
1. What is the difference between mapped and dynamic model of engine, motor and generator? How can you change model type?
MAPPED MODEL
In mapped model the data which is used for operation and simulation is entered in the form of a look up table which is then configured with operational parts and then analysis is formed. Less time is required for simulation and less accurate are the results as compared to dynamic model.
ADVANTAGES
- If the look up table data is available then the simulation becomes easier and the results are given on the basis of the data interpreted.
DISADVANTAGES
- More data has to be collected and some assumptions are to be made
DYNAMIC MODEL
Dynamic model understands the behaviour of the model and behaves accordingly. It gives detailed analysis after the data is fed by the user and is more accurate than a mapped model. It simulates according to real time and dynamic operations. More time is required for simulation and accurate results are obtained compared to mapped model.
ADVANTAGES
- It operates dynamically depending on the situation of operation, specification and detailed data are not required and simulations gives detailed analysis of the components simulated.
DISADVANTAGE
- It does not simulate as per users customized specifications.
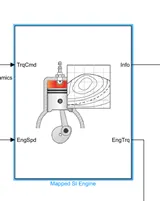
MAPPED ENGINE
Mapped engine block used to measure the performance parameter of the vehicle by using steady –state look- up table. It is a default parameter in the powertrain blockset which provides the overall engine characteristics that include fuel flow rate, actual torque and engine out exhaust emissions. This block is used for hardware in the loop engine control design or vehicle fuel economy and performance simulations.
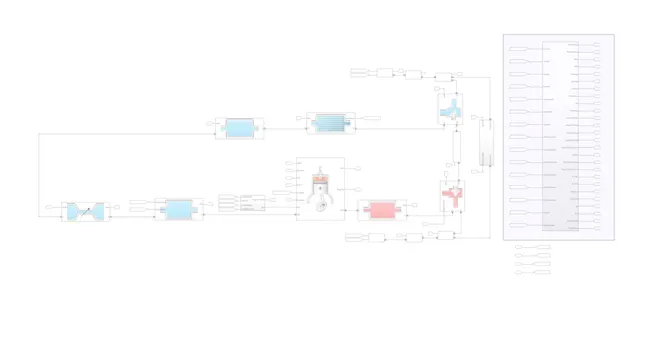
DYNAMIC ENGINE
Model breaks down the engine behaviour into engine characteristics which are separated into lower level components. By combining the components in this way, the model captures the dynamic effects. This engine block calculates fuel flow, air mass flow using either by speed density or dual independent cam phasing models, air- fuel ratio, exhaust temperature and exhaust mass flow rate.
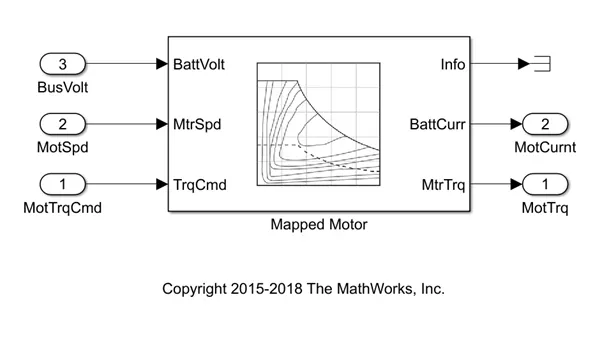
MAPPED MOTOR
Mapped motor uses a mapped motor and drive electronics that operates in torque control mode. Output torque tracks a torque response reference demand which includes a motor and drive response time constant. It also specifies the electrical losses as a single operating unit that measures losses across operating range or measured efficiency.
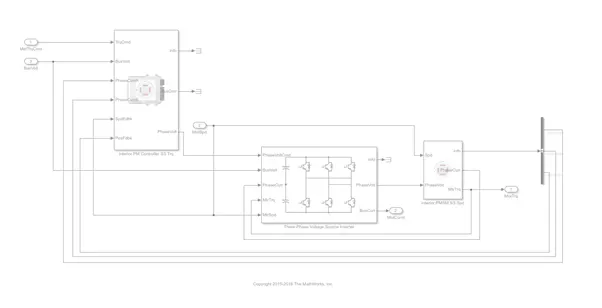
DYNAMIC MOTOR
Dynamic motor uses a torque based, field oriented controller for an internal permanent magnet synchronous machine with an optional outer loop speed controller. This torque controller implements strategies for increasing the torque per amp and also weakens the magnetic flux.
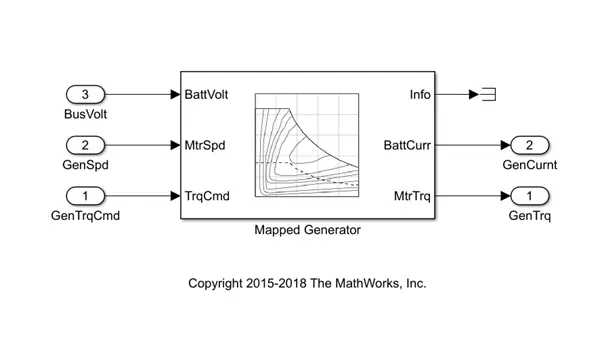
MAPPED GENERATOR
Mapped generator uses a mapped motor and drive electronics that operates in torque control mode. Output torque tracks a torque response reference demand which includes a motor and drive response time constant. It also specifies the electrical losses as a single operating unit that measures losses across operating range, measured loss or measured efficiency.
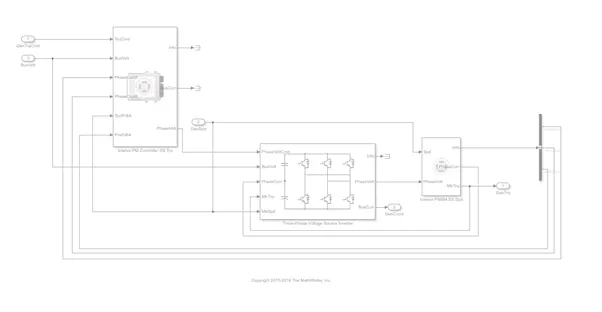
DYNAMIC GENRATOR
Dynamic generator uses a torque based, field oriented controller for an internal permanent magnet synchronous machine with an optional outer loop speed controller. This torque controller implements strategies for increasing the torque per amp and also weakens the magnetic flux.
STEPS TO CHANGE THE MODEL TYPE
To change the model type of motor or generator from mapped model to the dynamic model the following steps are to be followed:
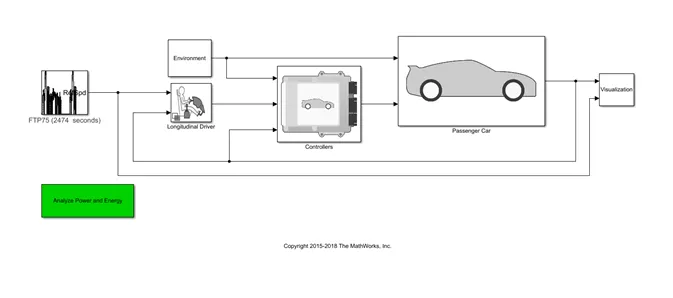
- Firstly we select the hybrid reference application model in Simulink from the powertrain blockset which consists of the drive cycle , longitudinal driver , environmental conditions , controllers and passenger car as shown below:
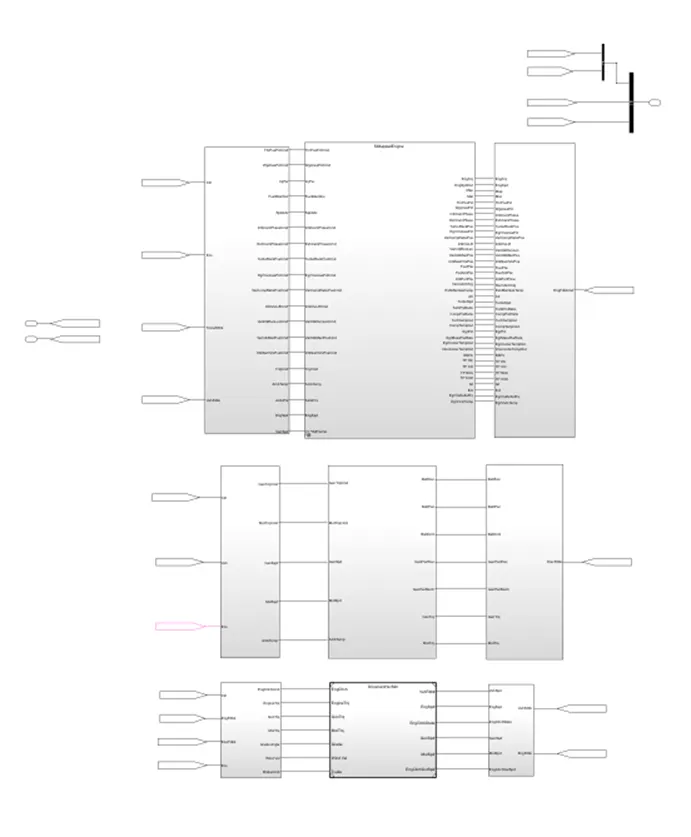
- Then the passenger block is clicked which consists of engine , electric plant , drive train and their respective inputs and outputs as shown below:
- Once the electric plant is opened it consists of battery , generator and motor which can be seen below :
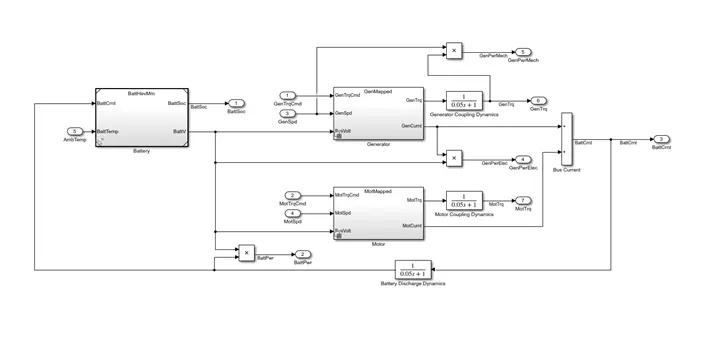
- Either the generator or the motor block is selected, to change the model type. The generator block is clicked to find the mapped and dynamic models of the generator as shown below :
By default mapped generator block is selected.
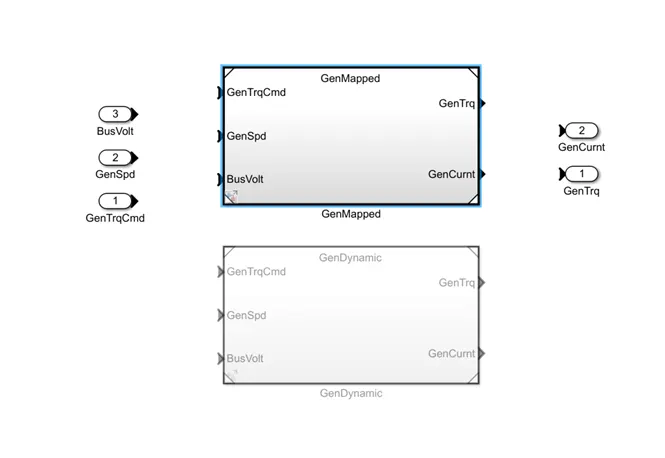
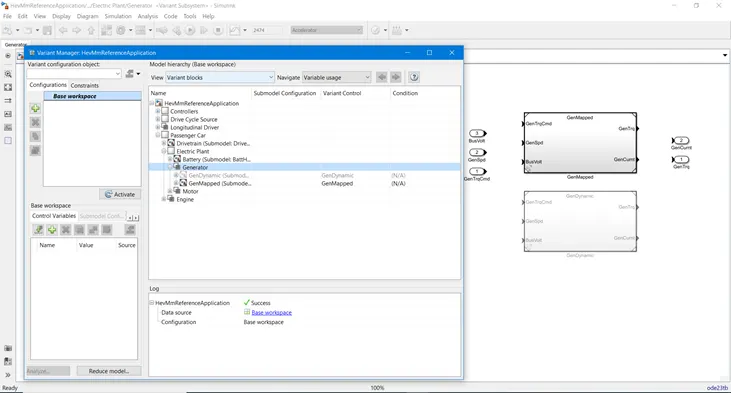
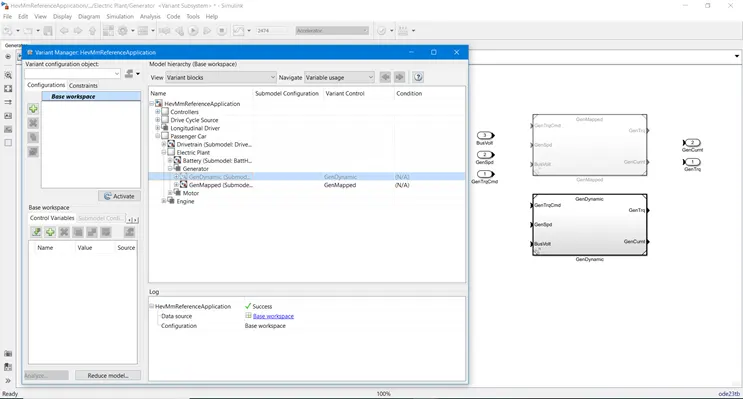
- To change the generator from mapped to dynamic click on view and then click on variant manger a new window will open as seen below :
- Then right click on dynamic and select label mode active choice as shown below :
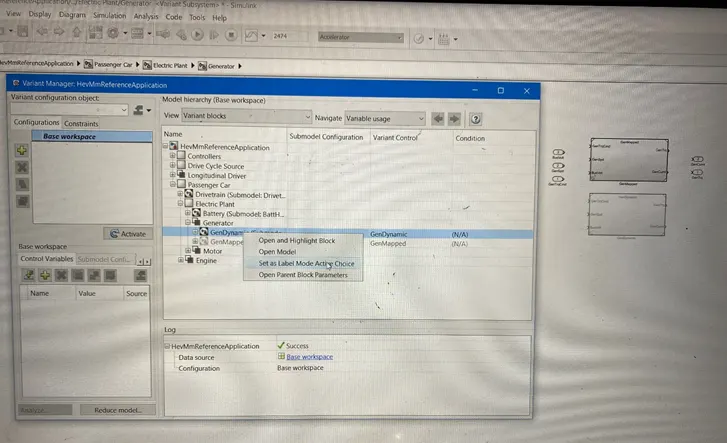
- It is observed that model is changed from mapped generator to dynamic generator as shown below :
- How does the model calculate miles per gallon? Which factors are considered to model fuel flow?
MILES PER GALLON
Miles per gallon is the distance how far the vehicle can travel per gallon of fuel.
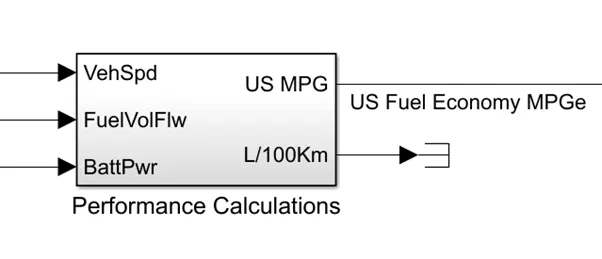
Powertrain blockset has a model that calculates the miles per gallon as shown below:
The factors that affect the model fuel flow are:
- Vehicle speed
- Fuel flow
- Battery power
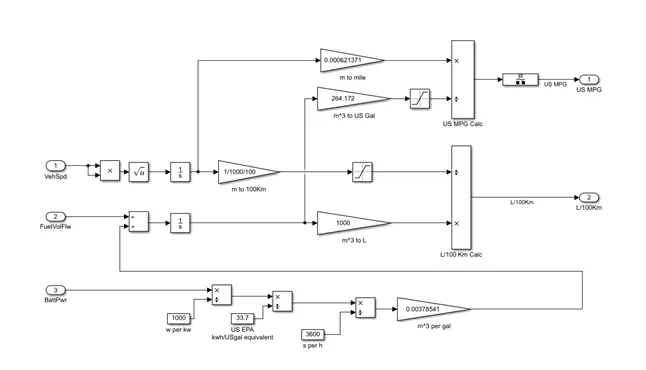
VEHICLE SPEED AND FUEL FLOW:
- To determine the fuel consumption throughout the drive cycle vehicle speed is considered as an important factor.
- Speed is converted into distance by integrating with time.
- The amount of fuel at each moment which is kg/sec is integrated to get mass of fuel which is converted to volume by multiplying by 1000 to get in litres.
- Hence we get the amount of litre consumed to run 100 km.
BATTERY POWER
- The energy of the battery power equivalent to that of the engine is calculated.
- The battery power is then converted to KW by dividing it by 1000.
- Battery power is then converted into energy KWH by multiplying it with time.
- The energy is then converted to U.S Gallon of automotive gasoline by dividing it by 33.7. This is converted to seconds by dividing it by 3600. Hence we have the result in US Gallon per second.
- US Gallon per second is multiplied by 0.00378541 to get the volume of fuel flow in m3 /s.It is then multiplied with 739 (density of gasoline) to get the mass flow rate in kg/s.
- Battery energy equivalent in kg/s is given as input for fuel flow to get the equivalent US Gallon energy and get the miles per gallon.
CALCULATING MILES GALLON
- The distance is converted into miles by multiplying with 0.000621371
- The inputs from the fuel flow which is in m3 is converted into equivalent US Gallons by multiplying with 264.172.
- Then the two inputs of miles covered and equivalent US Gallon is further divided and the final result is in miles per gallon.
- Run the HEV Reference Application with WOT drive cycle. Change the grade and wind velocity in the environment block. Comment on the results.
Hybrid electric vehicles are powered by an internal combustion engine in combination with an electric motor which uses energy stored in the batteries. With the help of this configuration hybrid electric vehicles improves in fuel economy, increases power and also provides additional auxiliary power for electronic devices and power tools.
HEVs run on fuel alone and do not plug in to an electrical outlet to recharge the battery. The charging of the batteries happen during regenerative braking. The electric motor applies resistance to the drivetrain, causing the wheels to slow down. The energy from the wheels turns the motor, which functions as a generator by converting energy into electricity. This electricity is stored in a battery until needed by the electric motor.
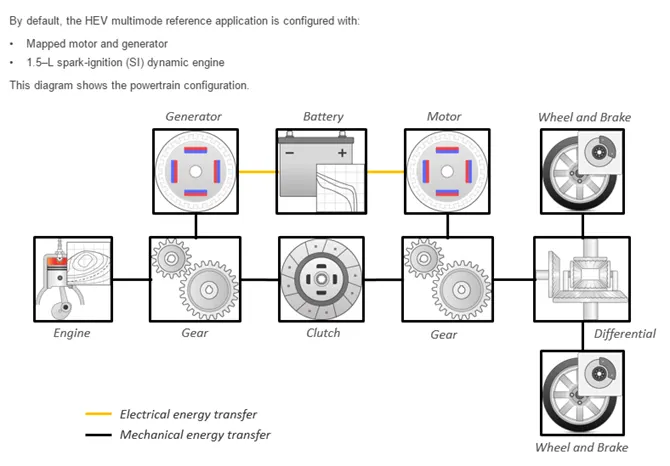
SIMULINK MODEL OF A HYBRID ELECTRIC VEHICLE REFERENCE APPLICATION
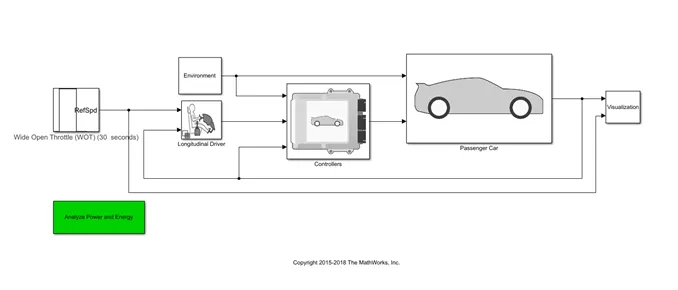
The hybrid electric vehicle reference application model consists of:
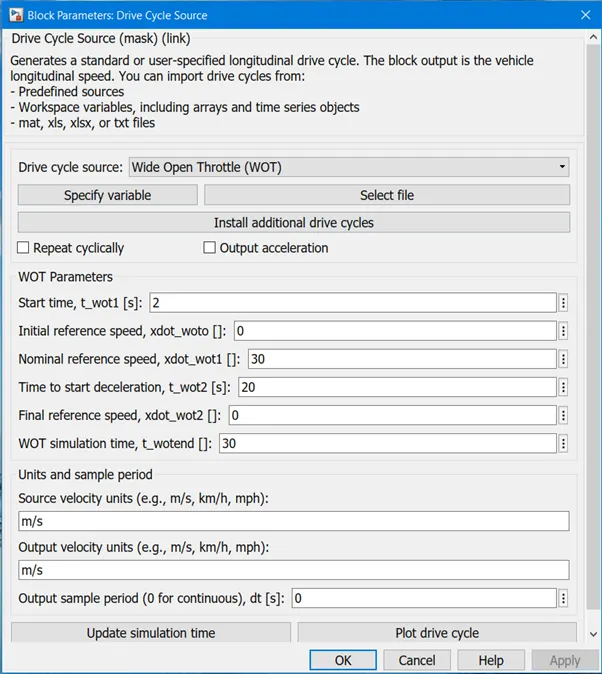
- DRIVE CYCLE SOURCE BLOCK
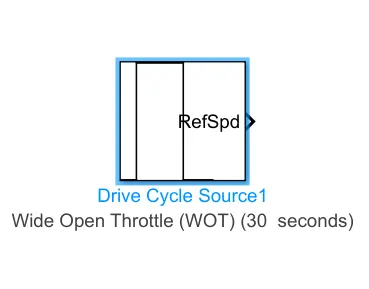
This block generates a user specified drive cycle velocity or a standard drive cycle versus time.
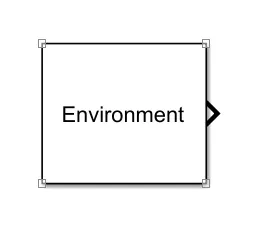
- ENVIRONMENT BLOCK
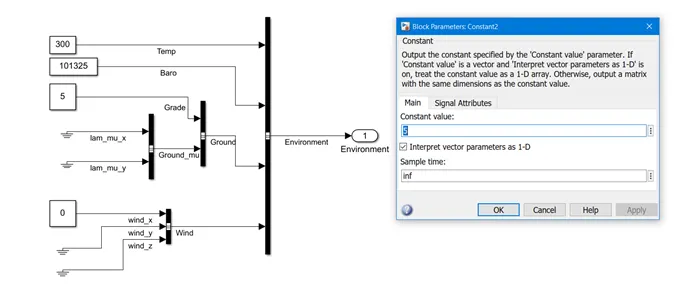
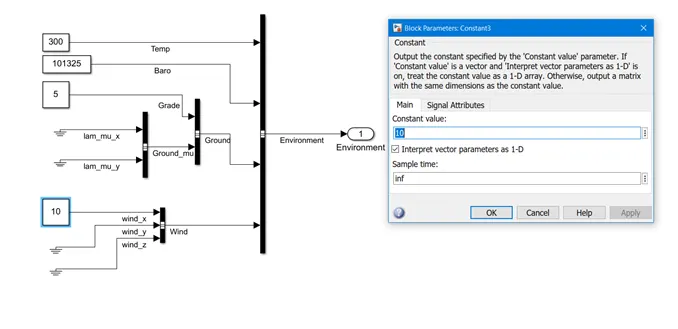
This block creates environmental variables which include grade, wind velocity , atmosphere temperature and pressure .
As per the given question the grade and wind velocity of the hybrid electric vehicle is changed in the environment block as shown below:
- LONGITUDNAL DRIVER SUBSYSTEM
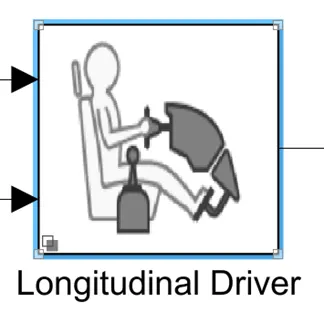
A parametric longitudinal speed tracking controller is used for generating normalized acceleration and braking commands. Which are based on reference and feedback velocities.
- CONTROLLER SUBSYSTEM
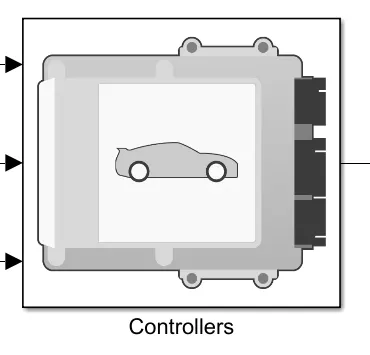
Controller subsystem uses a powertrain control module containing a hybrid control module and an engine control module.
- PASSENGER CAR SUBSYSTEM
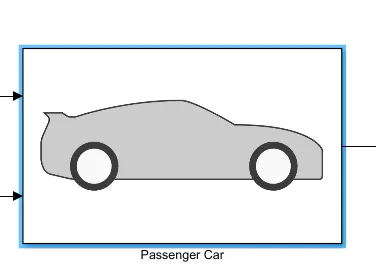
This subsystem contains a hybrid passenger car the contains engine , electric plant and drive train system.
- VISUALIZATION SUBSYSTEM
This block displays the vehicle level performance, battery state of charge, fuel economy and emission results which is useful for component selection analysis.
RESULTS OF THE SIMULATION
Case-1
GRADE – 5%, WIND VELOCITY – 10 m/s
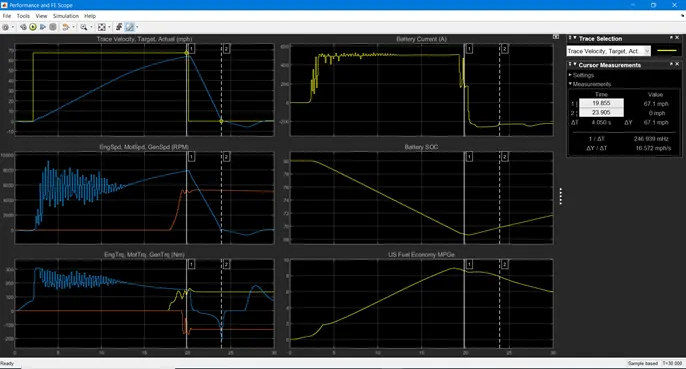
The above image shows the results for the simulation which consists of six different plots.
Cursor measurement helps in reading the results in much better way. The cursor helps to examine the behaviour of other result parameters corresponding to the acceleration of the vehicle.
PLOT 1: TRACE VELOCITY, TARGET, ACTUAL (MPH)
It is a plot of velocity v/s Time for the drive cycle. Traced velocity is given as input command and actual velocity is output. The actual velocity is less than the desired velocity .The desired velocity was 67.1 mph but the actual velocity was 64 mph. The acceleration time to reach 64 mph was 18.056 seconds. The deceleration time from 64 to minimum is 3.843 seconds.
PLOT 2: Engine speed, Motor speed, and Generator speed (RPM)
This plot gives the detailed analysis of the engine, motor and generator speed in r.p.m.
Peak motor speed = 9212 rpm
Peak engine speed = 5336 rpm
Peak generator speed = 5336 rpm
As the engine, motor and generator speed increase, the vehicle speed also increases. It is observed that generator and engine speed reaches the peak values and the battery SOC stars to increase after 20 seconds.
The motor initiates the initial acceleration and is capable to produce enough propulsion power to reach the specified maximum velocity. However, the motor is activated as soon as maximum velocity is achieved, in order to maintain the required velocity of the vehicle both the generator and the engine starts.
PLOT 3: Engine torque, motor torque and Generator torque (Nm)
This plot gives the detailed analysis of the engine, motor and generator torque
Peak engine torque = 161.3 Nm
Peak motor torque = 307 Nm
Peak generator torque = 180 Nm
The drive cycle being the wise open throttle, the motor runs at maximum torque, however the power distribution stabilizes between the motor and the engine due to which the vehicle is able to reach the desired velocity. A negative value for the generator indicates that it is undergoing regeneration.
PLOT 4: BATTERY CURRENT (A)
This plot denotes the power produced by the battery and the reading are in ampere.
The peak current discharge from the battery = 524.1 A
The peak current charging to the battery = 258.8A
With wide open throttle drive cycle, the powertrain draws maximum current from the battery and stabilizes as the conditions are met and the engine is activated. The negative battery current value indicates that it is undergoing regeneration.
PLOT 5: (Battery SOC)
This plot denotes the state of charge of the battery, and also denotes the range of charge used to achieve the desired velocity. The state of charge decreases from 80% to 68.7% of charge in 20 seconds and the charge increases to 71.6 for the next 10 sec.
PLOT 6: (US fuel economy)
This is the fuel efficiency which is denoted in miles per gallon for the corresponding input driving conditions.
According to the given drive cycle (in plot1) the vehicle achieves its maximum speed at 2.125 seconds and the speed is constant till 20 seconds , it is observed that the fuel requirement increases with increase in speed till the speed is constant. As the speed decreases the fuel requirement also decreases as shown in the plot after 20 sec.
Case-2
GRADE – 10 %, WIND VELOCITY – 25 m/s
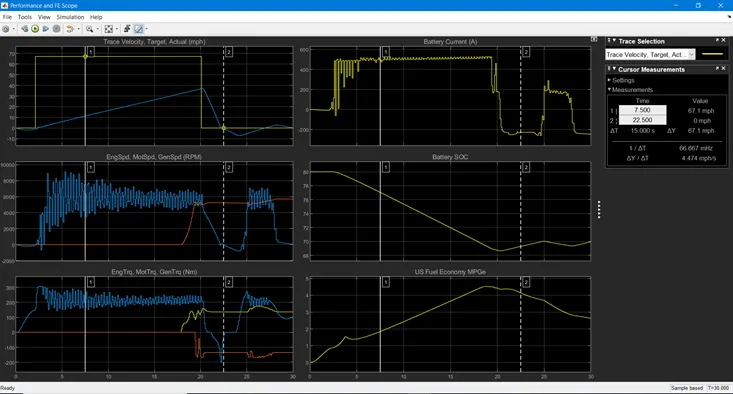
Some changes in the results are observed compared to that of the previous results. Though the drive cycle parameters are the same, some changes are made in the environmental block such as grade angle and wind velocity that leads to changes in the final results.
Plot 1 (Trace velocity target vs actual)
It is a plot of velocity v/s Time for the drive cycle. Traced velocity is given as input command and actual velocity is output. The actual velocity is less than the desired velocity. The desired velocity was 67.1 mph but the actual velocity was 36.8 mph. The acceleration time to reach 36.8 mph was 17.744 seconds. The deceleration time from 36.8 to minimum is 2.105 seconds.
PLOT 2: Engine speed, Motor speed, and Generator speed (RPM)
This plot gives the detailed analysis of the engine, motor and generator speed in r.p.m.
Peak motor speed = 9111 rpm
Peak engine speed = 5350 rpm
Peak generator speed = 5350 rpm
The motor initiates the initial acceleration that produces the required propulsion power to reach the specified maximum velocity, but it is observed that the motor is unable to produce enough propulsion power to reach the desired velocity, thus the engine contributes to the propulsion effort.
PLOT 3: Engine torque, motor torque and Generator torque (Nm)
This plot gives the detailed analysis of the engine, motor and generator torque.
Peak engine torque = 159.4Nm
Peak motor torque = 306.9Nm
Peak generator torque = 169.2Nm
With wide open throttle cycle, the motor runs at maximum torque, however the power distribution stabilizes between motor and the engine as the vehicle reaches the desired velocity. A negative value for the generator indicates that it is undergoing regeneration.
PLOT 4: BATTERY CURRENT (A)
This plot denotes the power produced by the battery and the reading are in ampere.
The peak current discharge from the battery = 526.4 A
The peak current charging to the battery = 259.8 A
With wide open throttle drive cycle, the powertrain draws maximum current from the battery and stabilizes as the conditions are met and the engine is activated. The negative battery current value indicates that is undergoing regeneration.
PLOT 5: (Battery SOC)
This plot denotes the state of charge of the battery, and also denotes the range of charge used to achieve the desired velocity. The state of charge decreases from 80% to 68.6% in 20 seconds. During regeneration the battery SOC increases to 70%.
PLOT 6: (US fuel economy)
This is the fuel efficiency which is denoted in miles per gallon for the corresponding input driving conditions.
According to the given drive cycle (in plot1) the vehicle achieves its maximum speed at 2.125 seconds and the speed is constant till 20 seconds , it is observed that the fuel requirement increases with increase in speed till the speed is constant. As the speed decreases the fuel requirement also decreases as shown in the plot after 20 sec.
CONCLUSION:
- It is observed that with increase in grade and wind velocity, the targeted speed was not achieved.
- With increase in grade and wind velocity the speed reduces considerably.
- Due to resistance offered by the grade angle and the wind velocity, the rpm of the motor is less which is evident from the plot.
- The battery current was found to be the same in both the cases.
- The battery discharge was found to be slightly high in Case-2.
- Miles per Gallon is less in case-2 than case-1 due to grade and wind velocity.
- Keeping all other parameters same, compare the simulated results of hybrid and pure electric powertrains.
Electric vehicles have an electric motor instead of an internal combustion engine. Electric vehicles have a large traction battery pack that powers the motor and must be plugged into a charging station as it runs on electricity. Electric vehicle does not emit any exhaust gases from tail pipe.
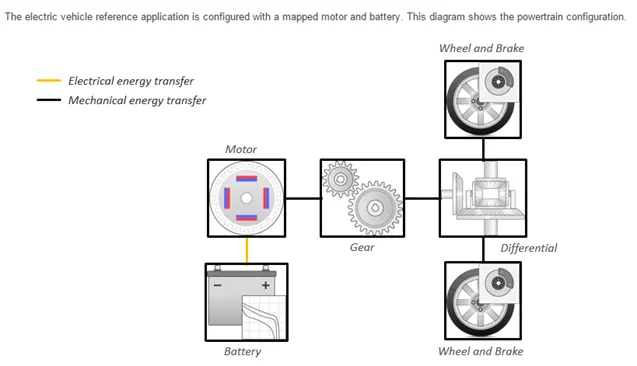
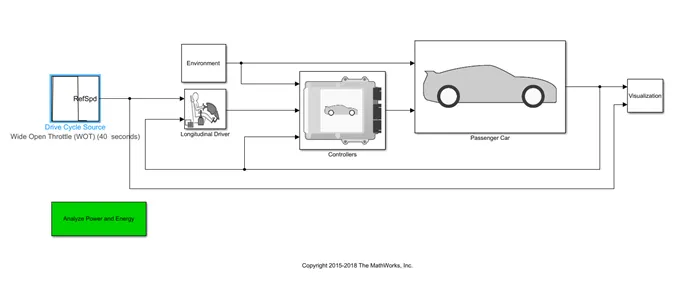
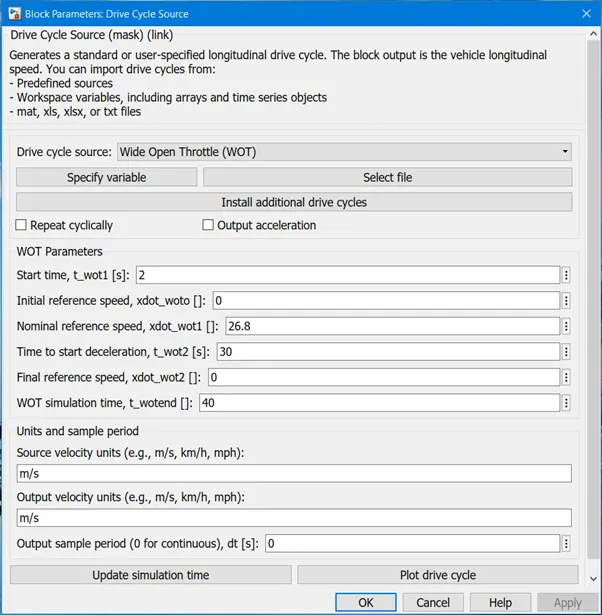
SIMULINK MODEL OF A FULL ELECTRIC VEHICLE
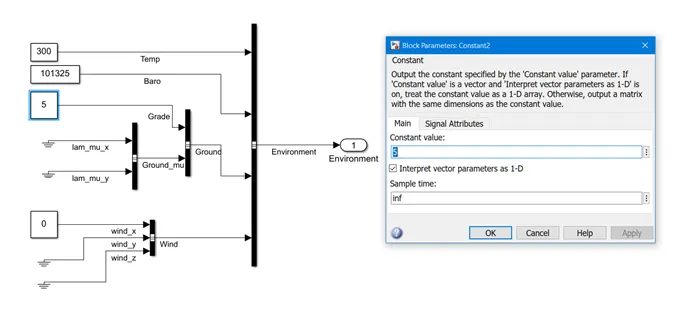
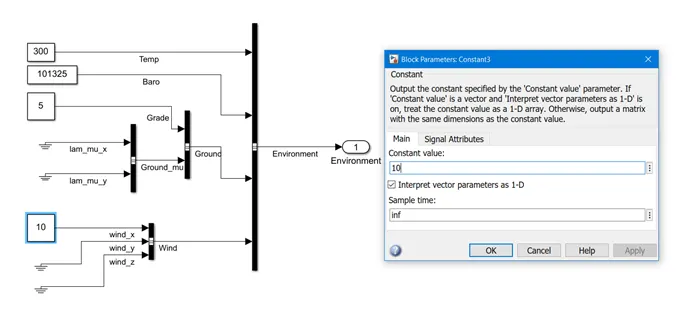
The grade and wind velocity of the electric vehicle is changed in the environment block as shown below:
RESULTS OF THE SIMULATION
- ELECTRIC VEHICLE
GRADE – 5 %, WIND VELOCITY – 10m/s
Plot 1 (Trace velocity target vs actual)
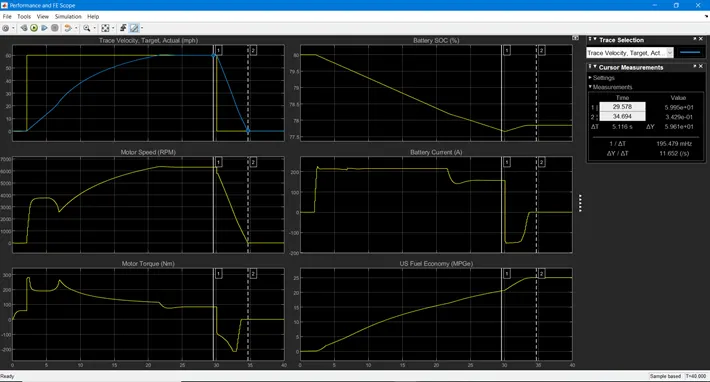
It is a plot of velocity v/s Time for the drive cycle. Traced velocity is given as input command and actual velocity is output. The desired velocity was 59.95 mph but the actual velocity was 59.95 mph. The acceleration time to reach 59.95 mph was 27.537 seconds. The deceleration time from 44.16 to minimum is 4.80 seconds.
PLOT 2: Motor speed (RPM)
The plot shows the changes in the motor speed
Peak motor speed = 6309 rpm
PLOT 3: Motor Torque (RPM)
This plot shows the changes in the motor torque
Peak motor torque = 280 Nm
A negative torque is observed after 30 seconds as it is undergoing regeneration.
PLOT 4: Battery SOC
This plot denotes the state of charge of the battery, and also denotes the range of charge used to achieve the desired velocity. The state of charge decreases from 80% to 77.85% in 40 seconds.
PLOT 5: BATTERY CURRENT (A)
It shows the battery current values and its changes for various acceleration inputs according to the drive cycle.
The peak current discharge from the battery = 225.4A
It is observed that after 30 seconds the battery current goes negative due to regeneration.
PLOT 6: (US fuel economy)
This is the fuel efficiency which is denoted in miles per gallon for the corresponding input driving conditions. Hence there is no fuel in pure electric vehicle. However this gives equivalent battery energy required that of the fuel energy and calculates fuel efficiency.
- HYBRID ELECTRIC VEHICLE
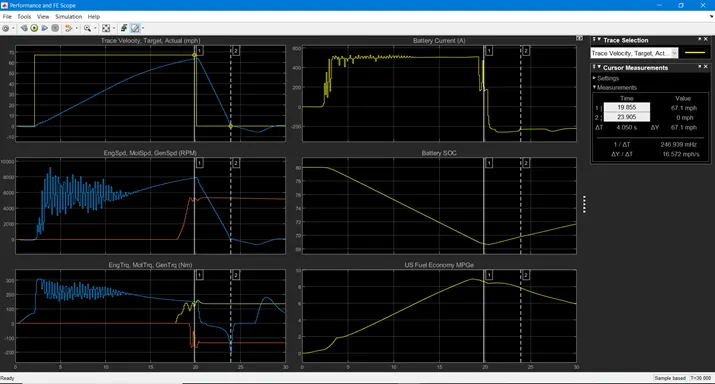
GRADE – 5 %, WIND VELOCITY – 10 m/s
Comparison and conclusion for electric vehicle vs hybrid vehicle
- Less top is achieved in electric vehicle compared to HEV (hybrid electric vehicle).
- Battery SOC plot depicts that the efficiency of the electric vehicle is higher as compared to HEV
- Efficiency of electric vehicle is higher than HEV in terms of miles per gallon .
- The electric vehicle produces zero emissions whereas hybrid vehicle produces gas emission.
RESULTS
|
PARAMETERS |
ELECTRIC VEHICLE |
HYBRID ELECTRIC VEHICLE |
|
TOP SPEED (MPH) |
59.95 |
64 |
|
CURRENT (A) |
225.4 |
524.1 |
|
MOTOR ( RPM) |
6309 |
9212 |
|
SOC |
80 - 77.85% |
80 - 71.6% |
|
MOTOR TORQUE (Nm) |
280 |
307 |
CONCLUSIONS
- Mapped model requires less time for simulation and is less accurate whereas dynamic model is more accurate and requires more simulation time.
- Miles per gallon uses data from vehicle speed, battery power and fuel flow
- Increase in gradeability and wind velocity causes the vehicle to achieve less acceleration and top speed
- In HEV initially the fuel economy is higher but it gradually falls down because of engine and generator load. Hence EV powertrain are more economical as compared to HEV.