Week-4 Challenge WOT Condition Part-2
Week-4 Challenge WOT Condition Part-2 :
Problem Statement 1: What is the difference between the mapped and dynamic model of engine, motor, and generator? How can you change the model type?
Answer: By a mapped model basically refers to a model with a precalculated dataset for which the output values are readily available for the corresponding inputs. This basically means we get a fixed output value for a fixed input value. The values here are mapped and stored as data points that are calculated using an actual dynamic model in practice.
A dynamic model performs a real-time simulation of components that actually takes place in an original system to generate an output, depending upon random input situations. In short, both the mapped and dynamic models take in the same input variables and give out the same output variables, but the only difference lies in the way how the output data is generated in each case. A mapped model functions similar to lookup tables as the outputs are stored for corresponding inputs. But the dynamic model uses real-time simulations of various subsystems to generate the outputs.
To give an idea that how both of the systems are present in the same model is possible, either one of them is active or being simulated at a time. Here, the motor block of a fully electric vehicle is given, which is available as an example model file in the powertrain block set of Matlab.
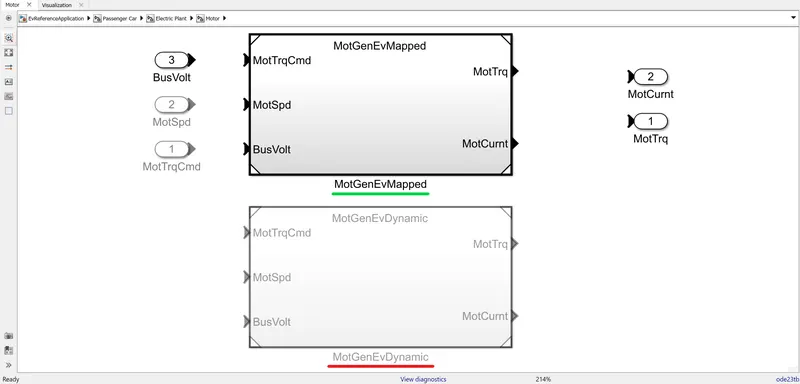
Figure 1
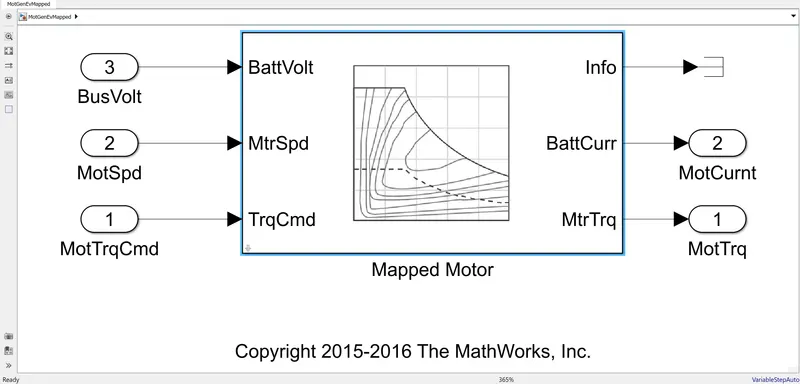
Figure 2
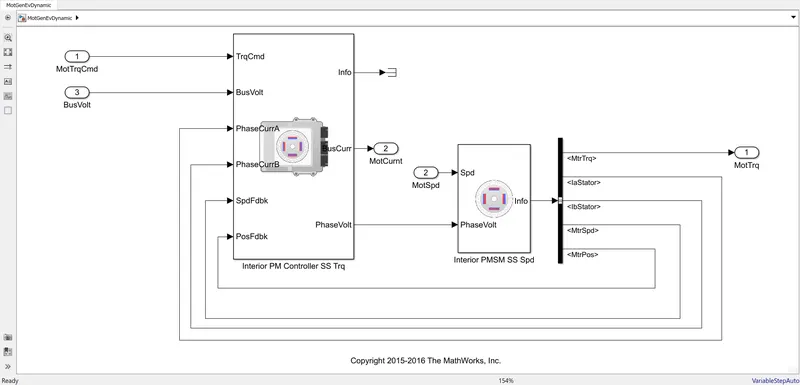
Figure 3
From Figure 1, we can see how the dynamic model and mapped model are co-existing in the motor block set with each other but only either of them is participating in every specific simulation. At this time the mapped model is participating, is underlined by a green line, and the inactive dynamic model for this specific simulation is underlined by a red line. In Figure 2 we can see that it is operated mainly by getting the required information from a lookup table itself. On the other hand, if the dynamic model was used then it has to calculate the output values for random input values in real-time. Figure 3 shows the set-up for the dynamic model of the motor block. The current model is simulated based on the mapped model of the motor and one can change it to the dynamic model or can switch between the two by the following step:
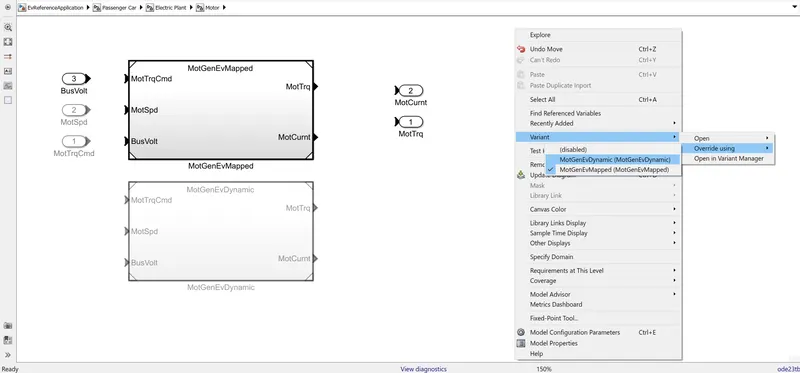
Figure 4
And the same kind of scenario will happen for the engine or the generator. Basically, every model which can be used both the dynamic model and the mapped model at a time will have the same options and can be switched between them like that.
Problem Statement 2: How does the model calculate miles per gallon? Which factors are considered to model fuel flow?
Answer: Since the question was not clear that what model should I take reference from to answer this one, I have taken the "Hybrid Electrical Vehicle Input Power-Spilt Reference Application" is used for addressing the same problem statement.
Now, the path to find out how the fuel economy is calculated here is HevipsReferenceApplication --> Visualization --> Performance Calculations. First, a complete diagram is given then a graphical explanation of the same is shown to have a brief idea about the calculations, with parameters and units.
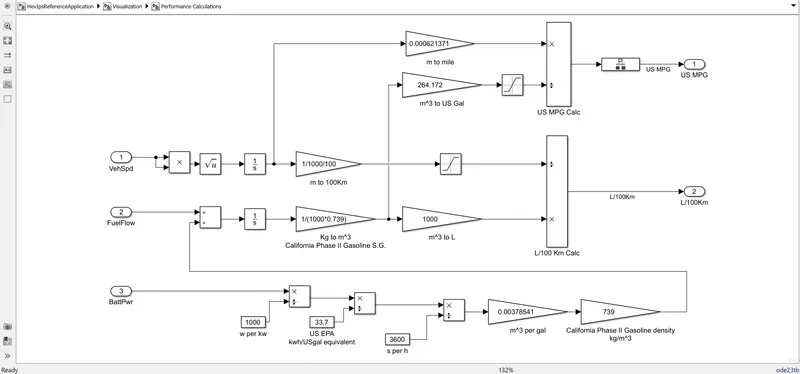
Figure 5
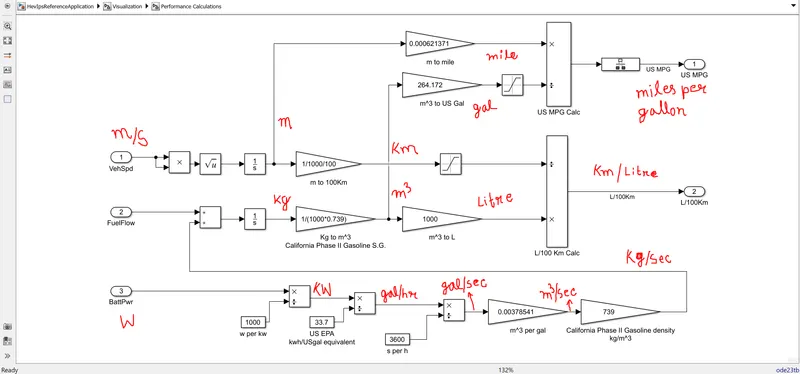
Figure 6
From figure 6 we can see that with the help of 3 inputs we are getting our only output which is the mileage, but in two different units. The Inputs are Vehicle Speed, Fuel Flow, and Battery Power; the output we seek is the fuel economy. Since it is a hybrid vehicle, both the fuel and battery contribute to its capability of covering distances i.e. its mileage or fuel economy. The battery power is converted from Watts to Kg/s of equivalent California Phase II US gasoline, which when burned gives the same power as the battery input. Both these sources of power are added in Kg/s and integrated to find out the entire equivalent fuel consumed in KGs which is converted to volume consumed. The entire distance traveled is further divided by the volume consumed for that distance. Factors that are required to model fuel flow are battery power, conversions from watt to cubic meter per gallon because it is a hybrid electrical vehicle. Like Toyota Prius etc.
The unit miles per gallon is a USA standard unit and L/100Km is used by most of the European countries and in other countries like China, Australia, South Africa, etc.
Problem Statement 3: Run the HEV ReferenceApplication with WOT drive cycle. Change the grade and wind velocity in the environment block. Comment on the results.
Answers:
To perform the task and get output results "Hybrid Electric Vehicle Multimode Application Reference" is simulated from the Matlab Powertrain block.
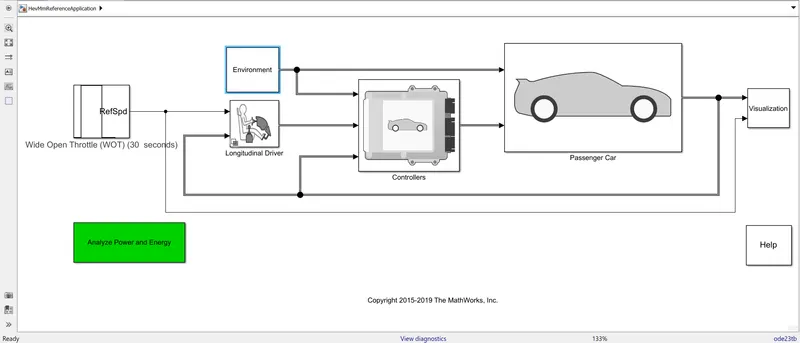
Figure 7
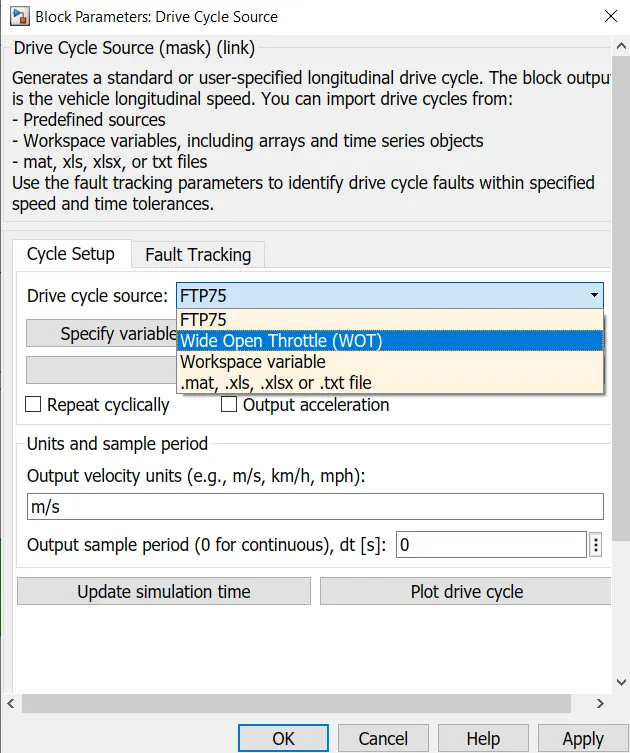
Figure 8
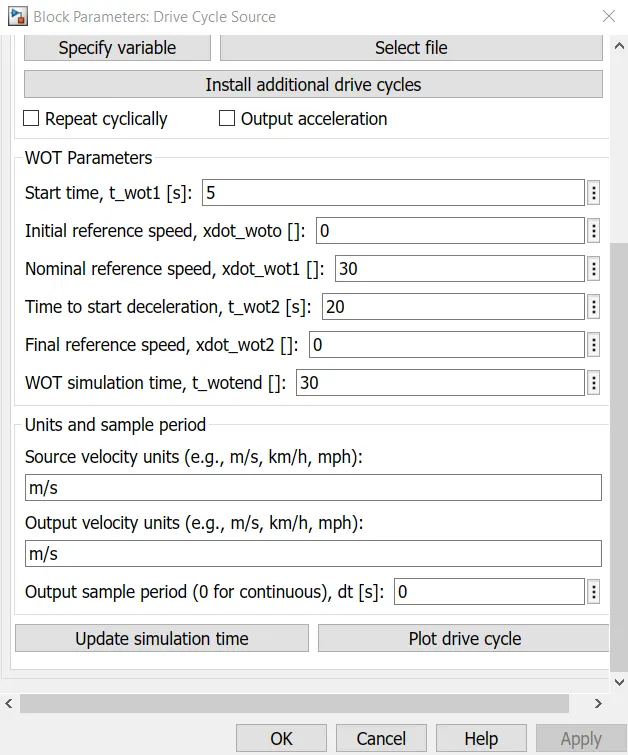
Figure 9
By editing the grade and wind velocity values we got four different results which are shown and also explained briefly below:
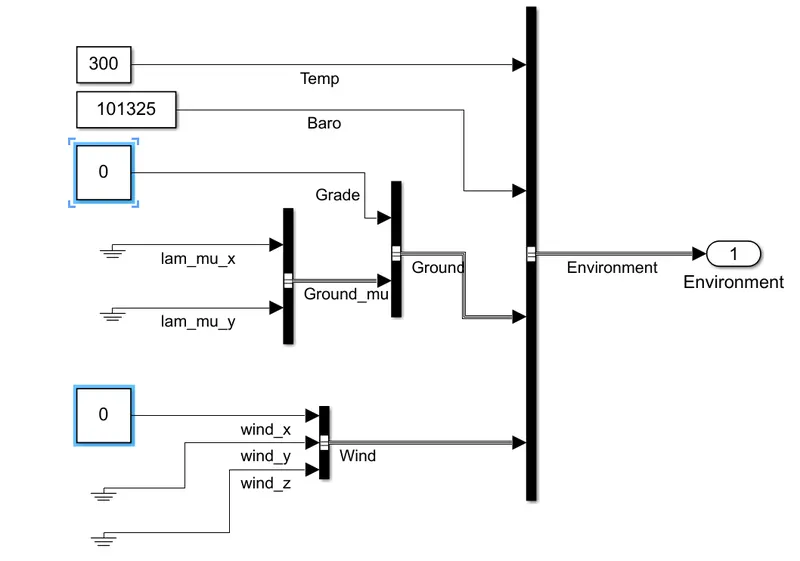
Figure 10
The parameters which are to be altered: Grade & Wind Velocity.
(I) Grade 0, Wind Velocity 0 :
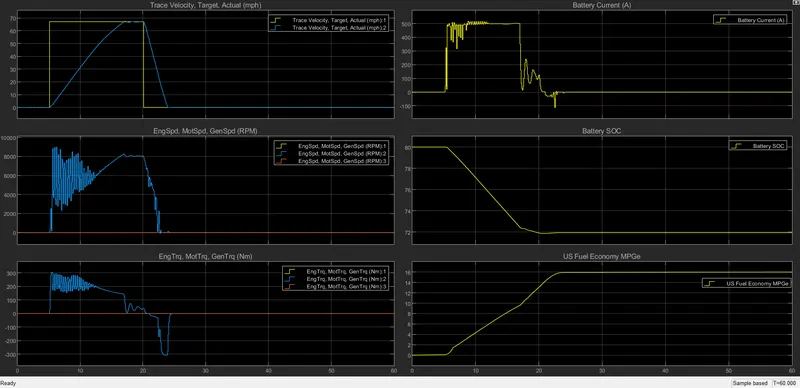
Figure 11
(II) Grade 5, Wind Velocity 10 :
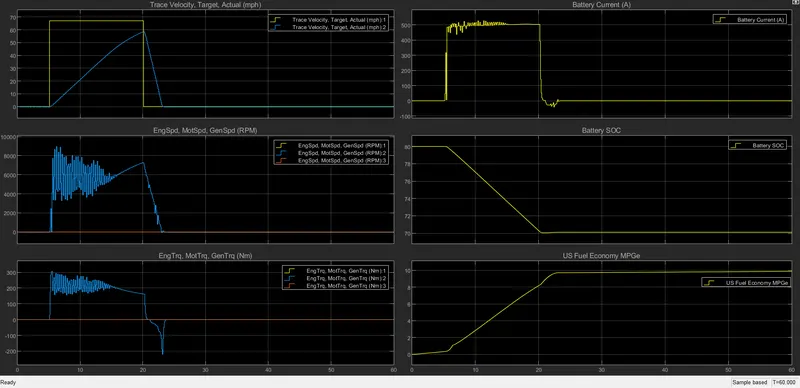
Figure 12
(III) Grade 10, Wind Velocity 5 :
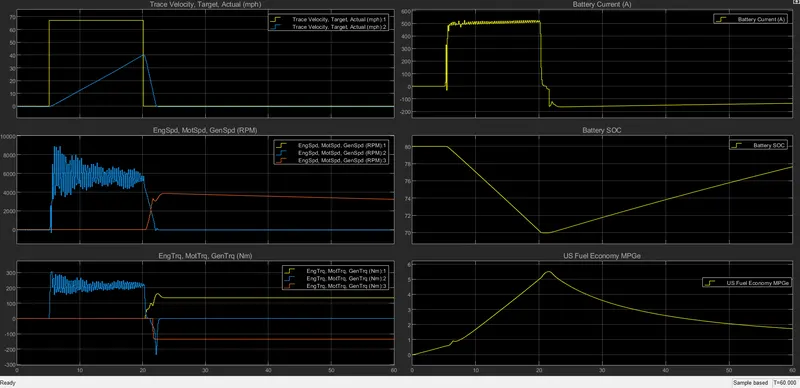
Figure 13
(IV) Grade 10, Wind Velocity 10 :
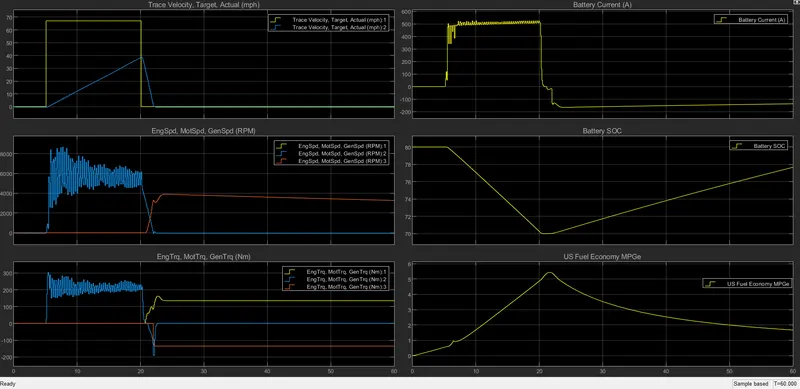
Figure 14
(V) Grade 10, Wind Velocity 40 :
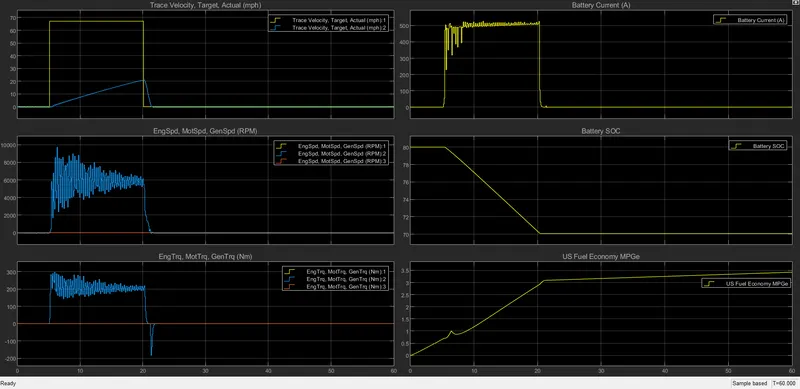
Figure 15
Discussion: From the simulations, a total of 6 types of data are monitored which are Velocity of the vehicle with the desired velocity, Speed of Engine-Motor-Generator, Torque production of Engine-Motor-Generator, Battery Current, Battery SOC, and Fuel economy.
From fig 11, velocity achieved the desired value well enough due to the absence of both grade and wind velocity values( are zero). But when the two factors are present there like in fig 12, it can be seen from the graph that battery power is not enough to meet the requirements of the grade and wind velocity. So then the Engine kicks in to provide the extra power for the vehicle to maintain its speed. When the vehicle is accelerating the battery current is also increasing. When the velocity is constant the current requirement also becomes constant. When the deceleration starts the battery current becomes negative indicating regenerative braking. The battery SOC keeps on depleting until regenerative braking starts; where the latter one increases the SOC. Also, it can be seen that fuel economy is increasing of the vehicle because of this regenerative braking and charging of battery; which ultimately gives us the ability to cover more no of miles.
Initially, only a motor is used to start the vehicle as the motor has high initial torque. Later generator (red graph) kicks in charging the battery when SOC drops below 70%. The engine graph can't be seen as always cause it has overlapped with the generator most of the time. From figs 13 & 14, we can see the motor torque is high initially (blue line), and then the engine kicks in at a later stage (yellow line). Generator torque (red line) is negative as its charging the battery. These are here present because the grade and wind velocity values demand more power from the vehicle.
Higher the grade and wind velocity values, the more difficult for the vehicle to keep up with its desired velocity path. From the graphs, it is seen that higher values of these two parameters give the vehicle greater challenge and so the vehicle ends up not achieving the desired speed as the trace velocity graph, even with the full-throttle applied. The main observation we can see that grade value is dominant here cause a change in this value slightly can give us a different result altogether. One can see from fig 13 and 14 are similar due to the same grade value 10 but with a different wind velocity of 5m/s and 10m/s. To see the wind velocity contribution on the vehicle performance, the wind velocity is given a value of 40 m/s in figure 15; the clear difference in the highest velocity achieved by the vehicle during the simulation, which is way less than what we had in figure 14.
Problem Statement 4: Keeping all other parameters the same, compare the simulated results of hybrid and pure electric powertrains.
Answers:
A hybrid electric vehicle (HEV) is a type of hybrid vehicle that combines a conventional internal combustion engine (ICE) system with an electric propulsion system (hybrid vehicle drivetrain). The presence of the electric powertrain is intended to achieve either better fuel economy than a conventional vehicle or better performance. There is a variety of HEV types and the degree to which each function as an electric vehicle (EV) also varies. The most common form of HEV is the hybrid electric car, although hybrid electric trucks (pickups and tractors) and buses also exist.
(Toyota Prius)
An electric vehicle (EV), also called electrics is a vehicle that uses one or more electric motors or traction motors for propulsion. An electric vehicle may be powered through a collector system by electricity from off-vehicle sources or may be self-contained with a battery, solar panels, fuel cells, or an electric generator to convert fuel to electricity. EVs include, but are not limited to, road and rail vehicles, surface and underwater vessels, electric aircraft, and electric spacecraft.
(Nissan Leaf)
(I) Grade 0, Wind Velocity 0 :
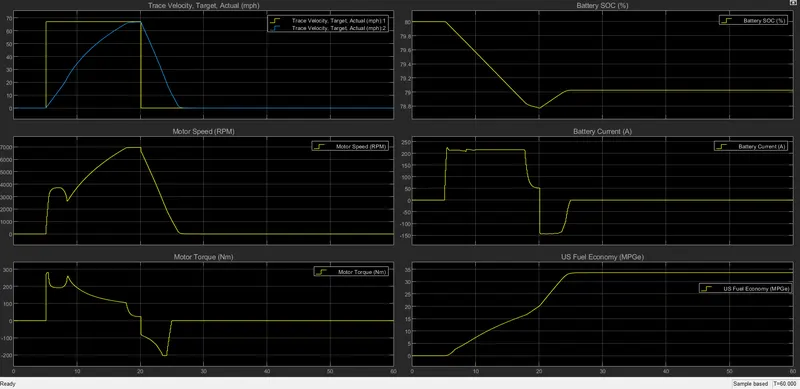
Figure 16
(II) Grade 5, Wind Velocity 10 :
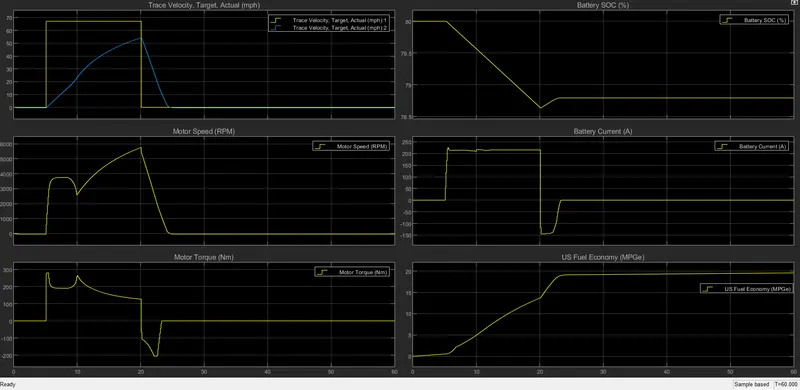
Figure 17
(III) Grade 10, Wind Velocity 5 :
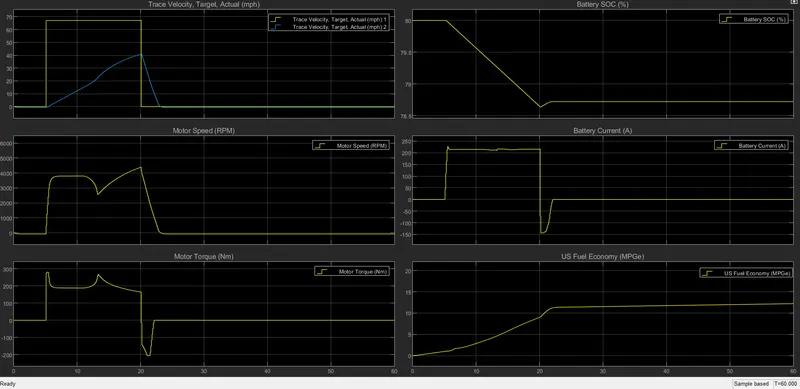 Figure 18
(IV) Grade 10, Wind Velocity 10 :
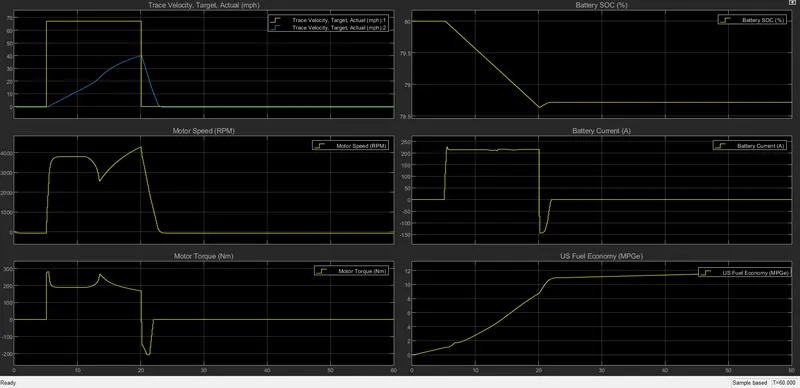 Figure 19
(V) Grade 10, Wind Velocity 40 :
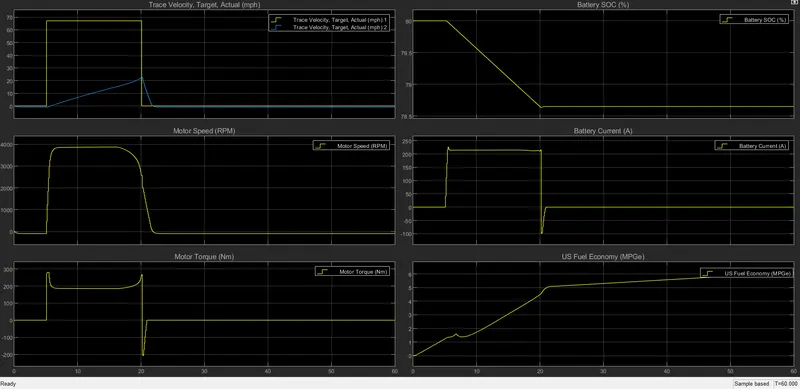
Figure 20
Discussion:
The "EV Reference Application" is simulated and it is given the same five sets of values are given for the grade and wind velocity.
From fig 16 and fig 17 (target and actual velocity graph) performance is almost the same. the reason is the fact that in that particular region only motor was operating so the performance in both EV and HEV is similar.
The battery current is drawn by HEV initially is up to 500 A and later decreases to 200 A but in the range of 500 A to -200 A(Regen.) in total. in the case of EV, it is between 200 A to -100 A. This can be attributed to the fact that initially, the only motor takes all the load and later engine kicks in so the motor load drop thus current drawn by the motor reduces. And during the deceleration, it is seen that negative current (regenerative braking) flows for a longer time in HEV as compared to EV. So we can say that regenerative braking is more aggressive in HEV.
SOC improvement of almost 18% is seen in HEV during deceleration and only a very small amount of improvement can be seen in EV during deceleration. Motor torque and motor speed are stable in EV and they keep fluctuating a lot in HEV during the starting. Also, the peak RPM of the motor in EV is less than HEV. These differences can be attributed to the fact that the battery power of EV is more than HEV.
In totality, the fuel economy of EV is significantly greater than HEV. This is because an electric motor is more efficient than an engine.
It is also noticeable that top speed in EV is less because of the higher power demand required for the vehicle with greater grade and wind velocity value is better supplied by the HEV than its EV counterpart; which is clearly seen from fig 19 & 20.
Conclusions: All the problem statements are successfully answered and all the required conceptual explanations and graphs are provided.