Week-4 Challenge WOT Condition Part-2
PART 1
AIM: To differentiate between mapped and dynamic model of engine, motor and generator and find how to change model type.
BODY:
Mapped model:
1.Model uses a set of steady-state lookup tables to characterize engine performance.
2.The tables provide overall characteristics (e.g. Engine characteristics), including actual torque, fuel flow rate, BSFC, and engine-out exhaust emissions.
3.It is used for quasi steady-state simulations.
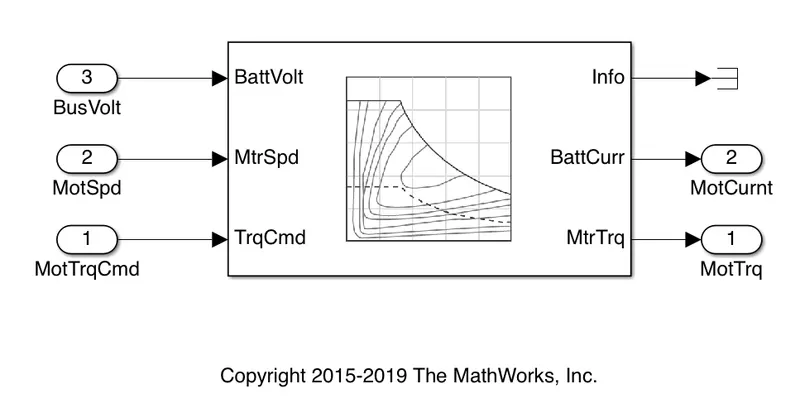
Example of the mapped model - mapped motor
Dynamic model:
1.Model decomposes the component behaviour into characteristics (e.g. Engine characteristics) that are separated into lower-level components.
2.By combining components in this way, the models capture the dynamic effects.
3.It is used when we need a more detailed dynamic model and have component-level data and also if we want to analyse the impact of individual components on the overall performance.
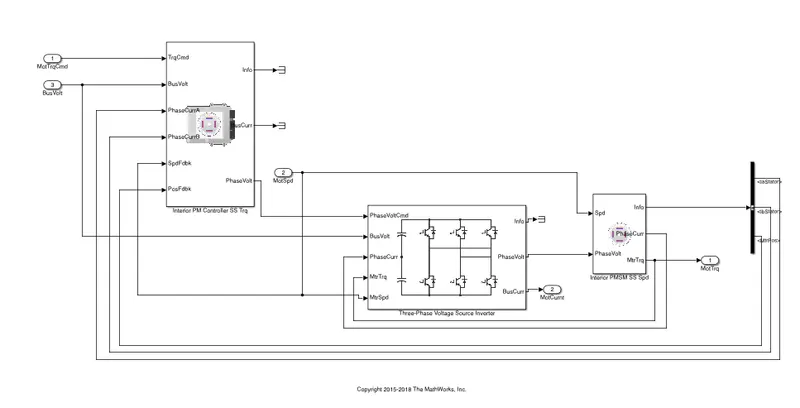
Example of the dynamic model - dynamic motor
To change the model type in the simulation model
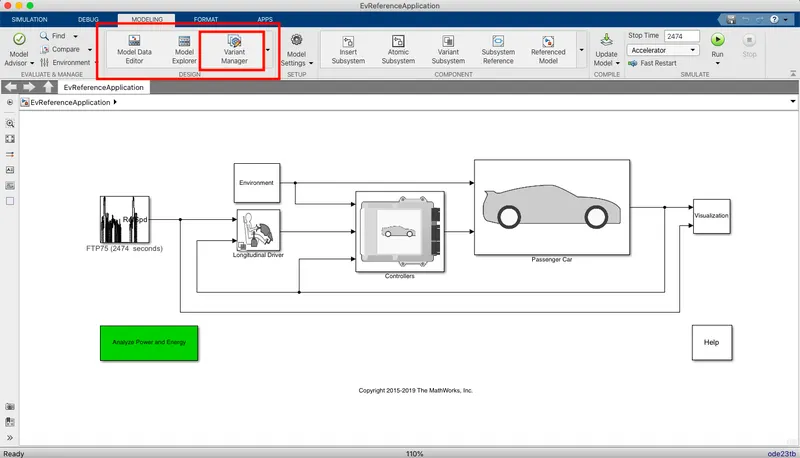
1.Variant manager present in the modeling tab is used.
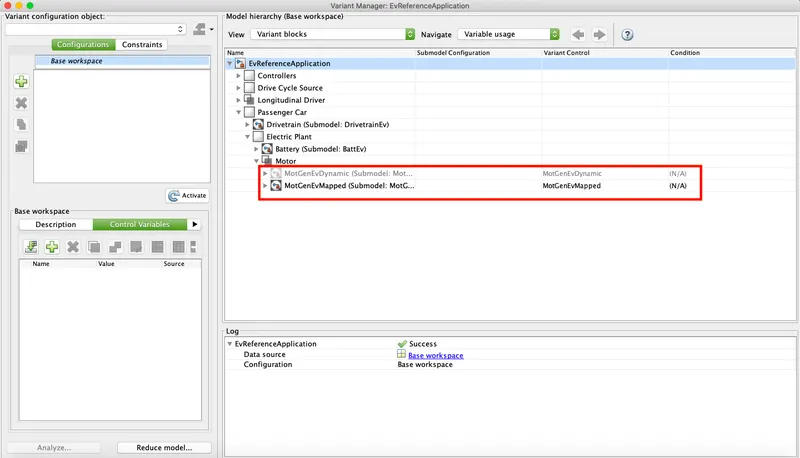
2.Under variant manager we can change the vehicle parameters like motor to be dynamic or mapped.
Part 2
AIM: To study the method used by the model to calculate miles per gallon.
BODY:
The model under consideration is HEV reference vehicle.
US Fuel Economy MPGe calculations are done with the help of below block.
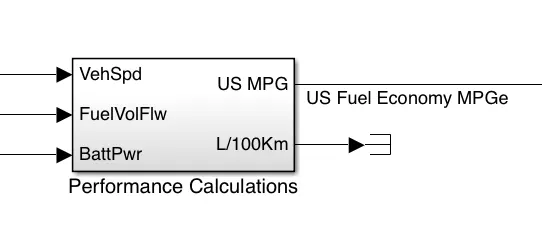
INPUTS:
1.VehSpd - Speed of the vehicle.
2.FuelVolFlw - Volume of fuel used by the engine.
3.BattPwr - Power in watts used by the motor.
OUTPUT:
1.US Fuel Economy MPGe - Plot b/w Miles per gallon & duration of the simulation.
WORKING:
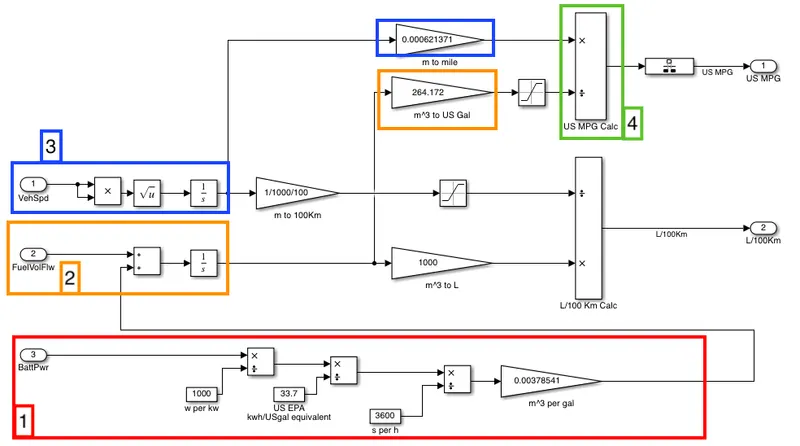
1.Battery power data is used to calculate the amount of power in watts used, it is then converted into kilo watts by dividing it by 1000 and kWh is converted to USgal equivalent by dividing it by 33.7(1 gallon of gasoline is equal to 33.7 kWh).
2.It is then added to the amount of fuel used by the engine and integrated(added) for the whole duration of the simulation, it is then converted to US gal by multiplying it with 264.172.
3.Vehicle speed is integrated for the whole duration of the simulation to find the total distance travelled by the vehicle and it is converted into miles.
4.The distance travelled by the vehicle in miles is divided by the US gallon equivalent and is plotted wrt time.
CONCLUSION:
As we can see how the US MPGe is calculated in case of HEV, if the vehicle is pure EV Only battery power is used to calculate the miles per gallon.
Part 3
AIM: Run the HEV ReferenceApplication with WOT drive cycle.
OBJECTIVE:
Change the grade and wind velocity in the environment block and compare it with the default conditions.
BODY:
HEV ReferenceApplication model:
1.The model can be opened from the MATLAB official site.
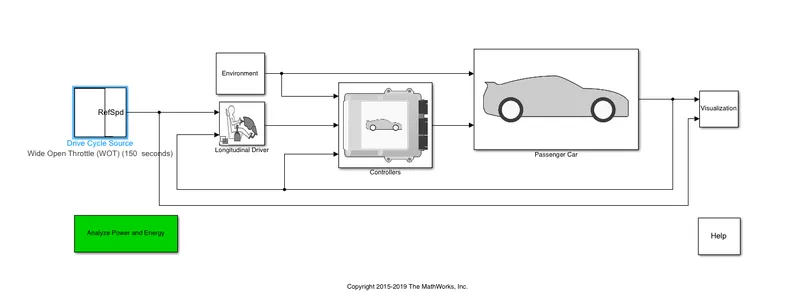
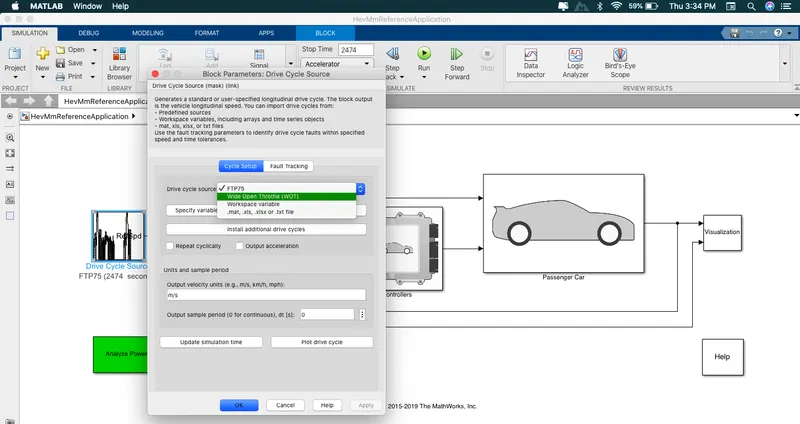
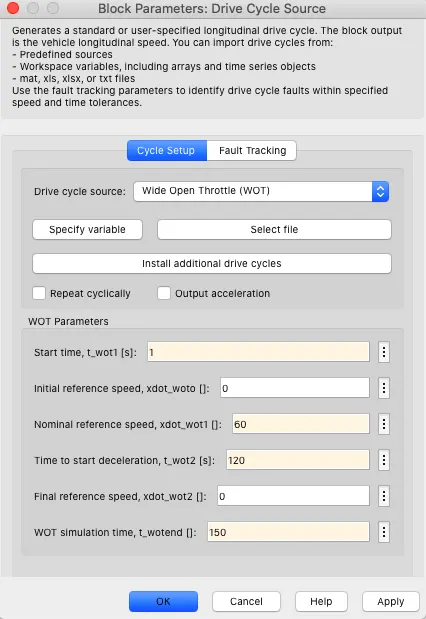
2.After opening the model, Wide Open Throttle (WOT) is chosen as the drive cycle source with the below given characteristics.
SIMULATION:
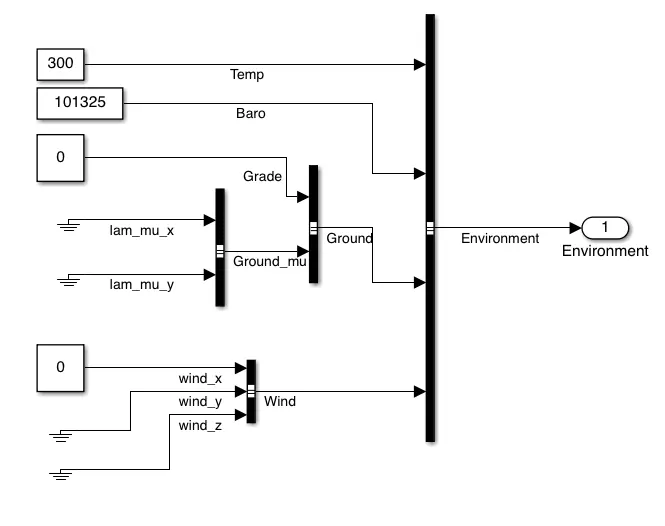
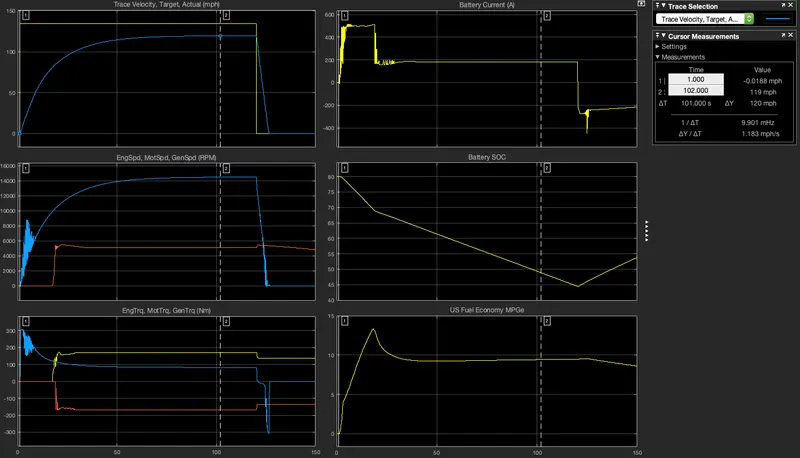
Case 1:The Grade is 0 & wind velocity is 0 mps
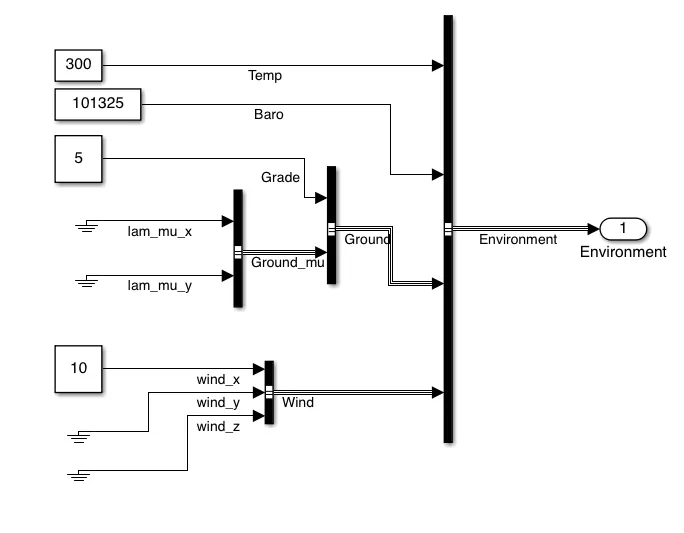
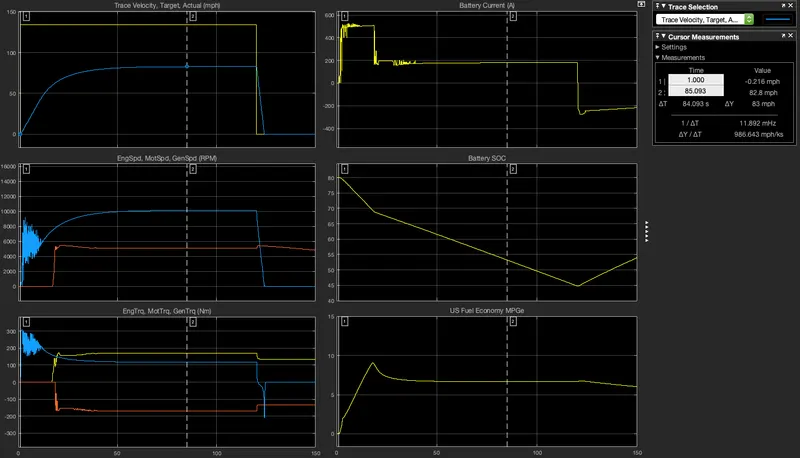
Case 2: The Grade is 5 degrees & wind velocity is 10 mps
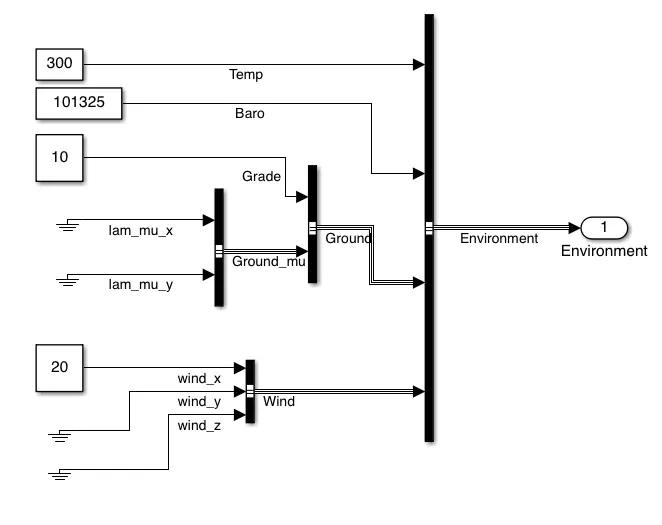
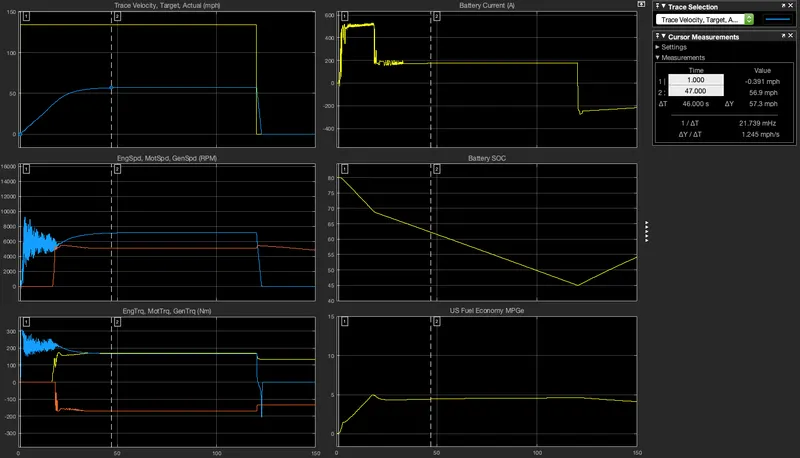
Case 3: The Grade is 10 degrees & wind velocity is 20 mps.
RESULT:
1. The Grade is 0 & wind velocity is 0 mps.
2. The Grade is 5 degrees & wind velocity is 10 mps.
3.The Grade is 10 degrees & wind velocity is 20 mps.
| CASE 1 | CASE 2 | CASE 3 | |
| Acceleration time(s) | 101 | 84 | 46 |
| Maximum velocity achieved (mph) | 120 | 83 | 57.3 |
CONCLUSION:
1.Maximum speed achieved decreases because of increase in drag force(aerodynamic force) with increase in wind velocity and also hill climbing force(gradient force) increases because of increase in gradeability.
2.US fuel Economy MPGe also decreases because the distance travelled in the same time is less.
3.There are no significant change in Battery SOC & Battery current.
Part 4
AIM: Keeping all other parameters same, compare the simulated results of hybrid and pure electric powertrains.
BODY:
Both the model can be opened from the official website of MATLAB.
1.Pure EV
Diagram:
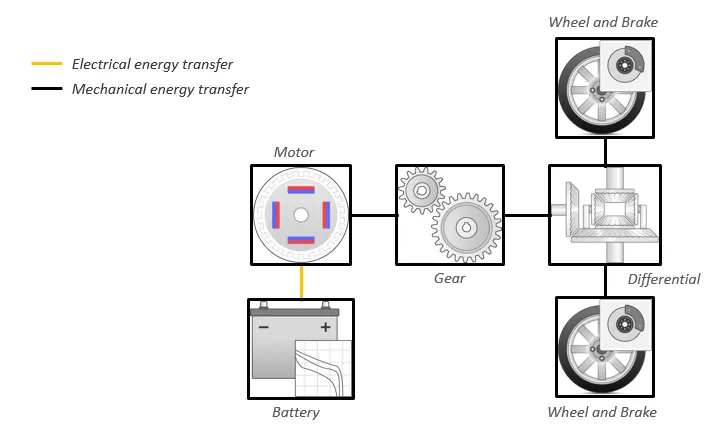
The battery is connected to the Motor, the Motor control module tells how much current should pass to the motor and the motor provides the required torque to the wheels through the differential and reduction gears. When the car is decelerating the motor recharges the battery through regenerative breaking.
Simulink model:
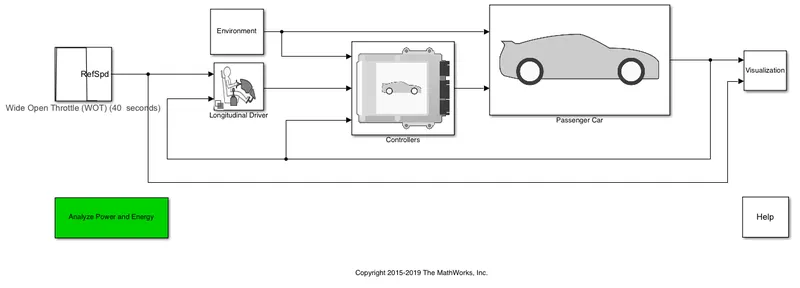
2.HEV P2
Diagram:
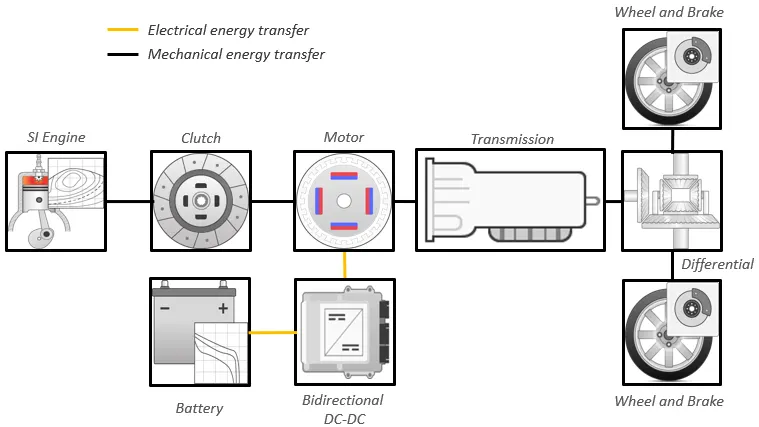
It is a series configuration of HEV in which the engine is connected to the motor with the help of clutch and facilitates the motor for providing torque to the transmission.
When the car is decelerating the onboard bidirectional DC-DC recharges the battery.
Simulink model:
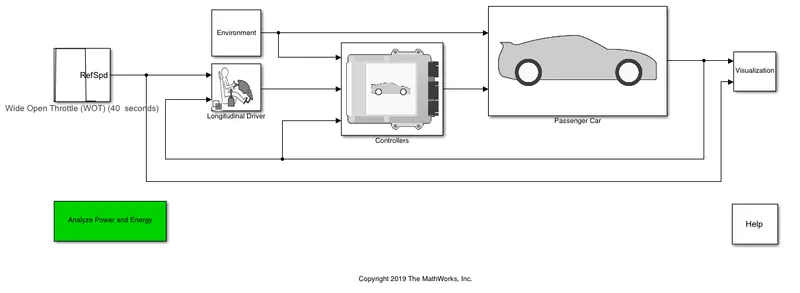
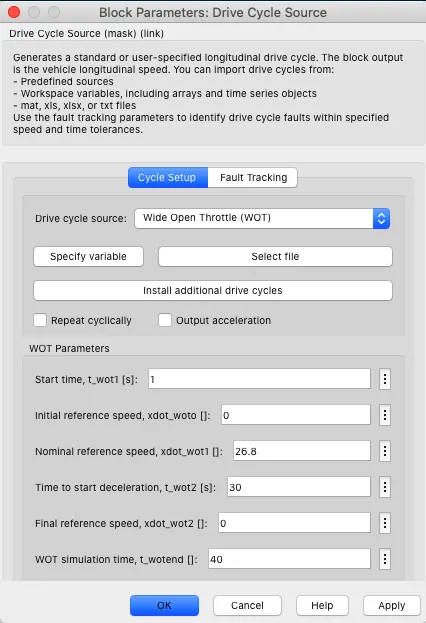
Operating conditions: Both the model are running on the default conditions for 60 seconds. Which are shown below.
RESULT:
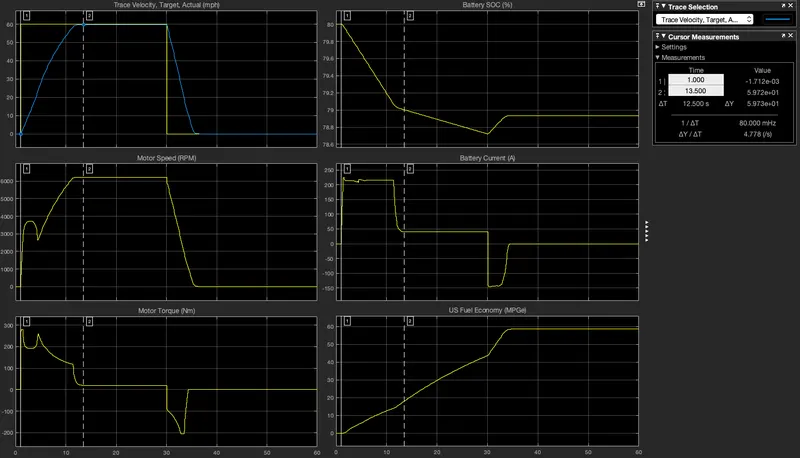
1.EV
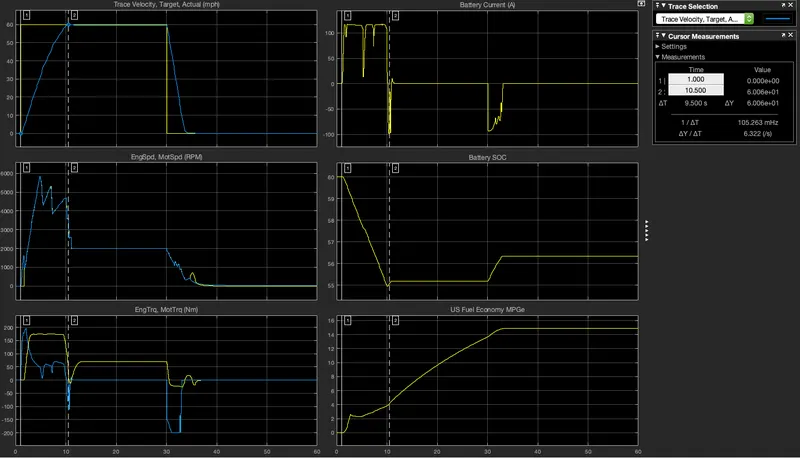
2.HEV P2
Comparision:
|
Specifications |
EV |
HEV P2 |
|
Maximum velocity |
59.73 mph |
60.06 mph |
|
Time taken to reach maximum velocity. |
12.5 seconds |
9.5 seconds |
|
Acceleration |
2.12 metre/second2 |
2.80 metre/second2 |
|
US Fuel Economy MPGe |
High (max. 58) |
Low (max. 15) |
|
Max. Battery SOC change |
1.3% |
5% |
|
Max torque |
280 Nm |
200 Nm |
CONCLUSION:
1.Max velocity achieved by both the cars are almost close to each other.
2.Acceleration of Hybrid EV is more than pure EV and hence the time taken to reach the maximum velocity is also less.
3.Since EV runs on only battery power whereas HEV uses both battery and diesel fuel. So the Fuel economy of HEV is also low.
SOURCES:
https://in.mathworks.com/help/autoblks/ug/explore-the-electric-vehicle-reference-application.html
https://in.mathworks.com/help/autoblks/getting-started-with-.html