Week-4 Challenge WOT Condition Part-2
- What is the difference between mapped and dynamic model of engine, motor and generator? How can you change model type?
Solution
Mapped model
Mapped model is based on look up tables and not actual components. It is a steady state model and simulation takes less time due to simplicity.
Dynamic model
Dynamic model is based on actual component model. Each component is modeled separately and simulation takes more time due to complexity.
Mapped model of Engine
Mapped model of SI Engine implements a steady-state spark ignition engine model using
Power, air mass flow, fuel flow, Exhaust temperature, efficiency and emission performance
lookup tables. There are two mapped models available in ‘HEV Reference Application’.
- CI Mapped Engine 2. SI Mapped Engine
These models use a set of steady-state lookup tables to characterize engine performance. The table provides overall engine characteristics including actual torque, fuel flow rate, BSFC, and Engine out exhaust emissions.
This model can be used if we have engine data from dynamometer.
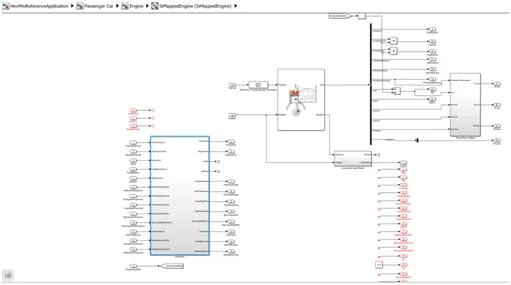
Figure 1: Mapped model of SI Engine
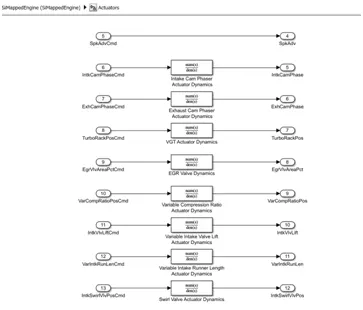
Figure 2: SI Engine - > Actuators
Figure 1 shows the mapped model of SI Engine and figure 2 shows the blocks inside Actuator. We can see that this model is based upon set of equations at steady state.
Dynamic Model of Engine
Dynamic model decomposes the engine behavior into engine characteristics that are separated into lower level components. By combining components in this way, the model captures the dynamic effects. Figure 3 shows the dynamic model of SI engine. We can see that Throttle body, Intake system, Exhaust system, Compressor, Air filter and other components are modeled separately.
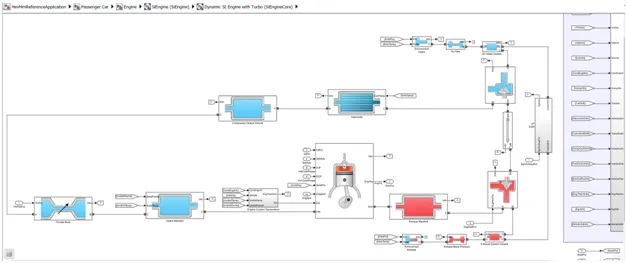
Figure 3: Dynamic model of SI Engine
Mapped Model of Motor and Generator
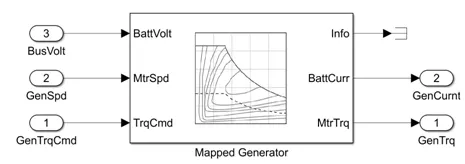
Figure 4: Mapped model of Generator
The above figure shows the mapped model of Generator.
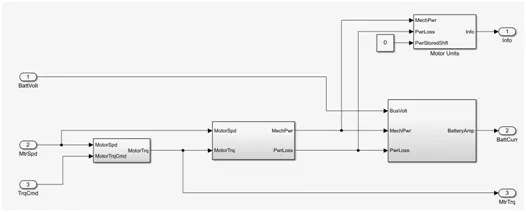
Figure 5: Subsystems of Mapped Generator
There are mainly 4 subsystems inside this mapped model.
- Maximum Torque and Power
- Tabular Power loss data
- Electrical current
- Motor Units
1.Maximum Torque and Power
This block will generate motor torque based on Motor speed and Torque demand. Motor Torque Vs speed, Power Vs speed values are fed into the model as table and it will check whether the torque demand is within the limits of the motor. Then it will generate corresponding torque.
2.Tabular Power loss data
This block consists of a 2D lookup table which will give power loss value based on motor speed and torque.
3.Electrical Current
This block will calculate battery current from mechanical power, power loss and bus voltage.
Dynamic model of Motor and Generator
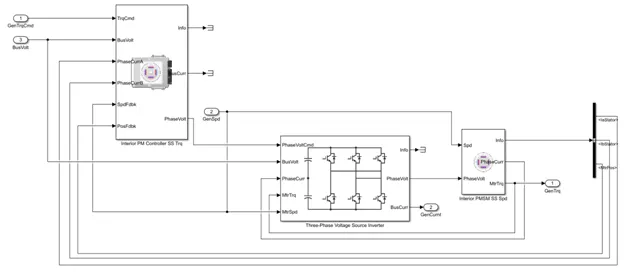
Figure 6: Dynamic model of Generator
The above figure shows the dynamic model of Motor/Generator. Unlike mapped model, this model consists of actual models of PMSM motor and Voltage Source Inverter. The Permanent Magnet Synchronous motor has been modeled inside the block to generate torque and power based on inputs.
The voltage source inverter model consists of a 2D look up table which will give bus voltage values based on motor speed and torque.
To Change the Model type
To change Model type, Go to ‘Modeling’ tab and select ‘Variant Manager’ as shown in figure 7.
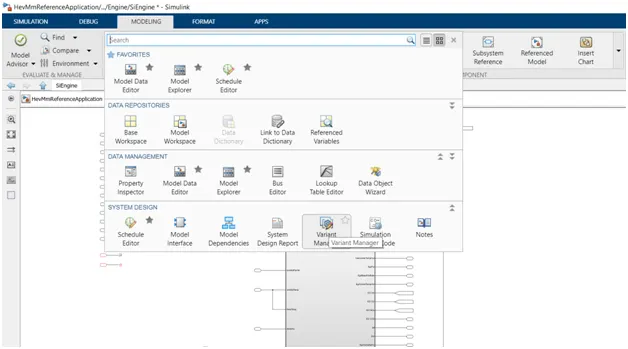
Figure 7: Selecting Variant manager
In order to change the current model to Dynamic SI Engine model, Right click on the required block and select-> set as label mode active choice. Then it will be the active model and the previous model will automatically gets deactivated.
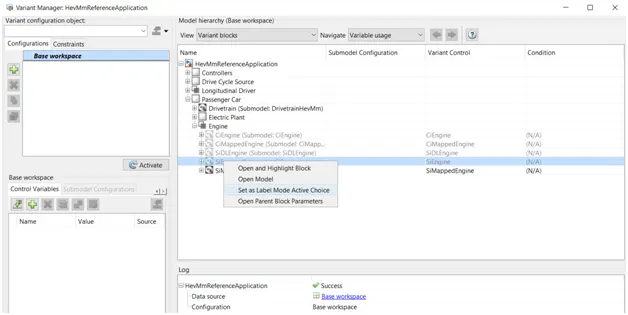
Figure 8: Change the current model
2.How does the model calculate miles per gallon? Which factors are considered to model fuel flow?
Solution
Miles Per Gallon
MPG, or miles per gallon, is the distance, measured in miles, that a car can travel per gallon of fuel. MPG is also the primary measurement of a car's fuel efficiency: The higher a car's MPG, the more fuel efficient it is.
MPG Calculation in HEV Model
We can find the miles per gallon calculation inside the Visualization block-> Performance Calculations as shown in figure 10.
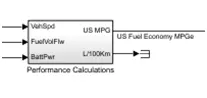
Figure 9: Miles Per Gallon Calculation
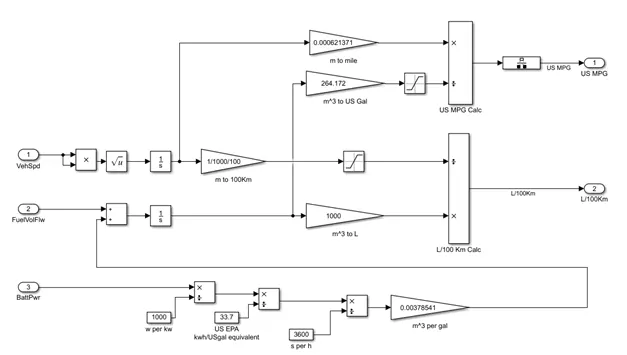
Figure 10: Miles Per Gallon Calculation
Vehicle speed is integrated to get displacement which will be in meters. When we multiply it with 0.000621371, we get distance in miles.
Since it is HEV application, fuel consumption includes battery power consumption and Fuel flow volume. Battery Power is converted to m^3 per gallon by multiplying with appropriate constants. It will then added to fuel volume and then integrate to get m^3. This will be multiplied with 264.162 to get Gallons.
Distance in miles divided with gallons will give Miles Per Gallon of the vehicle.
Factors considered to model fuel flow
The parameters considered for fuel flow are vehicle speed, Fuel volume flow and Battery Power.
Vehicle speed is used to calculate distance travelled. Since this is a hybrid vehicle, both Gasoline consumption and Battery consumption are considered as fuel flow. Gasoline consumption is modeled inside ‘Mapped Core Engine’ block as shown in figure 11. Fuel mass flow is being modeled by a 2D look up table where Engine speed and Toque will give fuel consumption values.
Battery consumption is calculated from battery power. Both fuel consumptions are added together to get total fuel consumption.
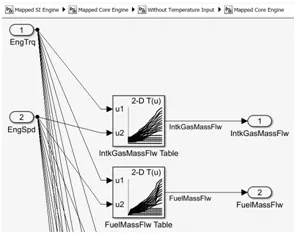
Figure 11: Fuel mass flow model
3.Run the HEV Reference Application with WOT drive cycle. Change the grade and wind velocity in the environment block. Comment on the results.
Solution
The HEV Reference Application in MATLAB is shown below.
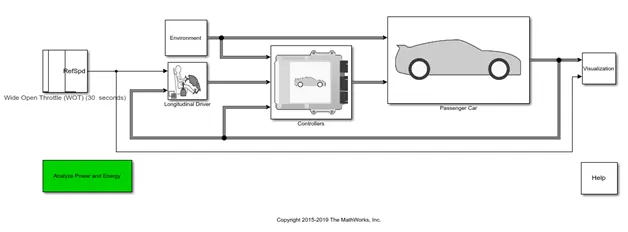
Figure 12: Hybrid Electric Vehicle Multimode Reference Application
The input driving cycle is changed to WOT as shown in figure 13.
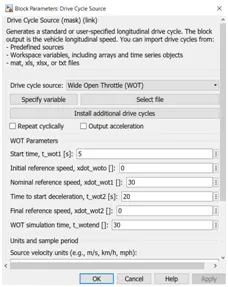
Figure 13: Drive cycle source settings
The wind velocity and grade can be changed inside the Environment block as shown in figure 14.
The grade is given as 10 and Wind velocity 4 as shown below.
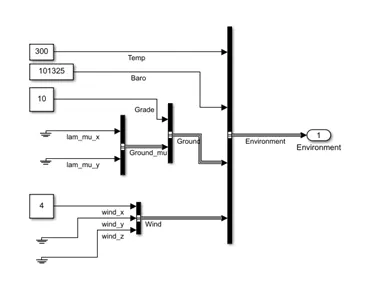
Figure 14: Grade and Wind Velocity settings inside ‘Environment’ Block
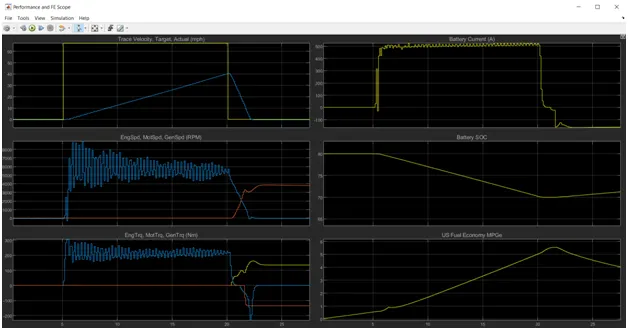
Figure 15: Results of WOT condition in HEV
Result Analysis
- The Vehicle couldn’t achieve the Target velocity. It attained only 40mile per hour in 20sec.
- Battery State of Charge decreased rapidly from 80% to 70%.
- Battery supplied its maximum current of 500A. Still the vehicle could not achieve desired speed.
- The peak value of fuel consumption is 5.5MPG.
- The ‘blue’ colour indicates motor, ‘red’ shows Generator and ‘Yellow’ shows Engine speed/Torque.
- We can see that the power is supplied only by the battery during WOT condition. Engine was at rest during this time.
- To Improve WOT performance, Motor has to deliver more torque and Battery should support fast discharging.
4.Keeping all other parameters same, compare the simulated results of hybrid and pure electric power trains.
Solution
The Pure electric vehicle model is shown in figure 16. The drive cycle settings can be changed as shown in figure 17.
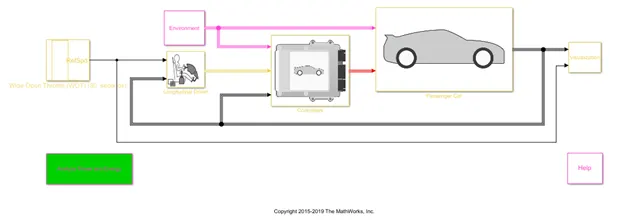
Figure 16: Electric Vehicle Reference Application
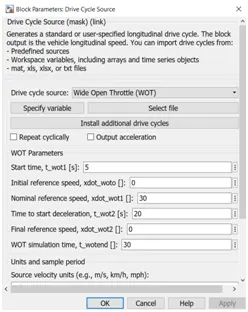
Figure 17: Drive cycle settings
To compare the performance with HEV vehicle, Grade is given as 10 and Wind velocity 4 in figure 18.
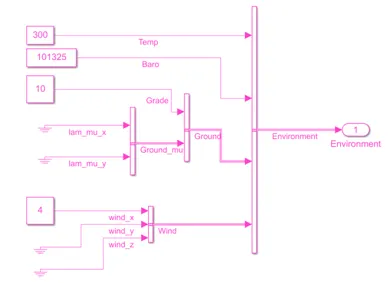
Figure 18: Grade and wind velocity parameters
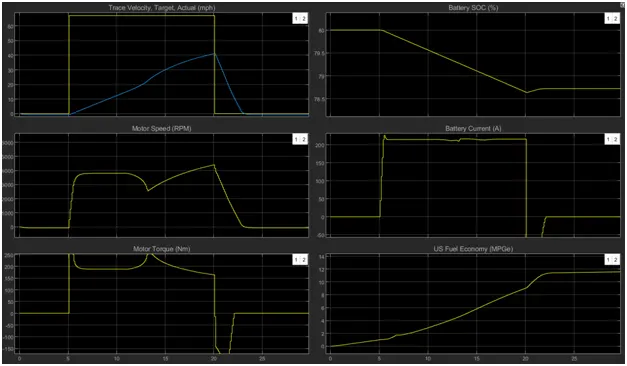
Figure 19: Results of WOT performance
Result Analysis
- The Vehicle couldn’t achieve the Target velocity. It attained only 40mile per hour in 20sec.
- Battery State of Charge decreased from 80% to 78.5%.
- Battery supplied its maximum current of 220A.
- The peak value of fuel consumption is 11.5MPG.
- To Improve WOT performance, Motor has to deliver more torque and Battery should support fast discharging.
Comparison
- In HEV, Battery SOC decreased rapidly(10% decrease) but in EV the SOC decreased only 1.5%. This indicates that EV battery has higher capacity than in HEV.
- The higher the MPG, higher the Fuel efficiency. So in this case, HEV has 5.5Miles Per Gallon and EV has 11.5Miles Per Gallon. So EV is having twice fuel efficiency than HEV.
- In both applications, Battery discharge rate is limited. So they couldn’t achieve maximum velocity.