Week 4 Challenge
Aim: To calculate the earth presuure on the given retaining wall. Apply the earth pressure on the retaining wall using the Stadd model.
Introduction: The calculation of earth pressure is carried out using Rankine earth pressure theory to calculate the ka value, which is active earth pressure coefficient.
Since nothing is mentioned that whether the soil fill is at rest or active or passive condition, I have assumed it to be active earth pressure. The coefficient is calculated with repect to 'phi" value the angle of internal friction between the soil particles. The soil is considered to be sandy ie. C=0.
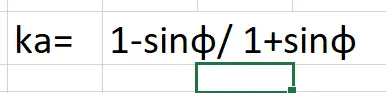
Phi angle = 30 degrees
Ka1=ka2 = 0.33
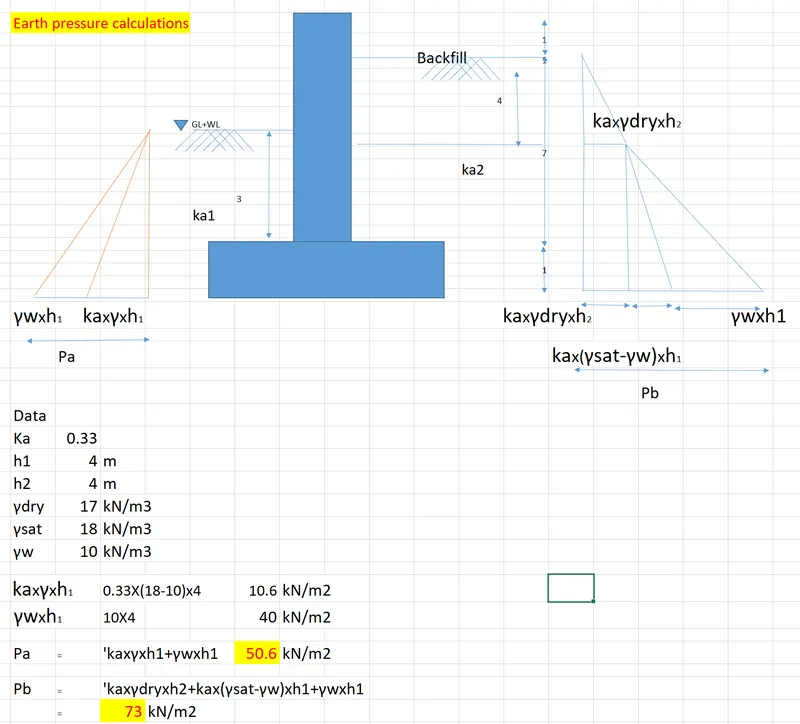
The obtained earth pressure is applied to the stadd model.
The height of the wall is 8m. The length of the model is 5m.
The thickness of the wall and the footing is considered to be 1m.
Procedure:
The stadd model is formed using plate elements.
The material given as concrete.
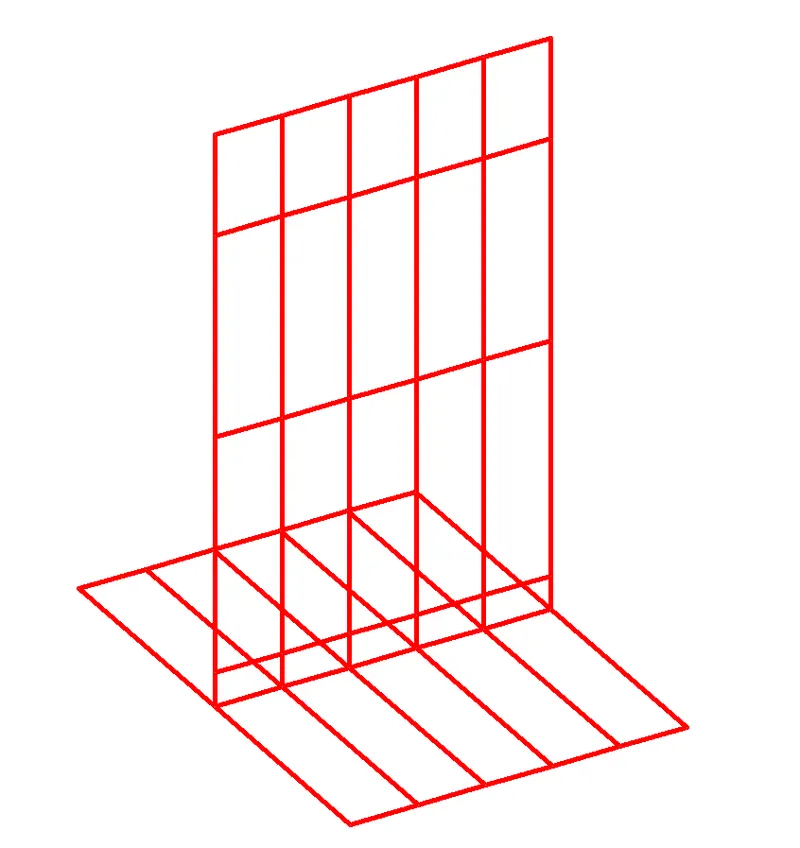
Since the footing thickness is assumed to be 1m, at the bottom of the wall the vertical wall has 0.5m deth defined plate element. On the top of it remaining eight meter height the wall is 1mx1m plate element.
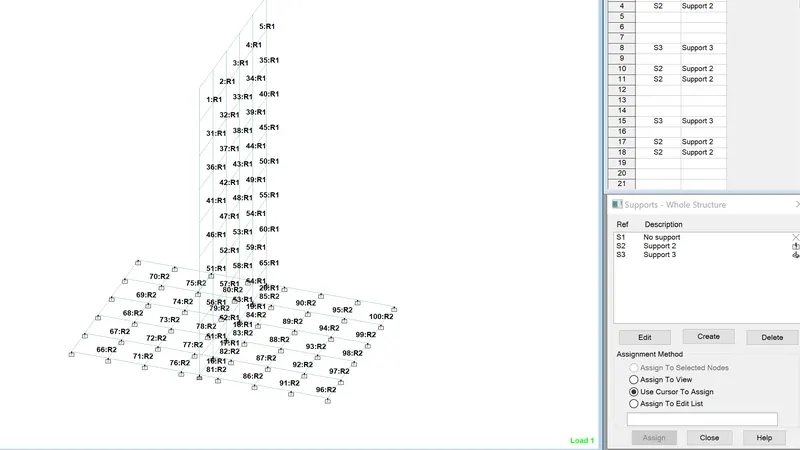
The bottom figure shows the 3D model and the numbering of the plate elements.
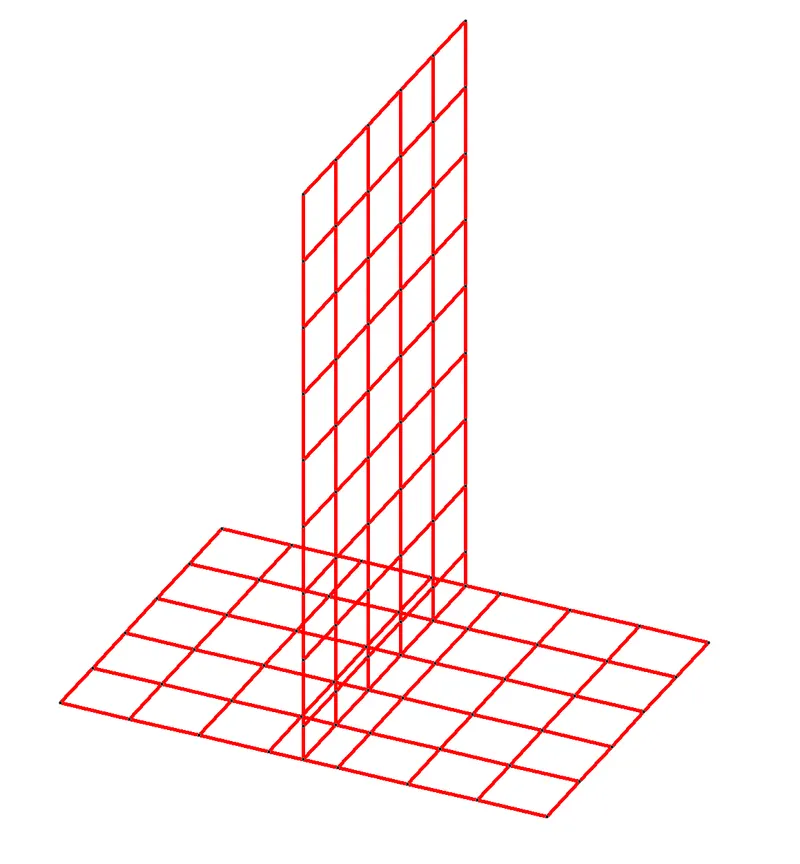
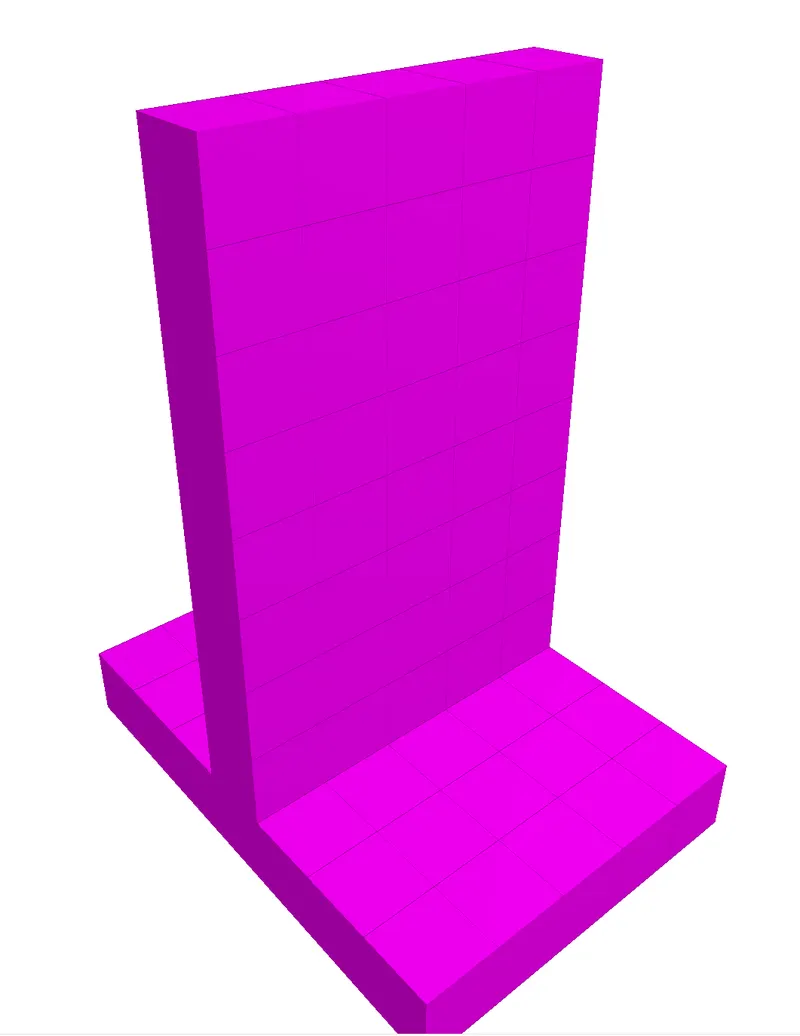
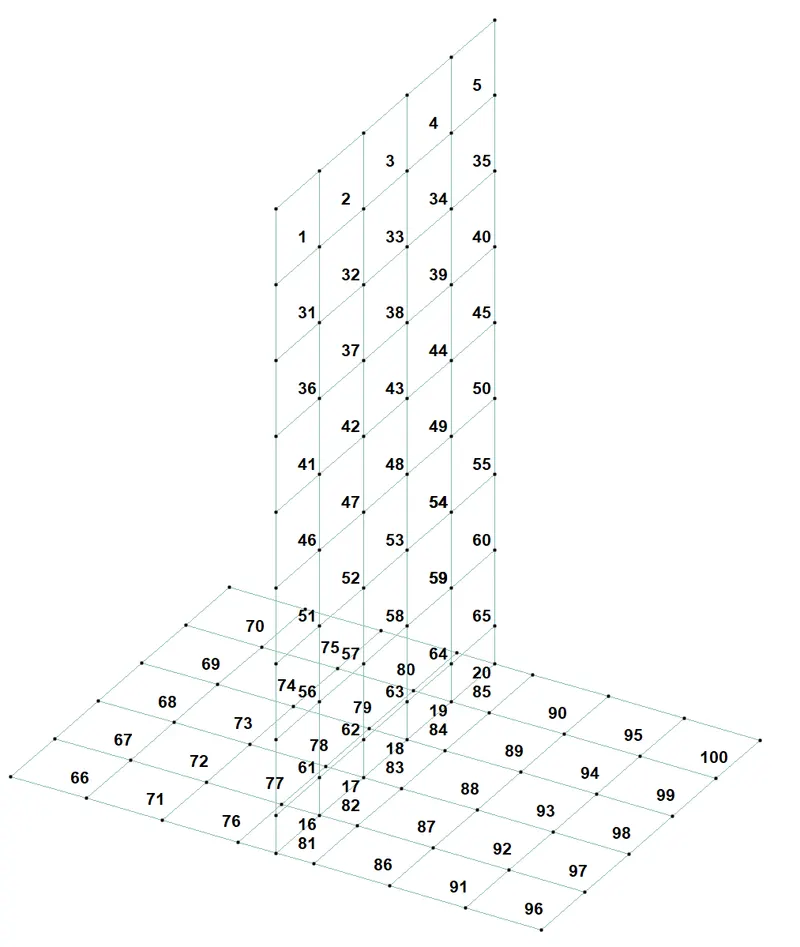
The supports to the footing is defined as foundation in the supports, then plate member then, the subgrade value is given as 15000kN/m2/m.(assumed value for loosely compacted soil)
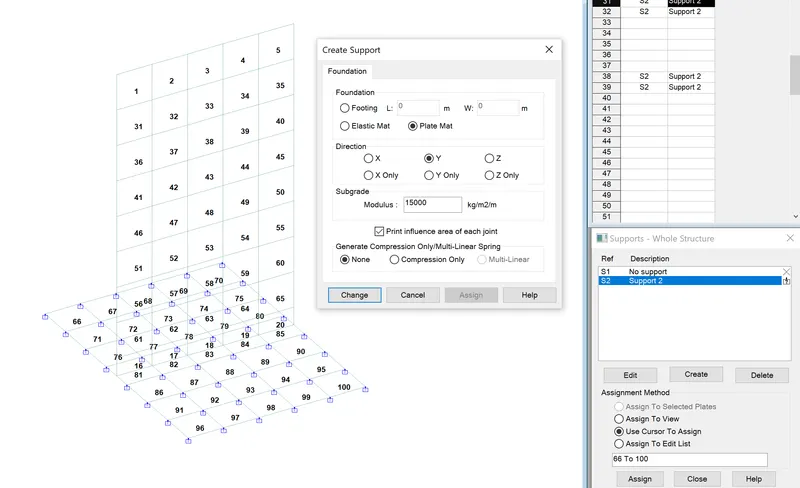
Loading on the wall.(here in the challenge only the pressure on the wall has to be applied, no loads on the footing needs to be applied as per the challenge)
Initially there was no connectivity in the wall and the footing so there was an error latter one more set supports at the footing and wall junction was created.
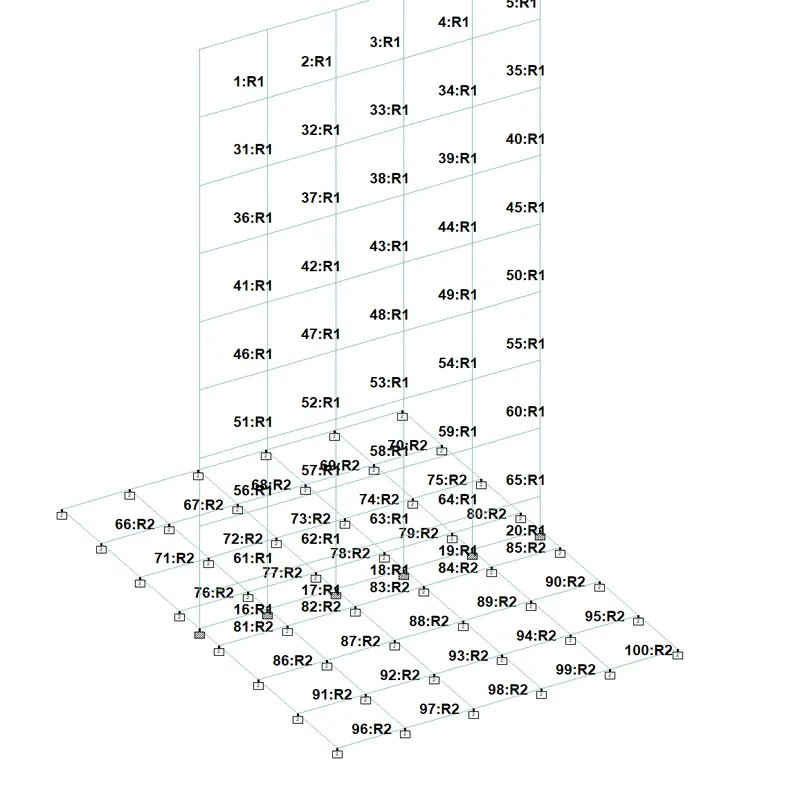
Loading
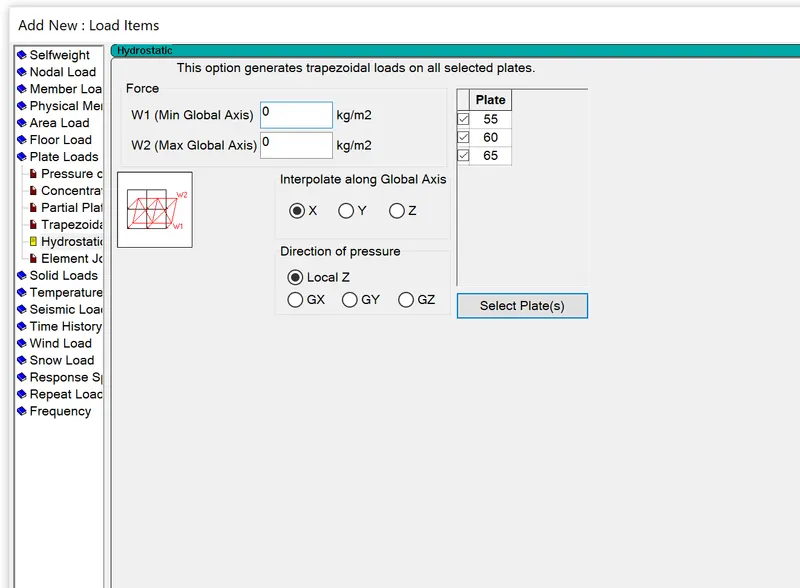
The load is applied as plate load, then hydrostatic loads are to be selected, then the window appears as follows.
We have to select the memeber plates and give the W1 and W2 values.
Here in the first case Pa, the W1 is 50.6 kN/m2 and W2=0.
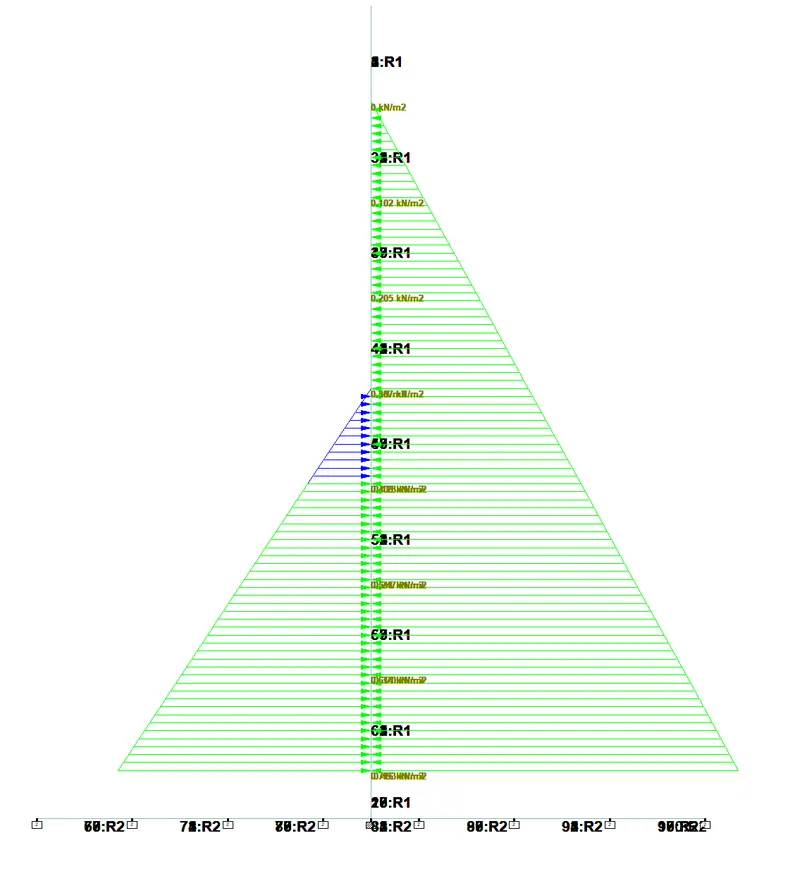
The spreciality of the hydrostatic loading is it interpolates for the each plate and applies the loads.
The following figure shows the interpolated loads on the plates.
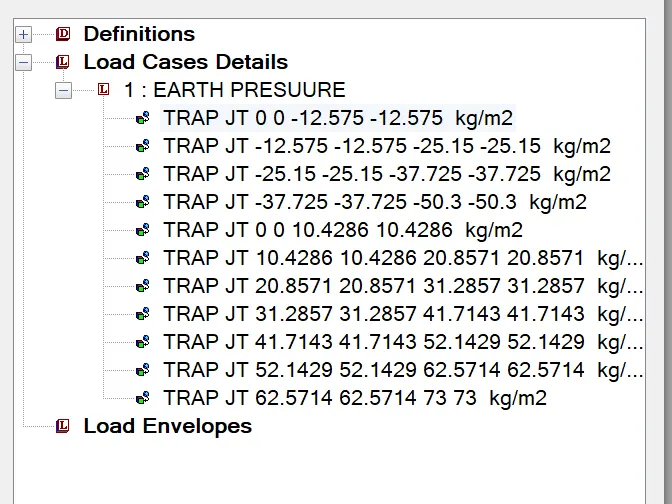
The following figure shows the applied load patterns.
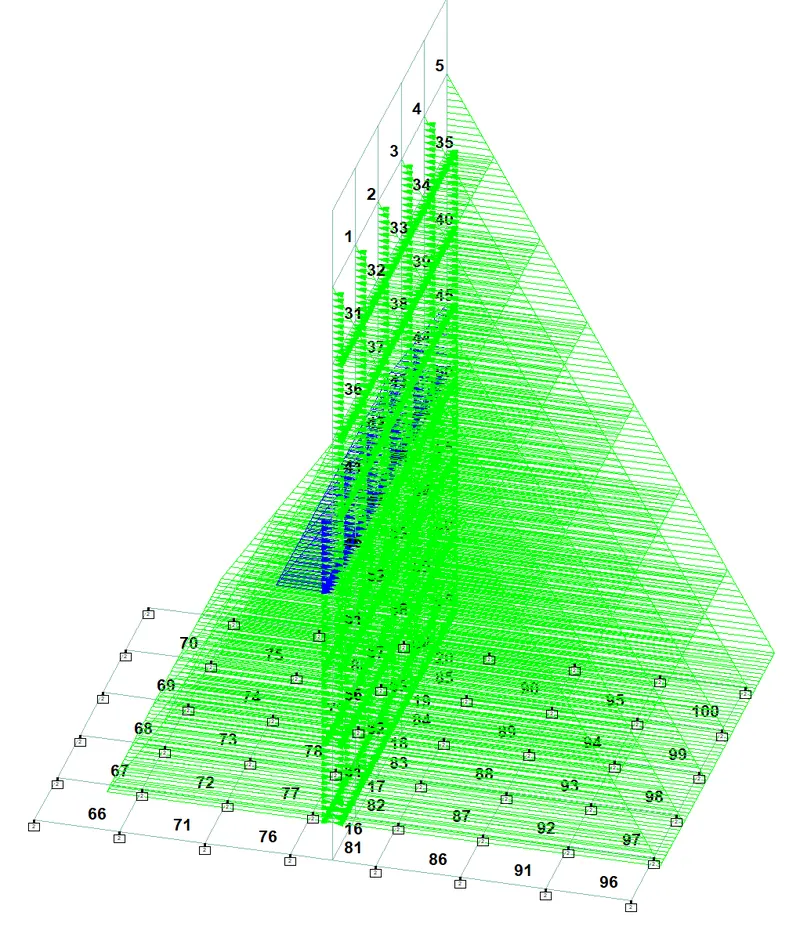
Later the perform analysis command was added and the analysis was run.
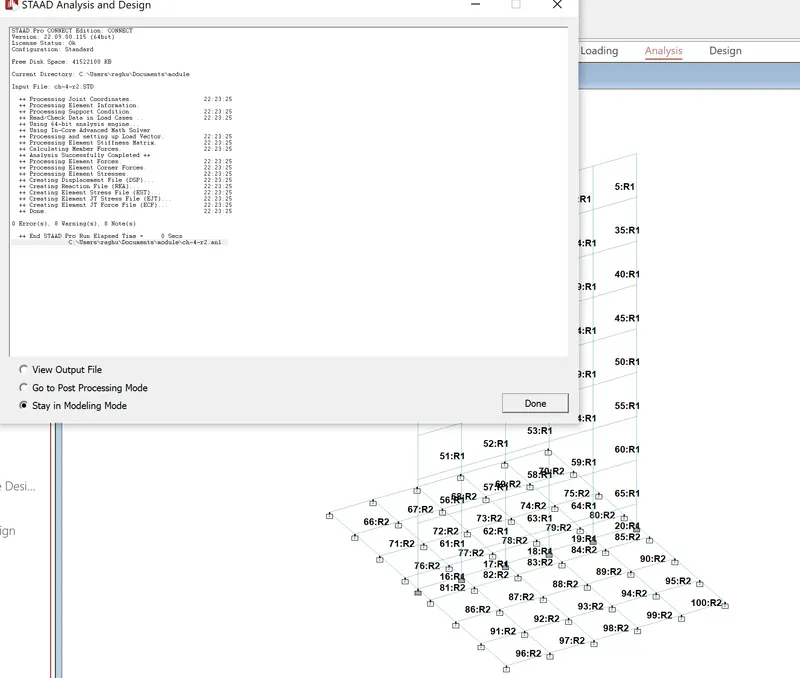
IT shows 0 errors and 0 warnings.
Results
Deflection
The following figure shows the deflection of the wall due to applied pressure.
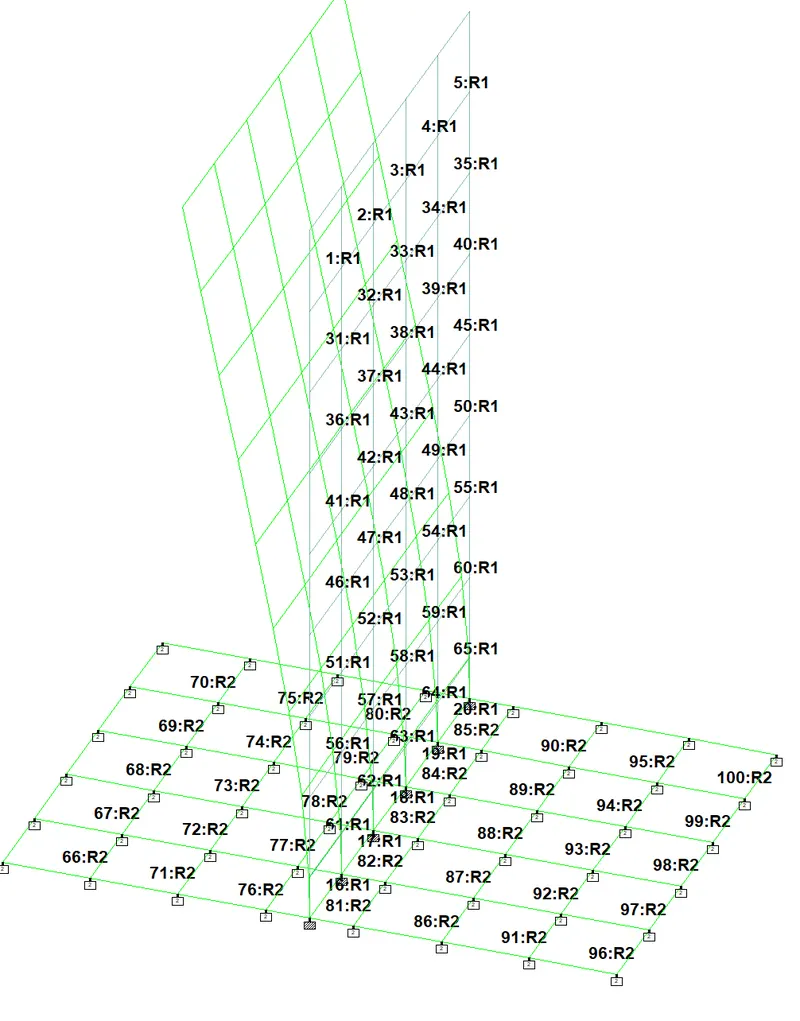
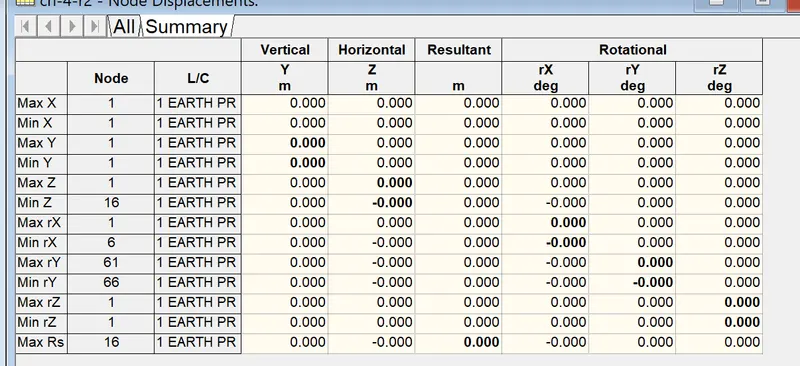
From the above table there is no deflection value. as the pressure is applied on the both sides. the pattern of deflection was visisble after the scale was changed.
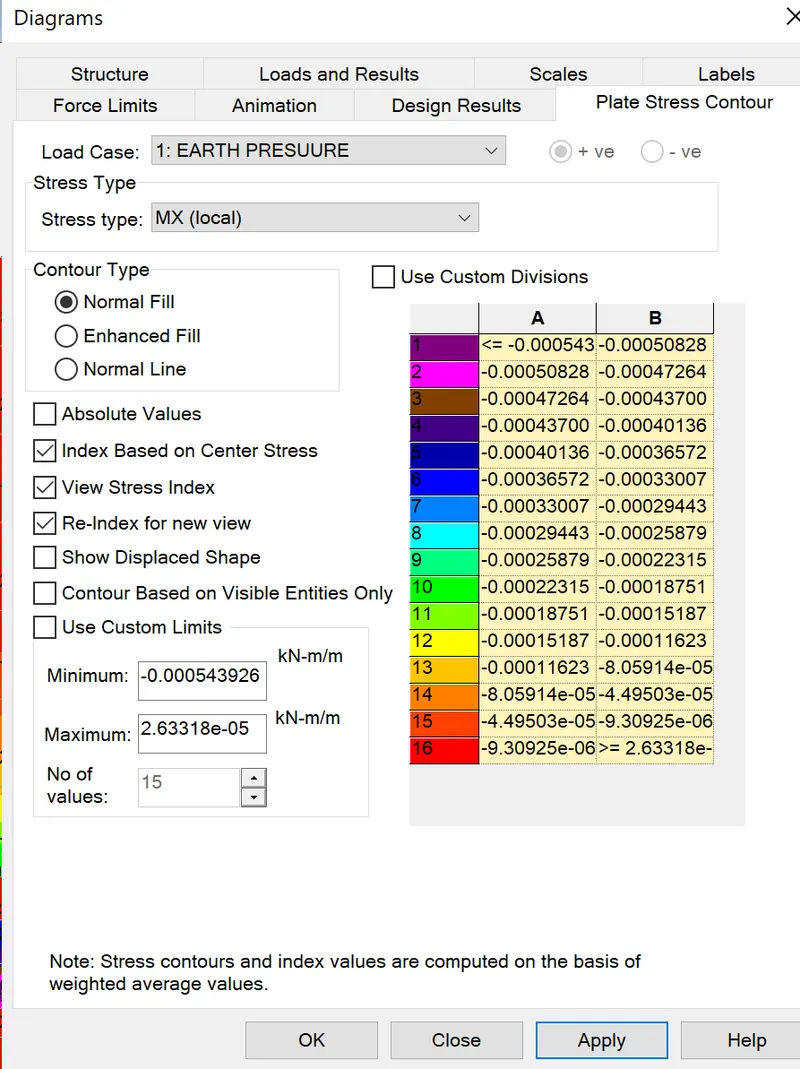
Mx Local stresses
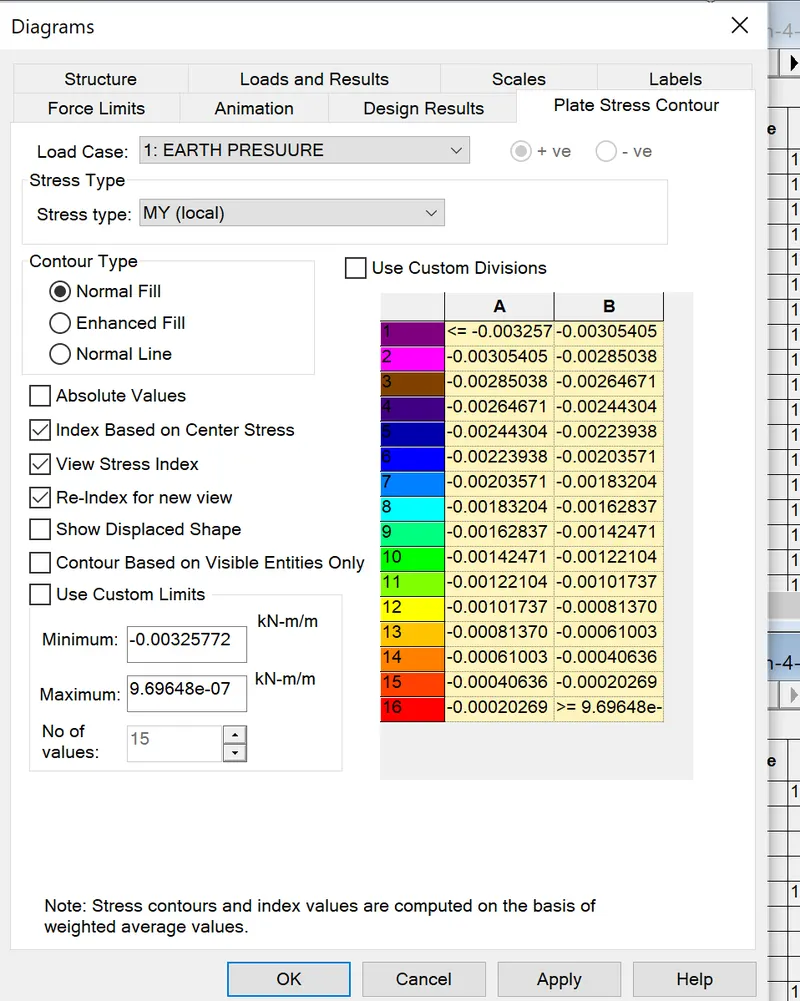
My Local Stresses on plate/wall
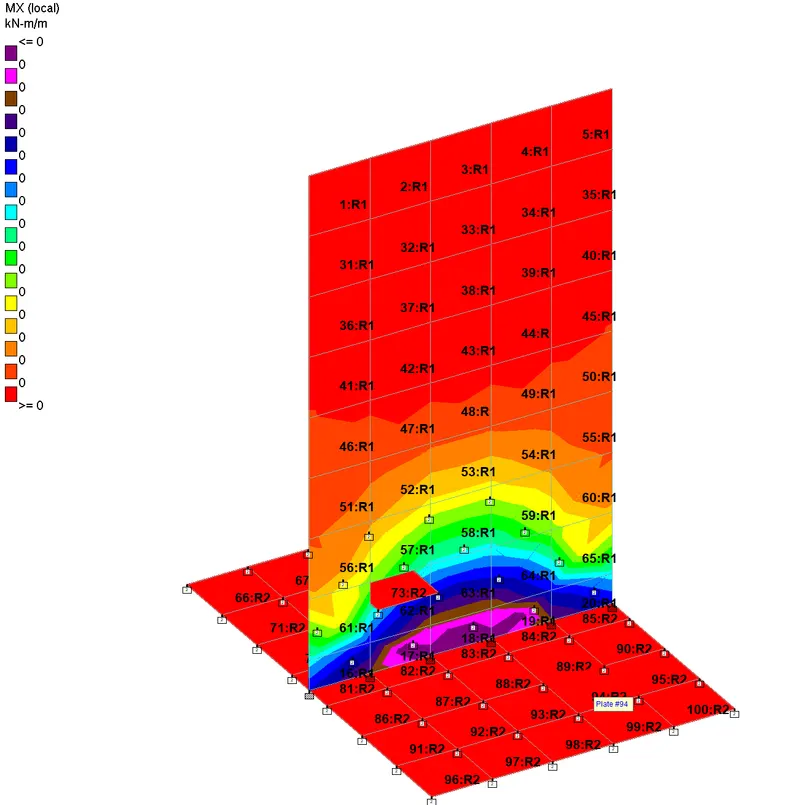
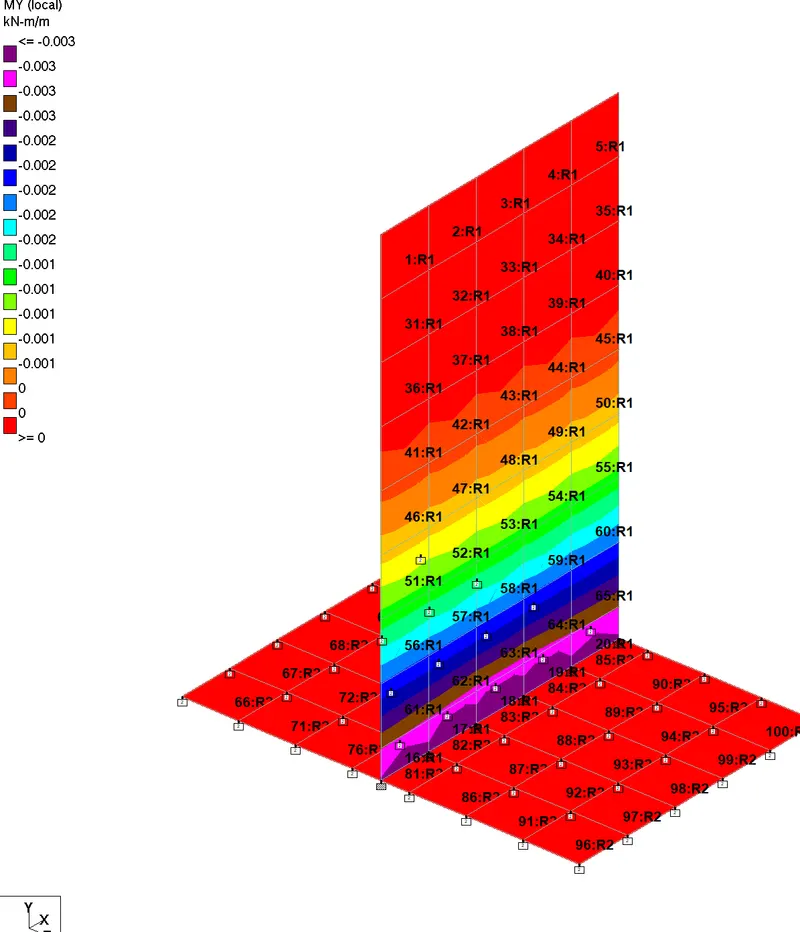
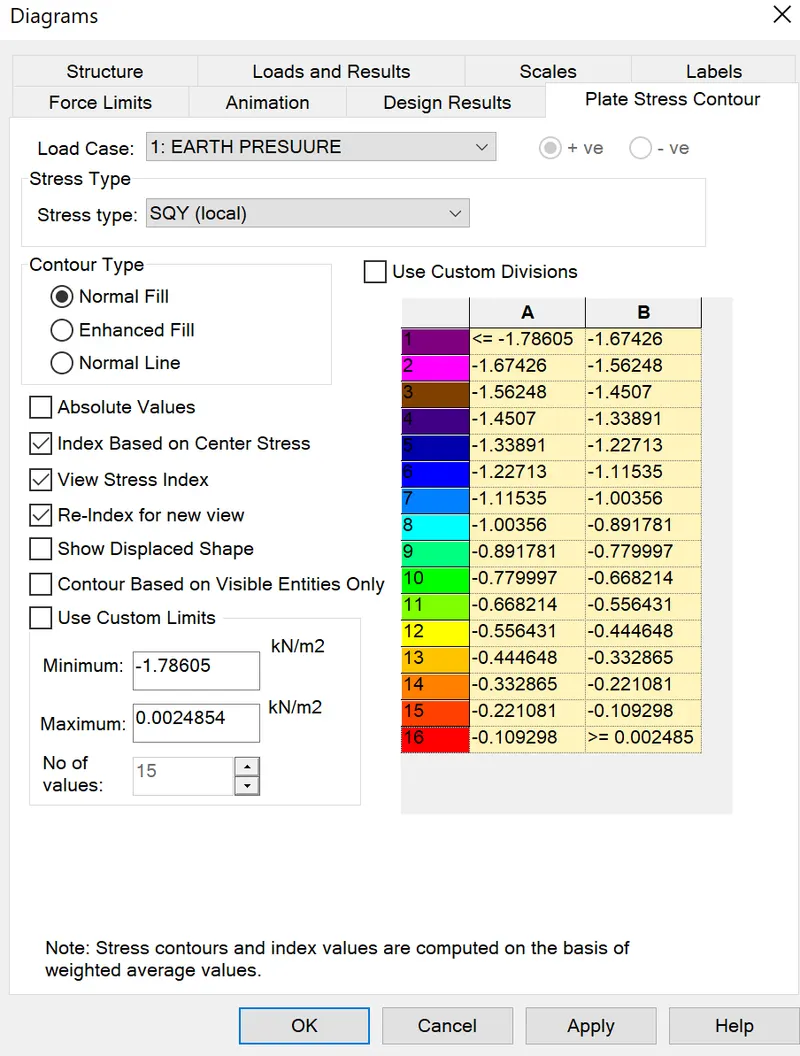
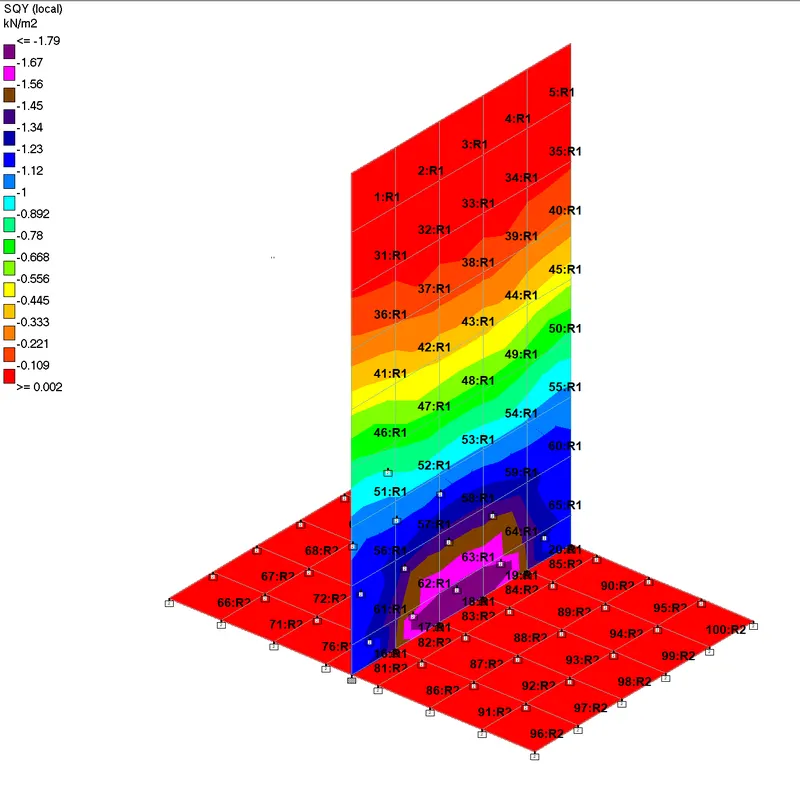
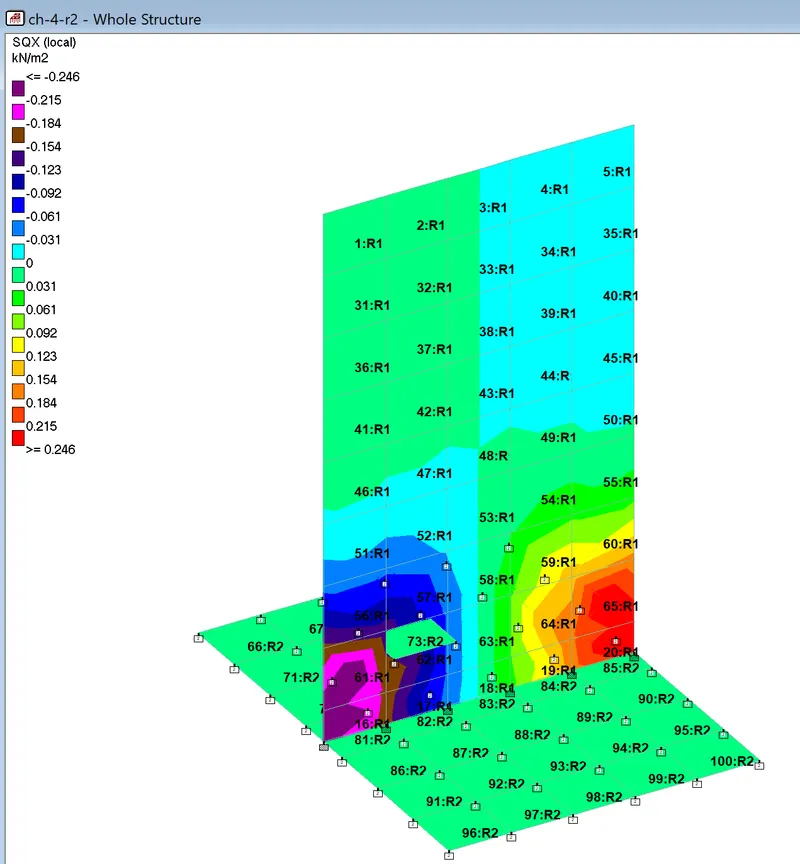
In this was the earth pressure loads are applied on the retaining wall and the loads were analyzed and results were obtained.
Similarly the other results were obtained.