Week - 4
Q1.
Step1: We add “Chart” Block in the Simulink workspace.
Step 2: We enter the Chart workspace to create the state flow diagram.
Step 3: We add first STATE block named Power (input type) having one input. Variable name Power is then defined as input data, using ‘Symbols Pane’ option in ‘Modelling’ tab.
Step 4: We apply the control logic “Power==1” and connect it to another STATE block defined as Water Supply (input data type). This logic allows water to pass into the washing machine setup if power is available.
Step 5: Now, we connect ‘junction’ block to the Power and Water supply State blocks, having conditions “Power==0” and “Water==0”. This is done to pause the machine if both power and water supply is zero.
Step 6: Now Water supply State block is connected to ‘Soaking’ block with condition “Water==1”.
Step 7: The ‘Soaking’ state block is then connected to the ‘Washing’ block with condition “after (200, sec)”, which turns on the soaking operation in the machine after washing for 200 seconds.
Step 8: Now the Soaking’ state block is connected to the ‘Rinsing’ block with condition “after (100, sec)”, which turns on the rinsing operation in the machine after soaking for 100 seconds.
Step 9: Now the ‘Soaking’ state block is connected to the ‘Drying’ block with condition “after (20, sec)”, which turns on the drying operation in the machine after soaking for 20 seconds.
Step 10: Finally, ‘Drying’ state block is connected to the ‘Finish’ block with condition “after (50, sec)”, which turns off the machine operation 50 seconds.
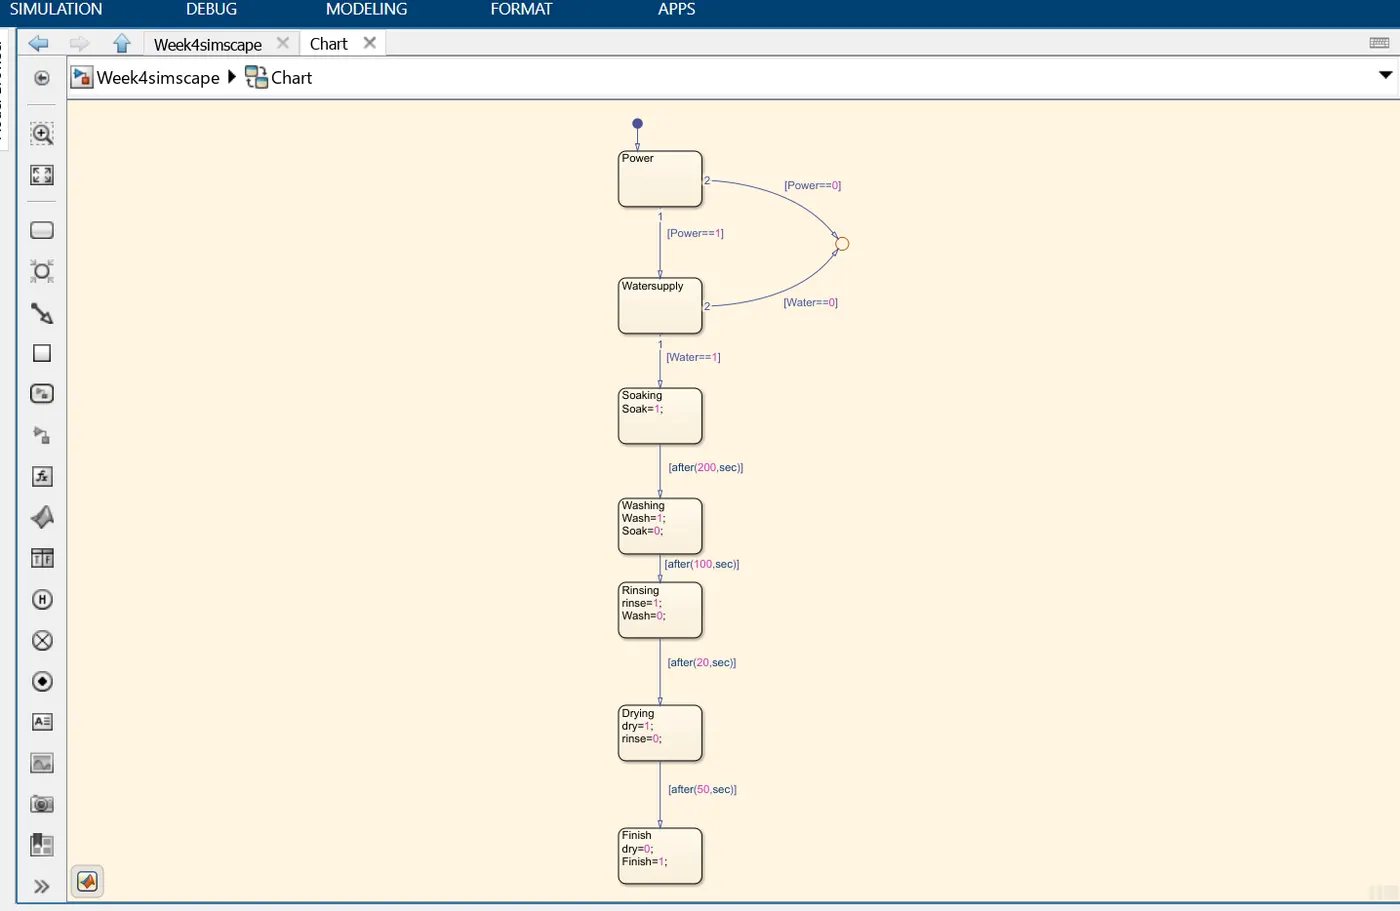
Note: Soaking, Rinsing, Washing, Drying, Finish state blocks are defined as output data.
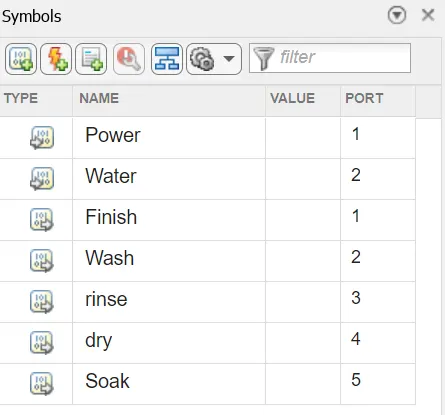
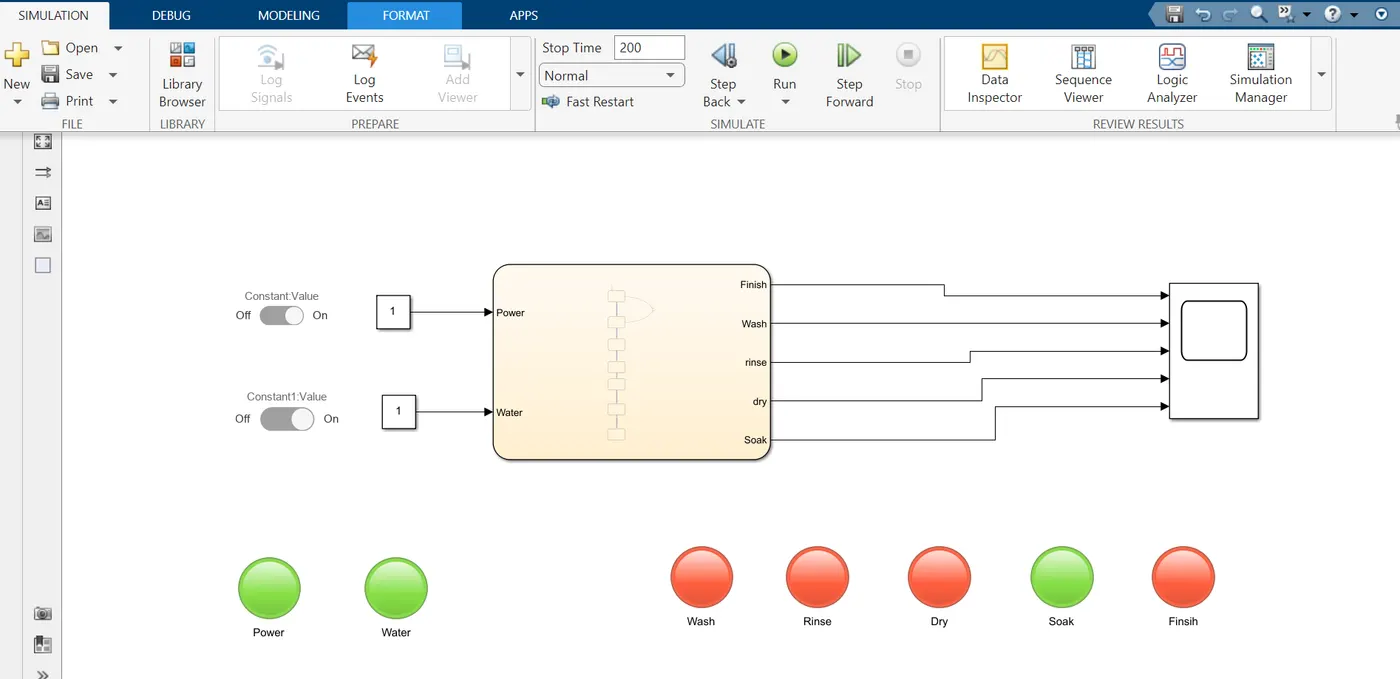
Step 11: Now we execute the state flow chart to get the equivalent Simulink model. Input ports of Power and Water supply are connected to ‘Slider switch’ block via Constant block (1-ON, 0-OFF).
Step 12: The output ports of are connected to SCOPE block and LAMP block to view their ON/OFF status.
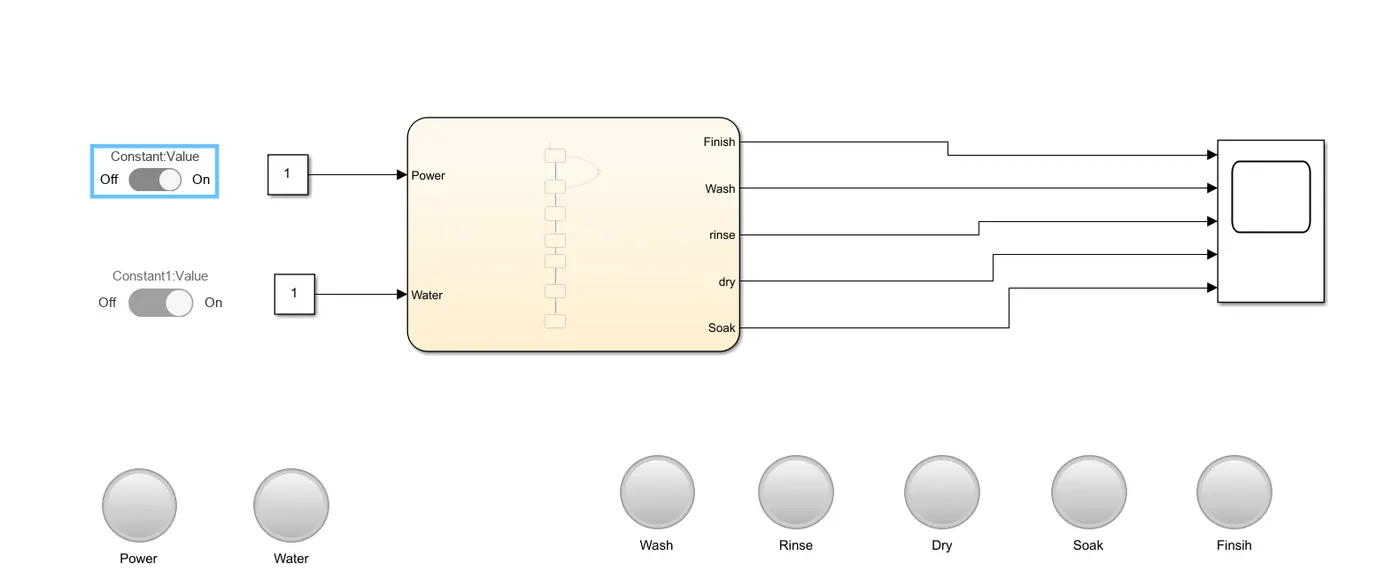
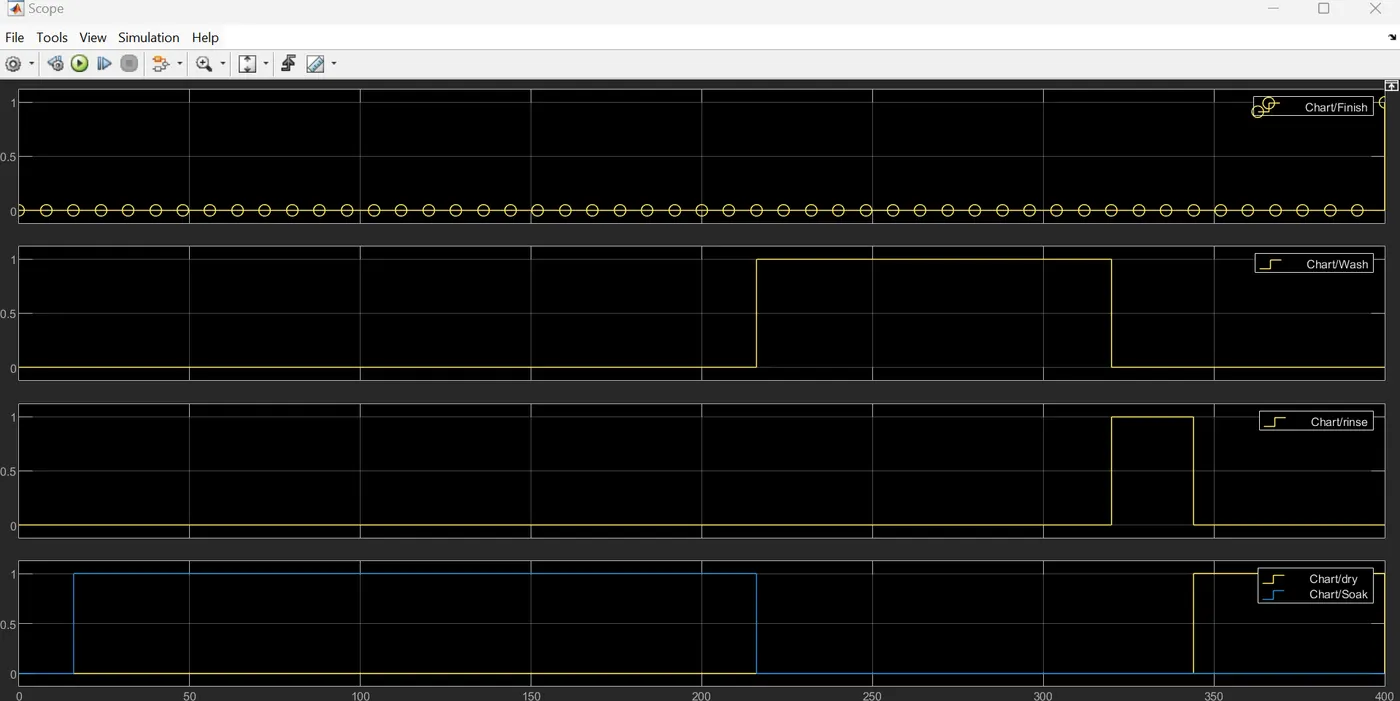
Step 13: We run the Simulink model with a time of >=400 seconds to view full operation of Washing Machine.
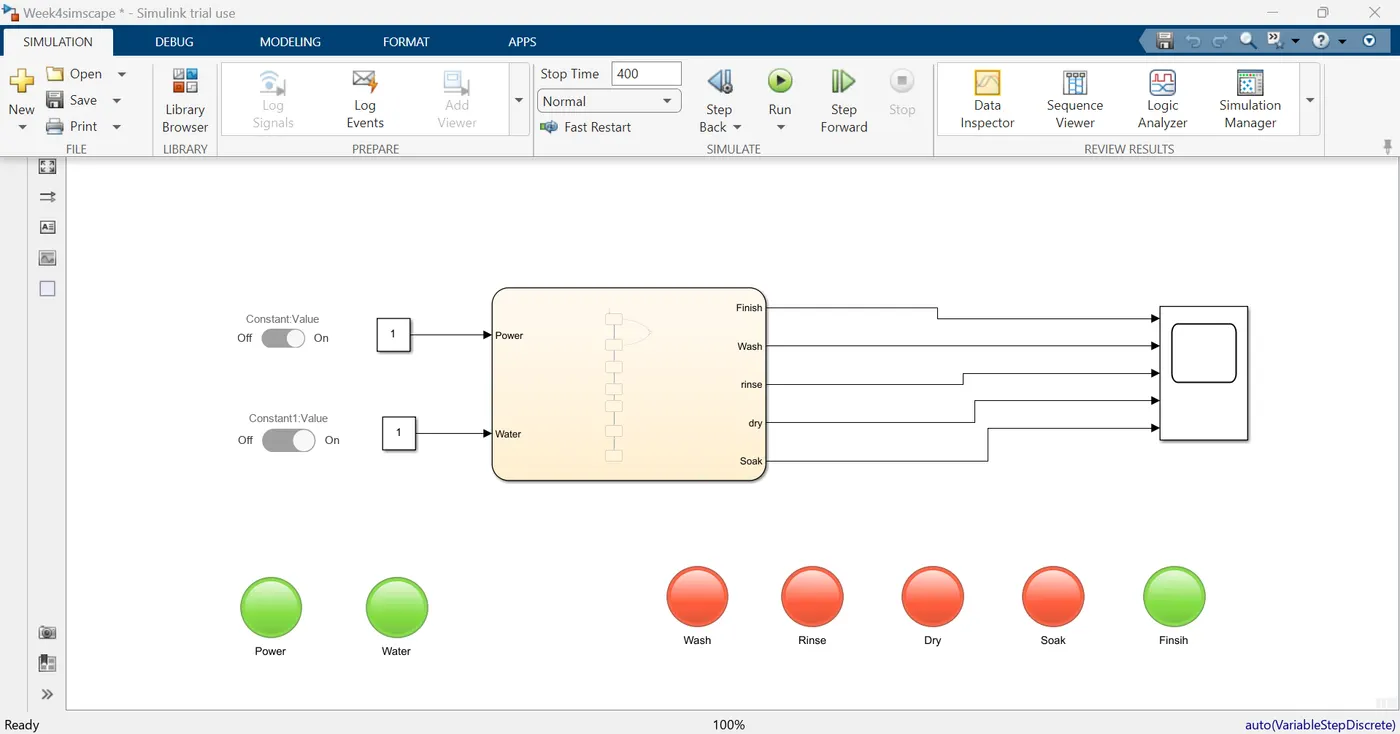
Result:
We can observe the Power supply, Water supply Lamps are ON(green) while Soaking, Rinsing, Washing, Drying ports are off(red) as their operation is complete hence we can see the Finish block turned on (green)after completion of machine operation.
Step 14: We can observe the plot for all output ports with respect to time from the SCOPE block.
Step 15: If we run the Simulink model for 200 seconds, we observe that Soaking operation has been completed (green Lamp signal) while other output ports are off.
Washing Machine Model link: https://drive.google.com/file/d/15c-5nk6IdbYgv1jS88JVnnGsGeslSY1U/view?usp=drive_link
Q2.
Step 1: We add “Chart” Block in the Simulink workspace.
Step 2: We enter the Chart workspace to create the state flow diagram.
Step 3: We add first STATE block named ENGINE (input type) having one input. Variable name ENGINE is then defined as input data, using ‘Symbols Pane’ option in ‘Modelling’ tab.
Step 4: Now we connect the Engine block to Gear 1 block and apply the state flow condition “speed>0”. further we add another Engine block with control logic of “engine off==1”(specifying engine conditions when turned off) having and connect it with first Engine block with control logic “speed=0”
Step 5: We connect the Gear 1 state block to Gear 2 block via two conditions “speed>=16” and “speed<=15”.
Step 6: The Gear 2 state block to Gear 3 block via two conditions “speed>=26” and “speed<=40”.
Step 7: The Gear 3 state block to Gear 4 block via two conditions “speed>=41” and “speed<=60”.
Step 8: The Gear 4 state block to Gear 5 block via state flow condition “speed>=61” .
Note: Here the variable ‘speed’ is defined as input block whereas all Gear blocks are defined as output blocks.
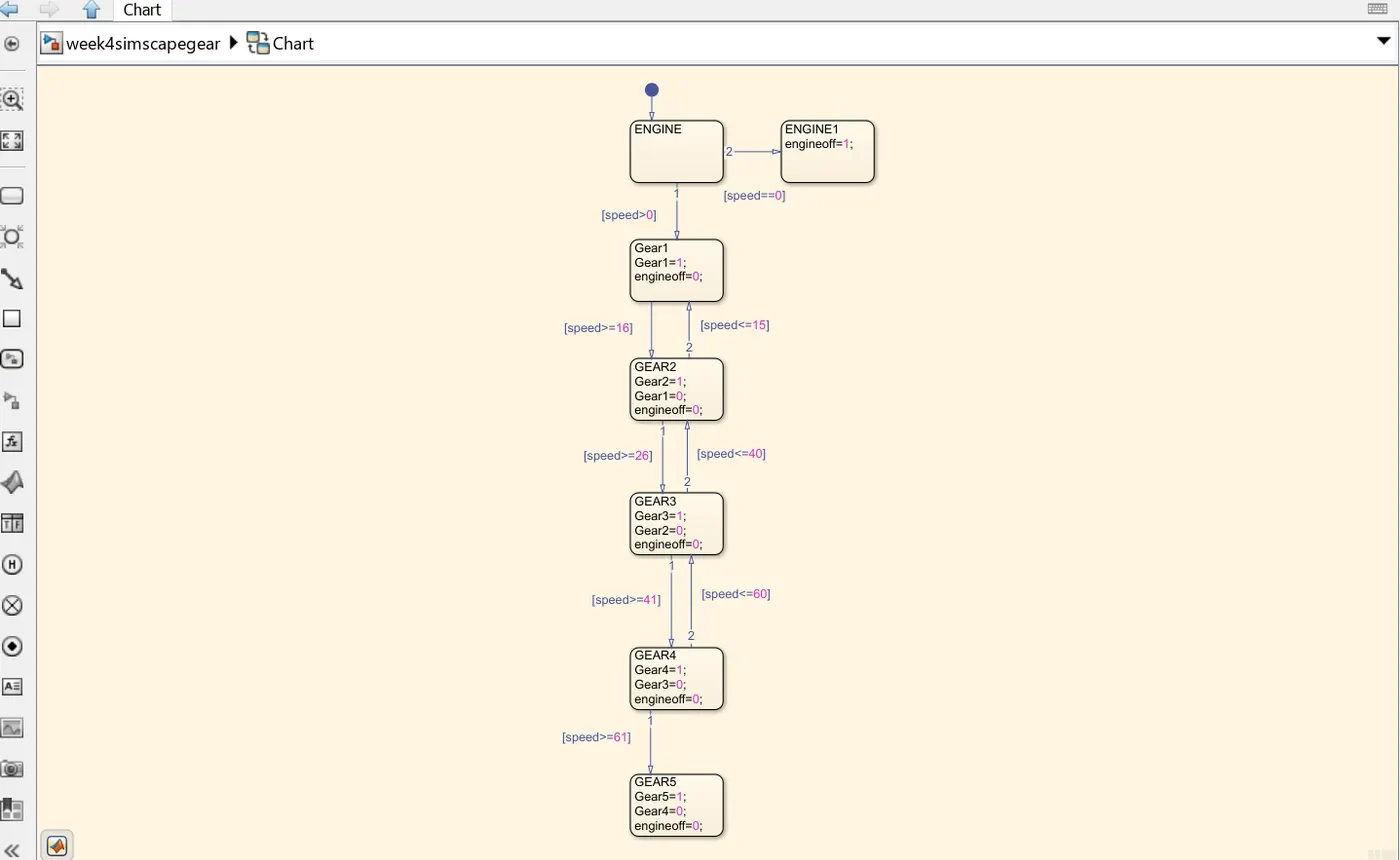
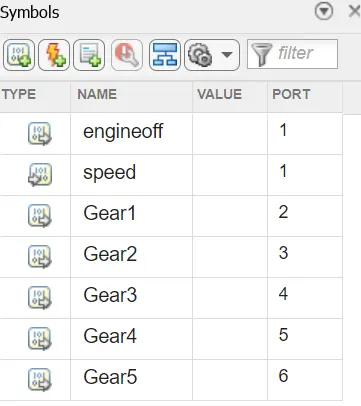
Step 9: Now we execute the state flow chart to get the equivalent Simulink model. Input ports of ENGINE is connected to ‘Gauge’ block via Constant block .
Step 10: The output GEAR ports are connected to ‘DISPLAY’ block to view status of Gear shift status.
Step 11: We connect a LAMP block to Engine port to view its running status(Green-ON , RED-OFF).
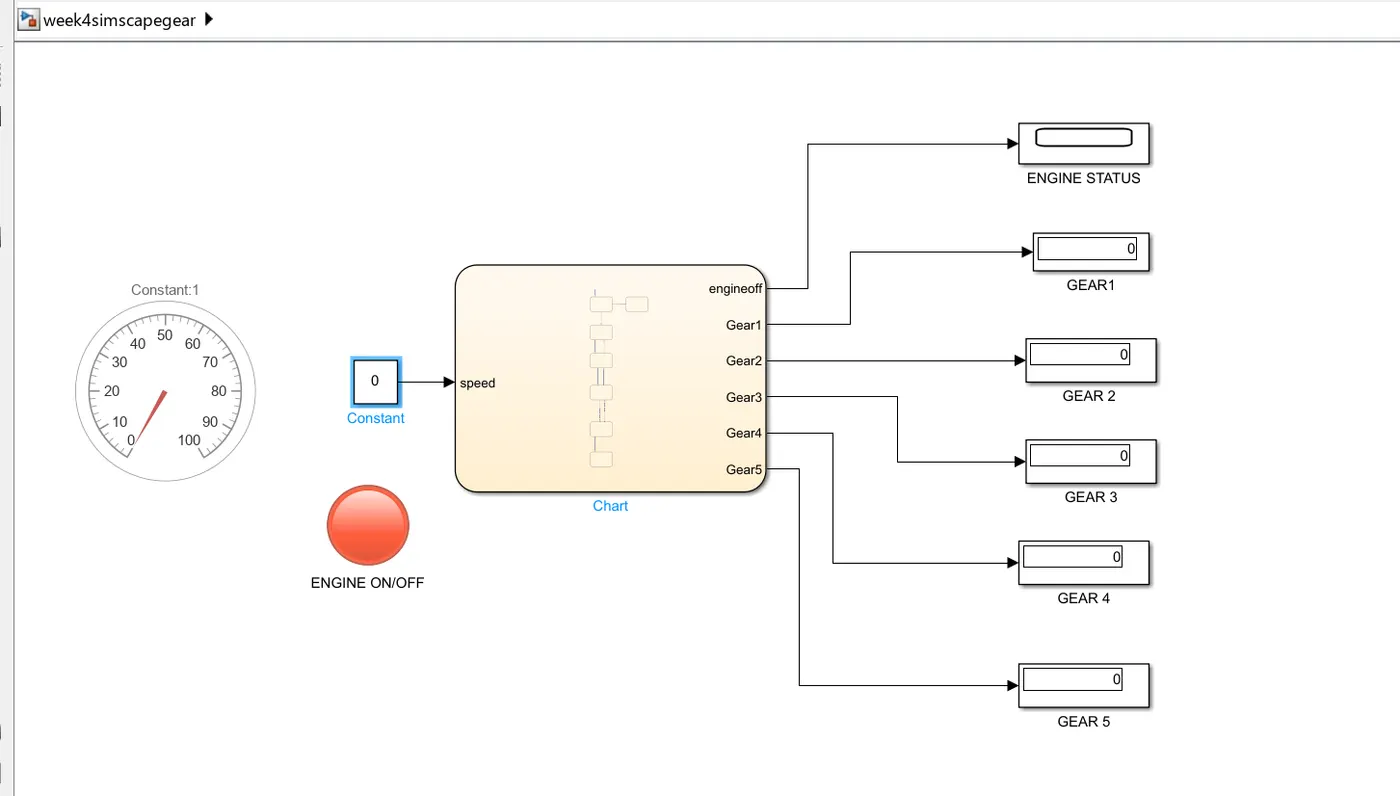
Step 12: We assign value of ‘0’ to constant block that is connected to speed gauge and run the simulation of the gear shift model.
We can observe Engine turns off when speed is zero that is LAMP is off (Red). Further we can observe gear drives are not in use(zero value for all gear shifts).
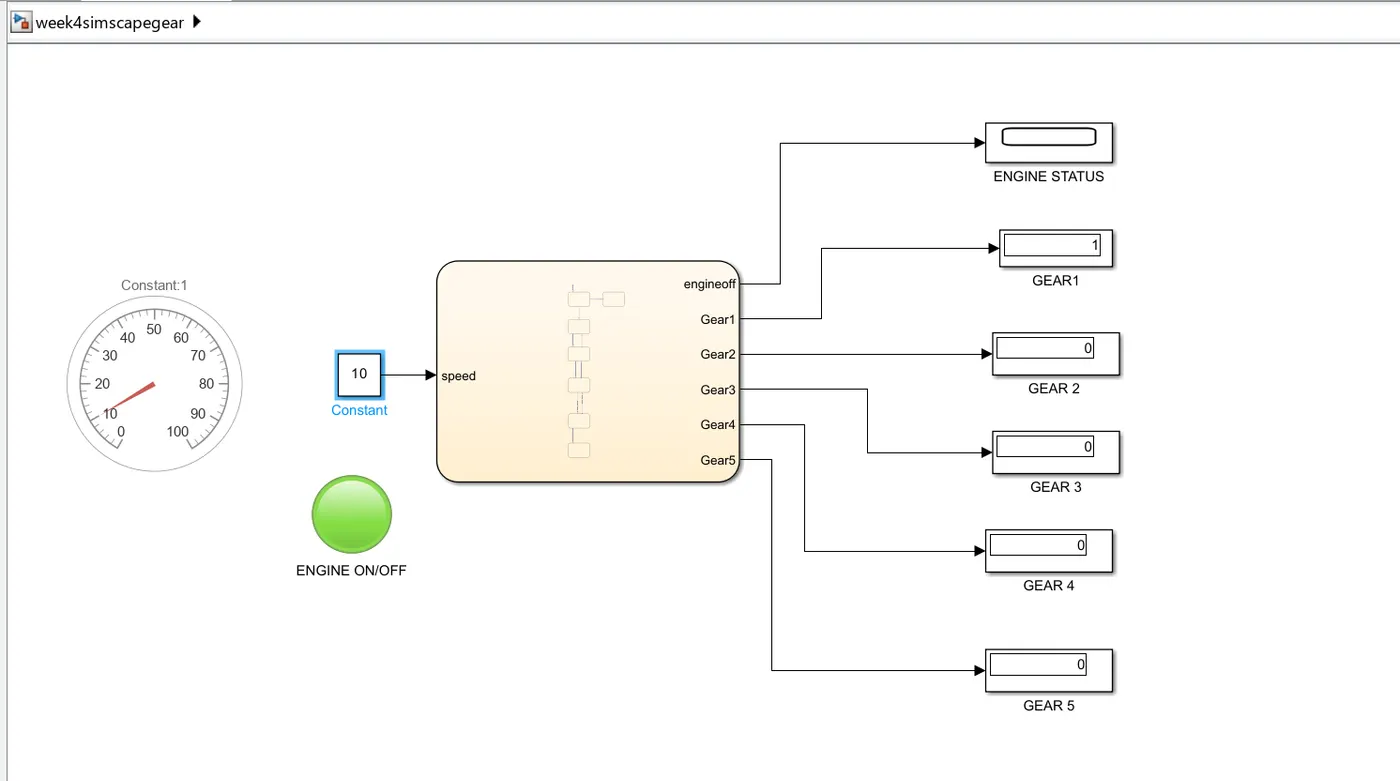
Step 13: Now, we assign value of ‘10’ to constant block that is connected to speed gauge and run the simulation of the gear shift model.
We can observe Engine turns ON [LAMP turns Green). Further we can observe Gear 1 has value of 1 in SCOPE that reflects Gear 1 is in usage.
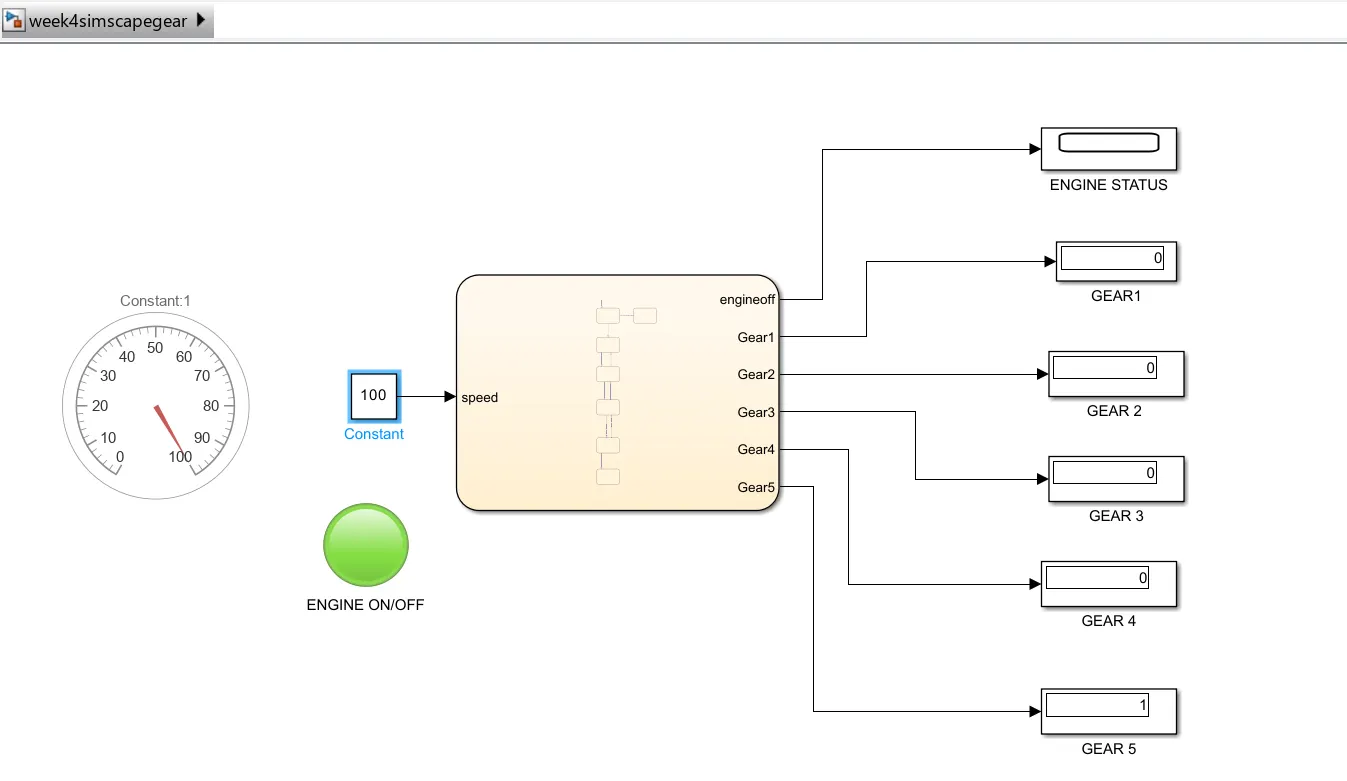
Step 14: Now, we assign value of ‘’100” to constant block that is connected to speed gauge and run the simulation of the gear shift model.
We can observe Engine turns ON [LAMP turns Green). Further we can observe Gear 5 has value of 1 in SCOPE that reflects Gear 5 is in usage.
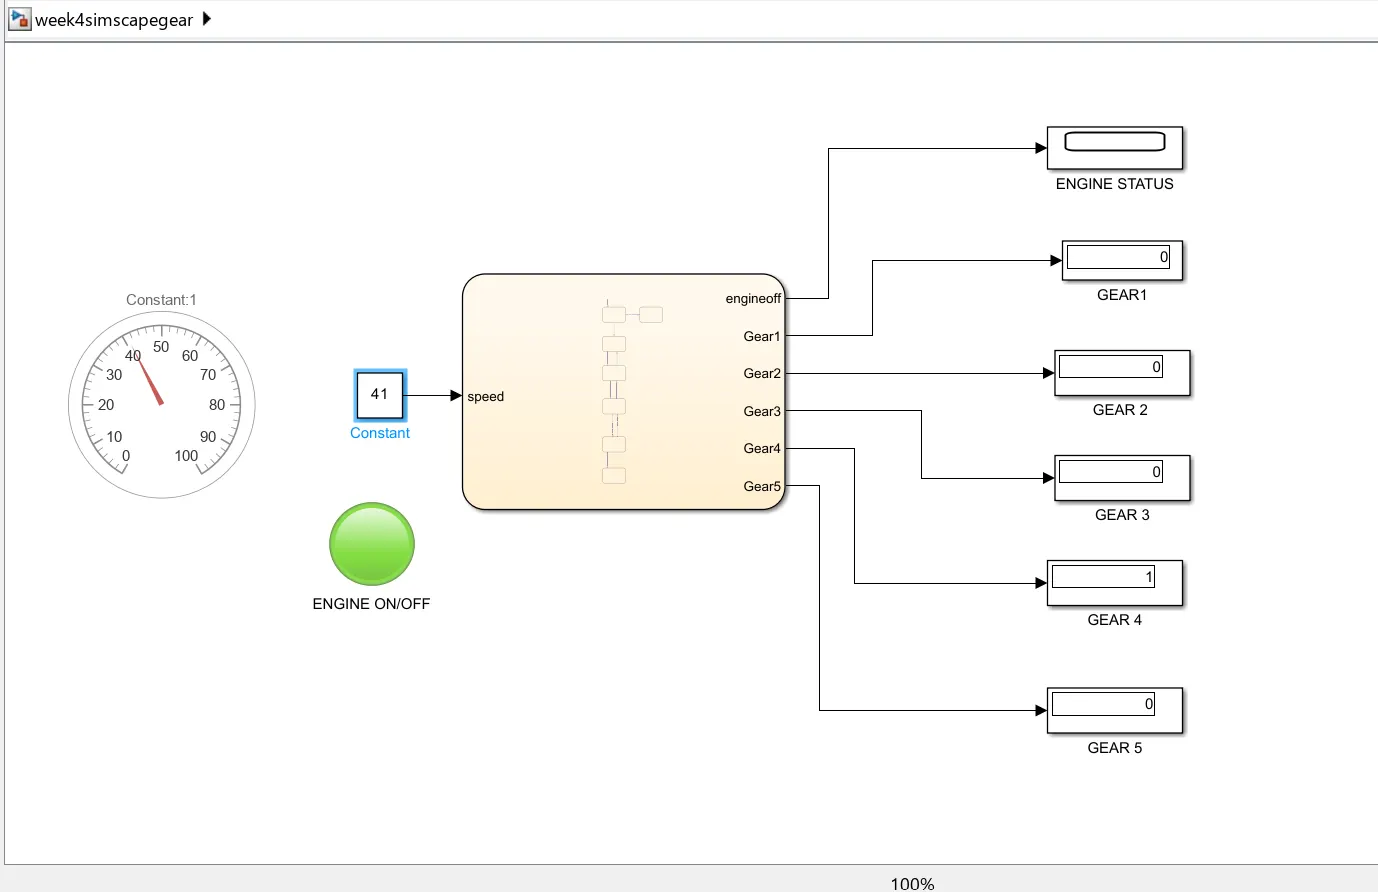
Step 15: Now, we assign value of ‘’41” to constant block that is connected to speed gauge and run the simulation of the gear shift model.
We can observe Engine turns ON [LAMP turns Green). Further we can observe Gear 4 has value of 1 in SCOPE that reflects Gear 4 is in usage.
Result:
Gear shift model link: https://drive.google.com/file/d/12IbKUX6OOwRPwoH7WjZq-RCEFwLQIwaz/view?usp=drive_link