Creating a state flow logic for washing machine and gear shift using Simulink
Q1: Implement control logic of a “washing machine” using Stateflow as per given sequence:
- If the power supply is available, the system gets activated
- If the Water supply is not available, stop the process & indicate through LED
- Soaking time should be 200s followed by Washing time of 100s.
- Then rinsing happens for next 20s & dryer runs for 50s
After all the processes have completed turn on the finished LED
Q2: Make a Simulink chart for the “Gear shift” logic as per below conditions:
Speed Range(kmph) Gear
0 to 15 1
16 to 25 2
26 to 40 3
41 to 60 4
Above 61 5
Give speed input while the simulation is running & display the gear number.
A: Stateflow: Stateflow provides a graphical language that includes state transition diagrams, flow charts, state transition tables, and truth tables. You can use Stateflow to describe how MATLAB algorithms and Simulink models react to input signals, events, and time-based conditions.
Chart: A Stateflow chart is a graphical representation of a finite state machine consisting of states, transitions, and data. You can create a Stateflow chart to define how a MATLAB algorithm or a Simulink model reacts to external input signals, events, and time-based conditions.
We are creating two Simulink models using state flow and charts.
A1:
Aim: To implement control logic of a 'washing machine' using stateflow.
Steps of washing machine:
- Soaking
- Washing
- Rinsing
- Drying
Conditions:
- If power is ON, the system should be activated.
- The process should taken place when water supply is available or else stop the process with indicating LED.
- Soaking time is 200 seconds.
- Washing time is 100 seconds.
- Rinsing time is 20 seconds.
- Drying time is for 50 seconds.
- After completion of all process finished LED should glow.
Procedure:
- Open Simulink in MATLAB for creating the model.
- Add two constant blocks from the library or by double clicking on screen and search for constant blocks. Name them as power and water.
- Add slider switches for both constant blcoks. Slider switch contains two values. '0' is for OFF consition and '1' for ON condition. Connect the slider switches with constant blocks of power and water. Slider switches are automatically changed when the values are changed for constant blcoks.
- Add chart block for the logic that need to be applied for washing machine. Chart block is a state flow logic used in this model. After adding, open it by double clicking on it.
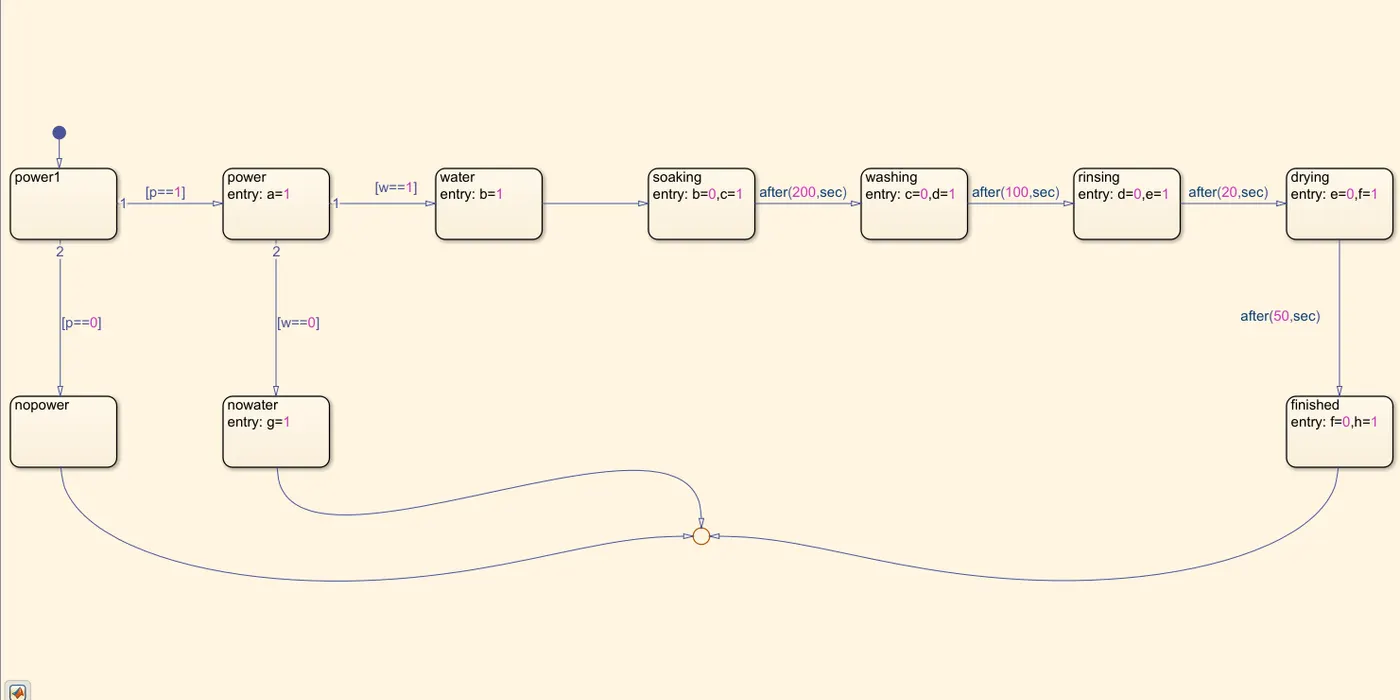
- In charts logics are applied by using states and connections. Add states for each and every process, starting with power. Process takes place when power is ON and OFF conditions. If power is ON, the process continues for next step, else terminates the whole logic. Add another state for power by giving entry, a=1. Join these two with a condition [p==1].
- The process also should continue when water supply is available only. Add state for water with a entry b=1. Join with the power state with a condition [w==1]. Add another state for no power with a a entry g=1. Join with the power block with a condition [w==0].
- When the power and water supply is available, washing machine processes takes place. Add state for soaking with an entry b=0, c=1.
- Add state for washing with and entry c=0, d=1. Join with the soaking state with a condition, after 200 seconds. This can be given by after(200,sec).
- Add state for rinsing with and entry d=0, e=1. Join with the washing state with a condition, after 100 seconds. This can be given by after(100,sec).
- Add state for drying with and entry e=0, f=1. Join with the rinsing state with a condition, after 20 seconds. This can be given by after(20,sec).
- Whole process is completed and this should be shown with a LED. Add a state for finished, with and entry f=0, h=1. Join with the drying state with a condition, after 50 seconds. This can be given by after(50,sec).
- The states of nopower, nowater and finished are connected to a single point. Open parameters pane for denoting inputs and outputs for the chart. This is found in prepare section in menu bar.
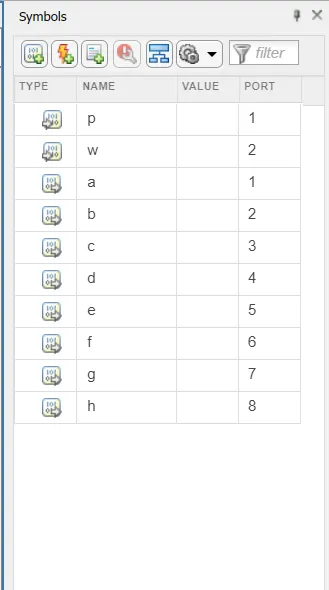
- Give input data for p and w. For a,b,c,d,e,f,g,h give output data.
- Come back to main model(out from the chart), which you can observe input and output ports available for chart. COnnect constant blcoks with input ports and give display blocks for all outputs.
- Name each with a process that takes place and connect all with the lamps providing its value as 1 with green light.
- Model is shown below and save the file. Run the simulation with 500 seconds.
Model: Initially, model is created for ON conditions for both power and water supply.
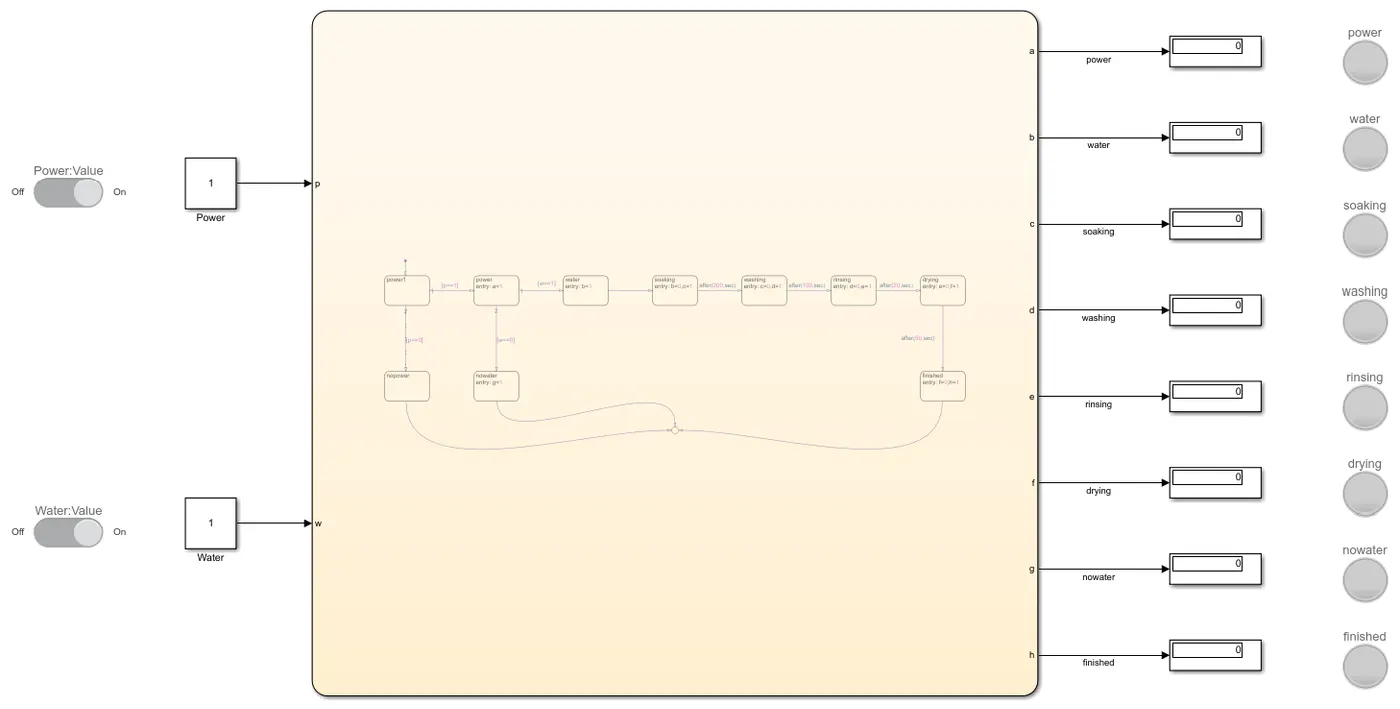
Chart:
Parameters in chart:
Conditions:
Condition 1: When the power is OFF and water supply is ON. The process does not not takes place even though water supply is available since the power is OFF. The system gets activated when power is available only.
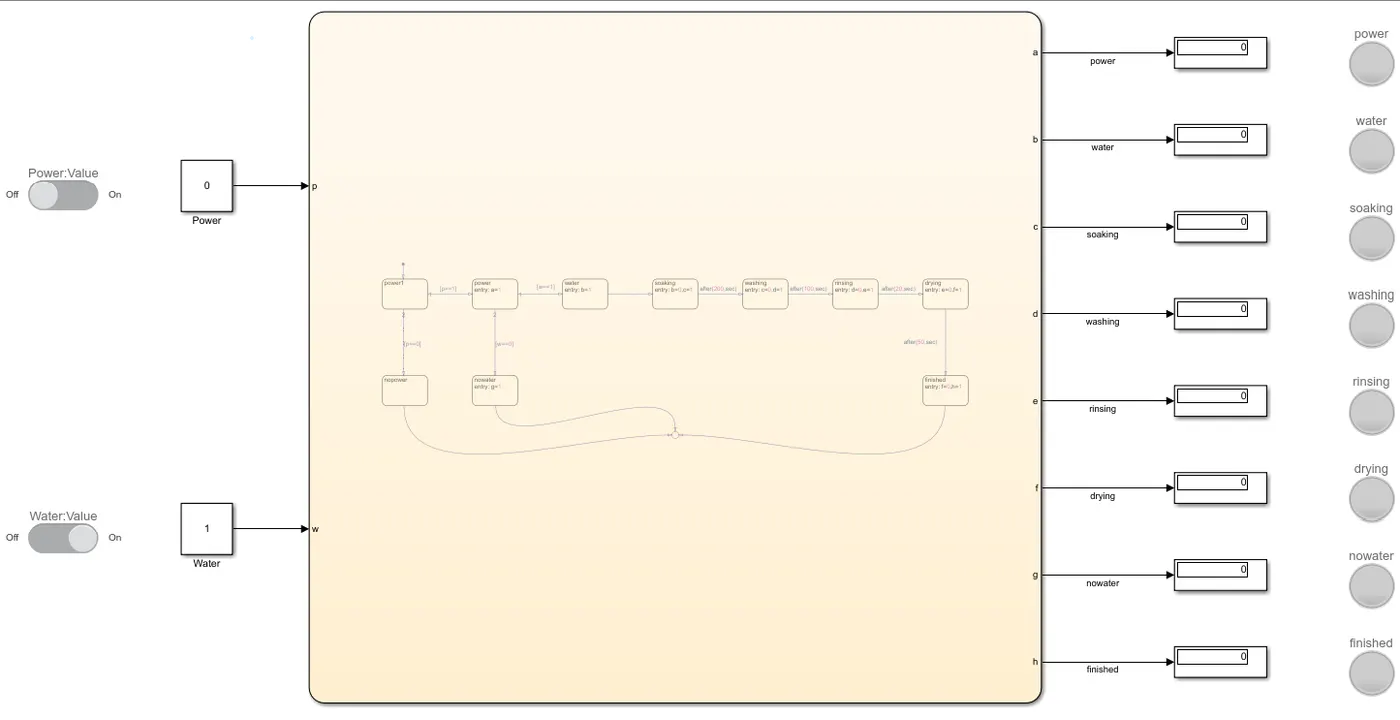
Condition 2: When the power is ON and water supply is OFF. Since the power is available and water supply is unavailable washing does not takes place and 'no water lamp' lights up.
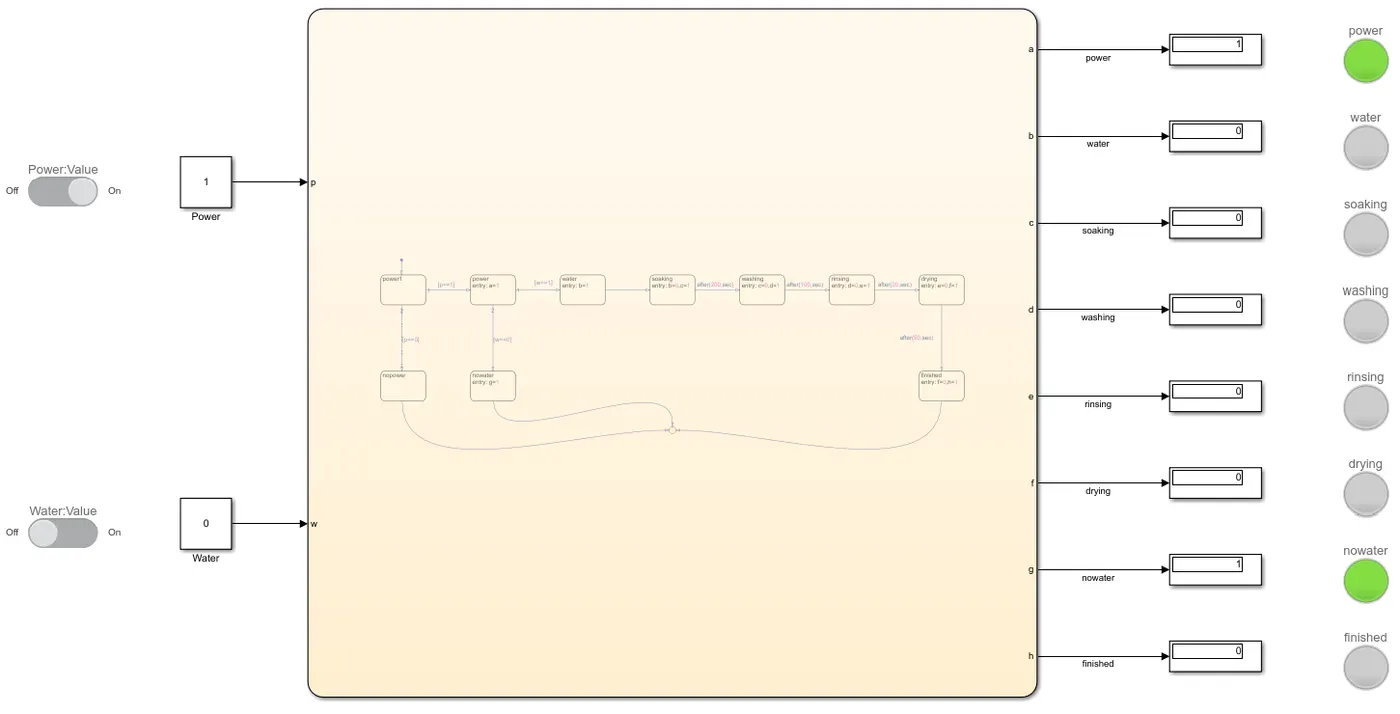
Observations: Step-wise procedure is exaplained.
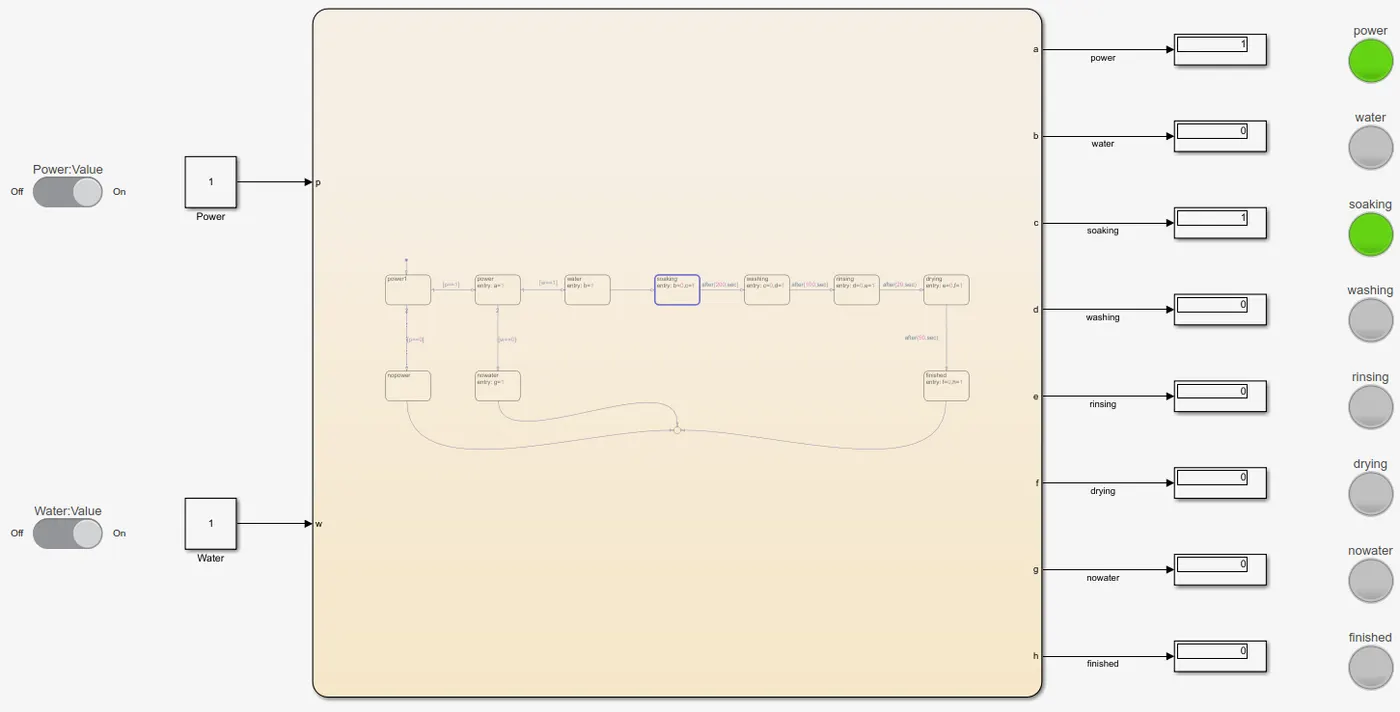
Step 1: When the power and water supply is on, soaking takes place for 200 seconds. Soaking lamp lights during this process.
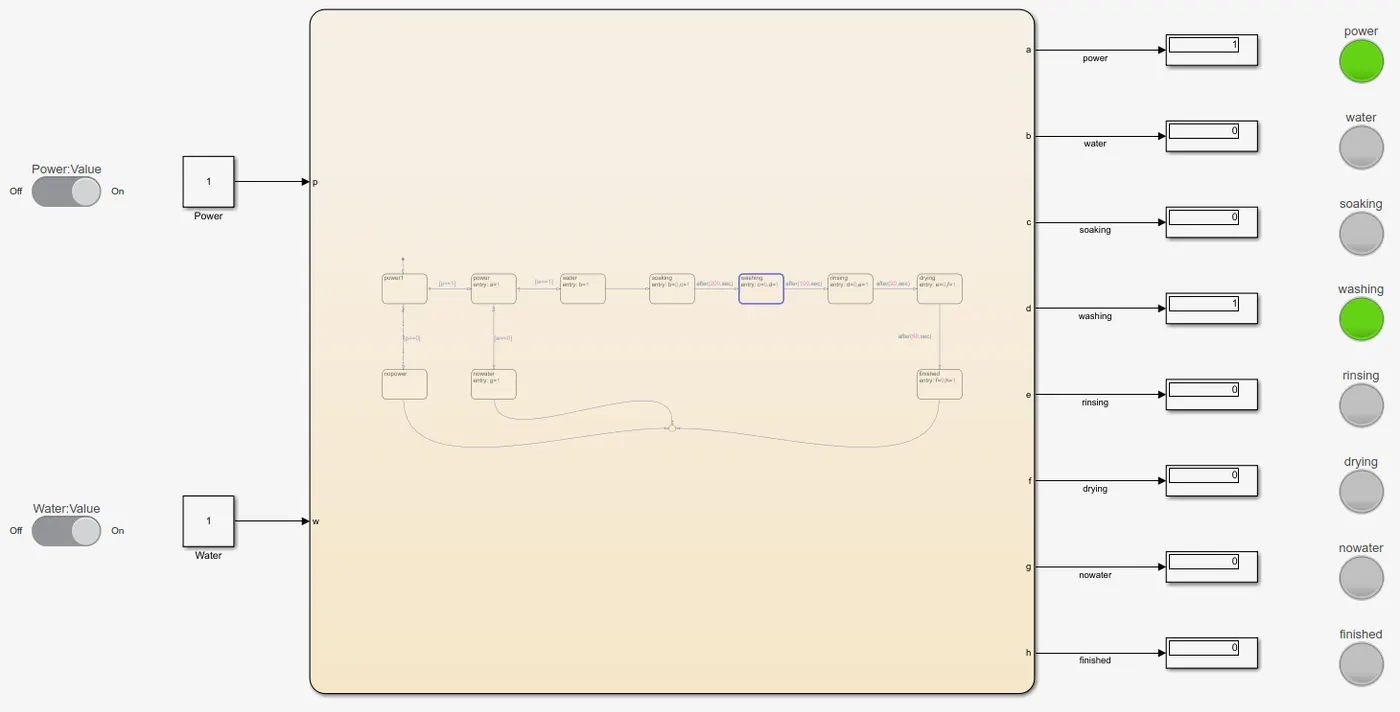
Step 2: The next step is washing. It takes place for 100 seconds. Washing lamp lights during this process.
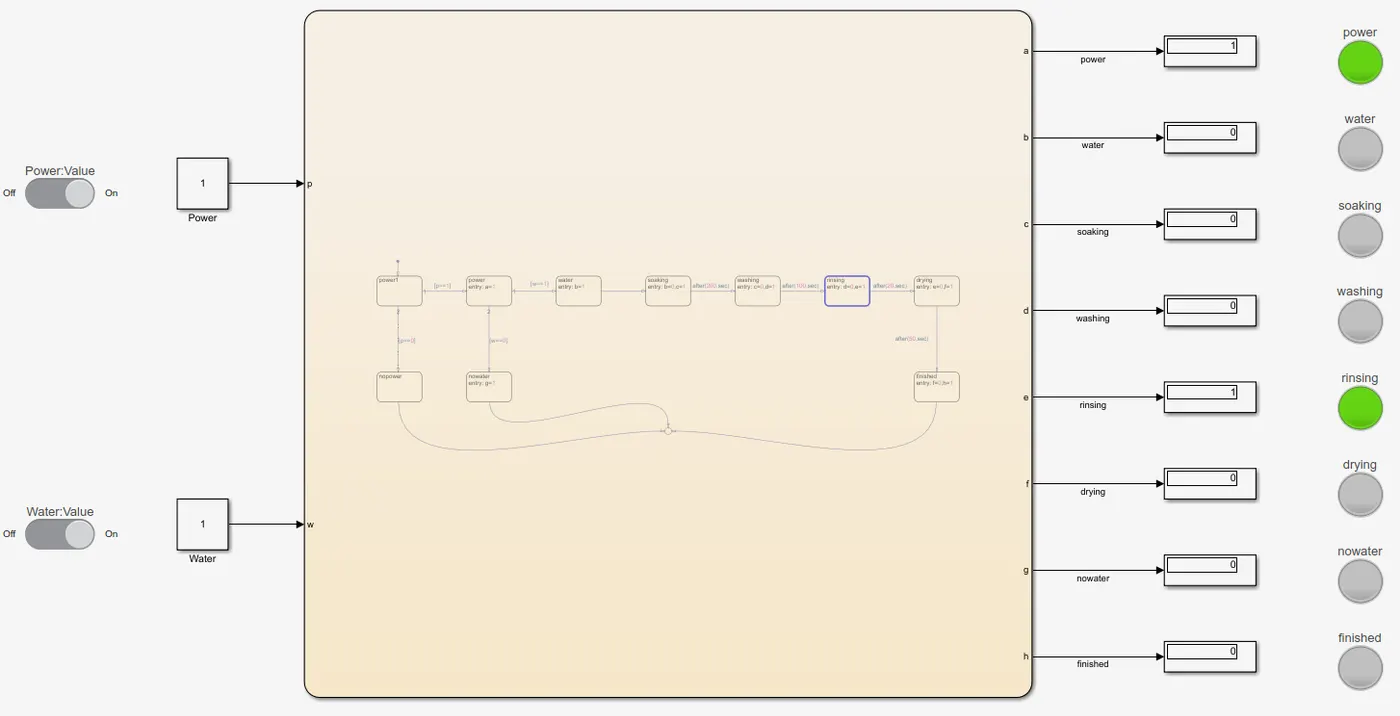
Step 3: The next step is rinsing. It takes place for 20 seconds. Rinsing lamp lights during this process.
Step 4: The next step is drying. It takes place for 50 seconds. Drying lamp lights during this process.
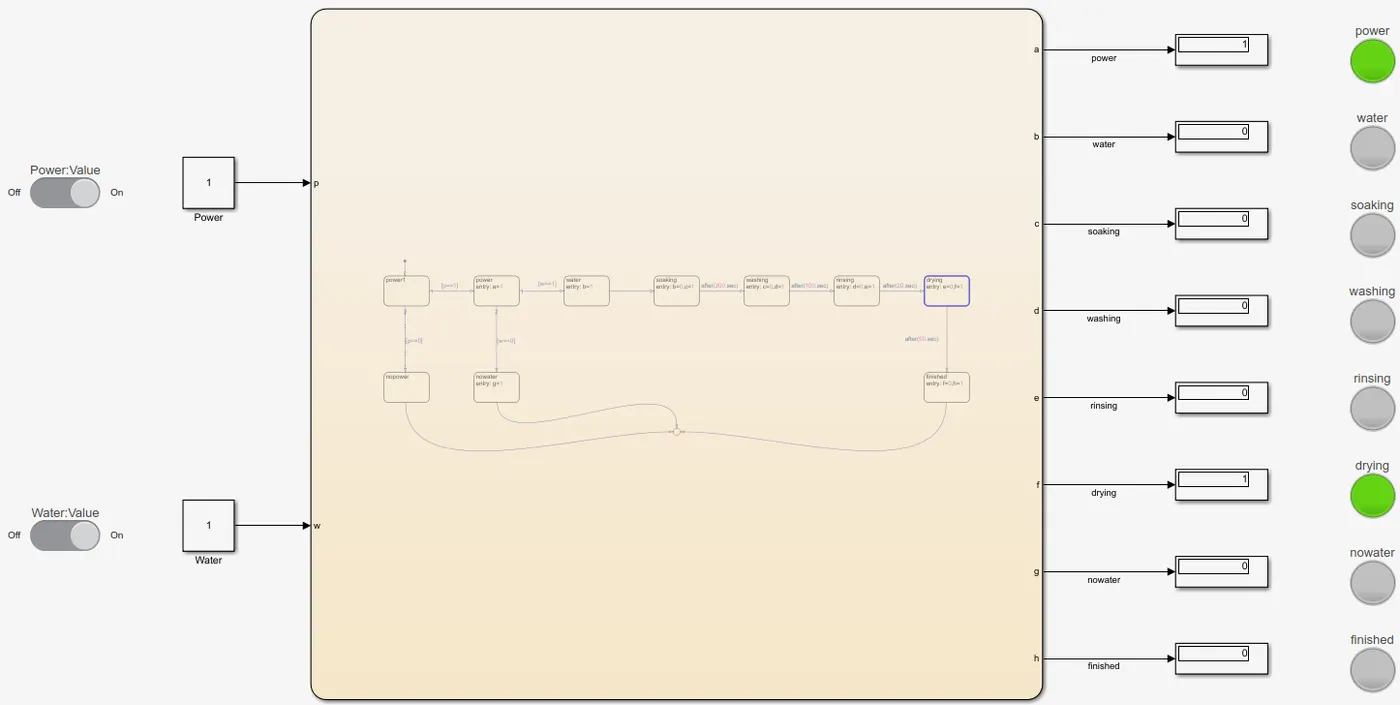
Step 5: After completion of all processes, finished bulb with light up.
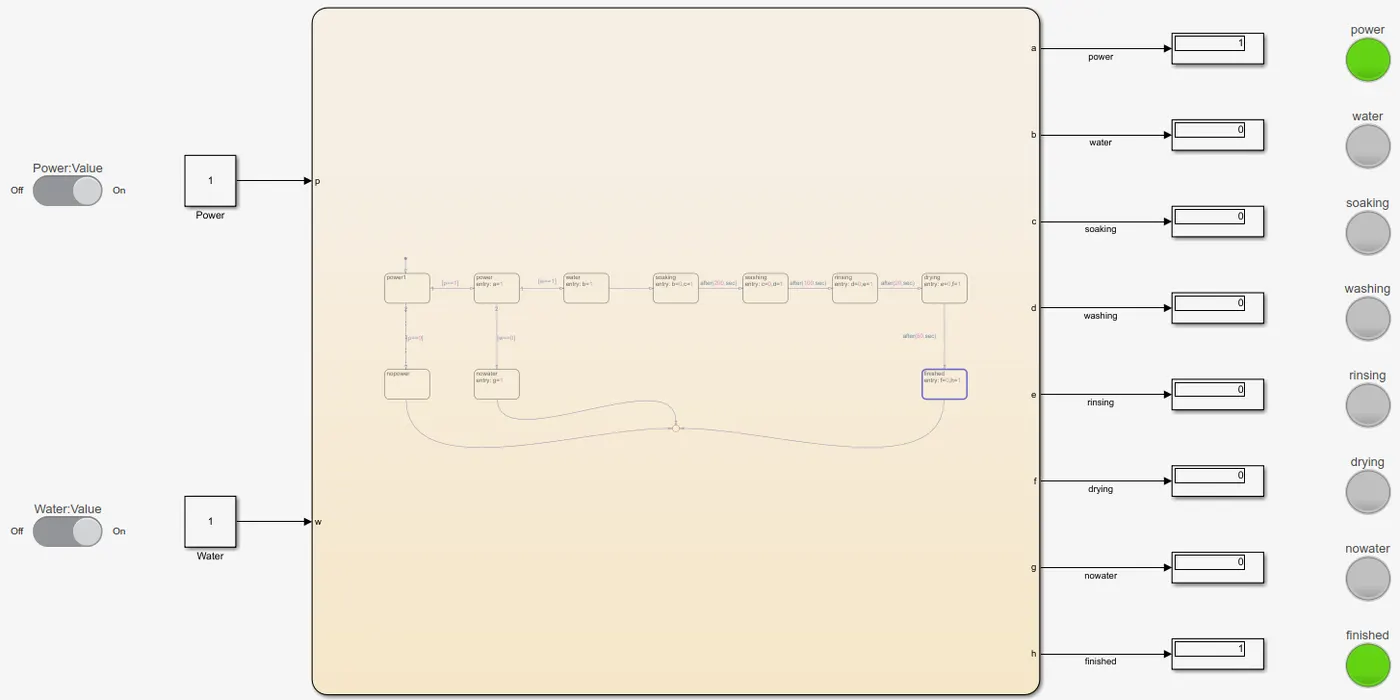
Conclusion: Hence, the state flow logic for washing machine is created in Simulink.
A2:
Aim: To make a Simulink chart for 'gear shift' logic under certain conditions.
Theory: Gear shifting is used for increasing or decreasing the speed, torque, or power of an engine by higher to lower or lower to higher gears.
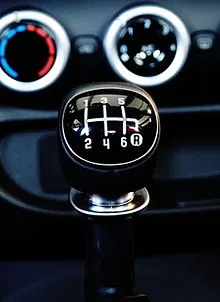
In the below figure, we can see the gear shift rod for manual transmission vehicle. It is used to change the gears in between according to the required speed.
Conditions:
| Speed range(kmph) | Gear |
| 0-15 | 1 |
| 16-25 | 2 |
| 26-40 | 3 |
| 41-60 | 4 |
| Above 60 | 5 |
Procedure:
- Open Simulink in MATLAB. Create a new blank model.
- Add a constant block and a chart. Open chart by double clicking on it.
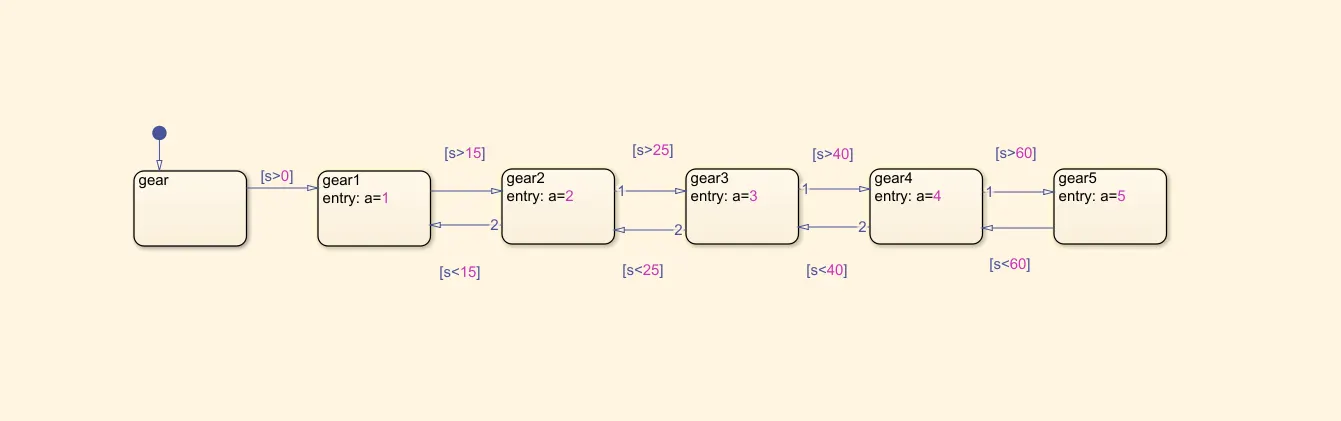
- Create states for each and every gear that needed to be changed. First create a state for input taking the values and name it as gear.
- Create annother state with gear1 and entry as a=1. Join with the previous state with a condition [s>0].
- Create a new state for second gear as naming it as gear2. Since there is a range of speed for each and every gear, we use joining in both directions.
- Gear1 to gear2 is given by [s>15] and in reverse [s<15].
- Create a new state for third gear as naming it as gear3. Gear2 to gear3 is given by [s>25] and in reverse [s<25].
- Create a new state for fourth gear as naming it as gear4. Gear3 to gear4 is given by [s>40] and in reverse [s<40].
- Create a new state for fifith gear as naming it as gear5. Gear4 to gear5 is given by [s>60] and in reverse [s<60].
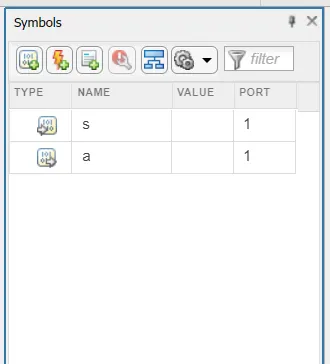
- Give parameters for s, a. Give input for 's' and output for 'a'.
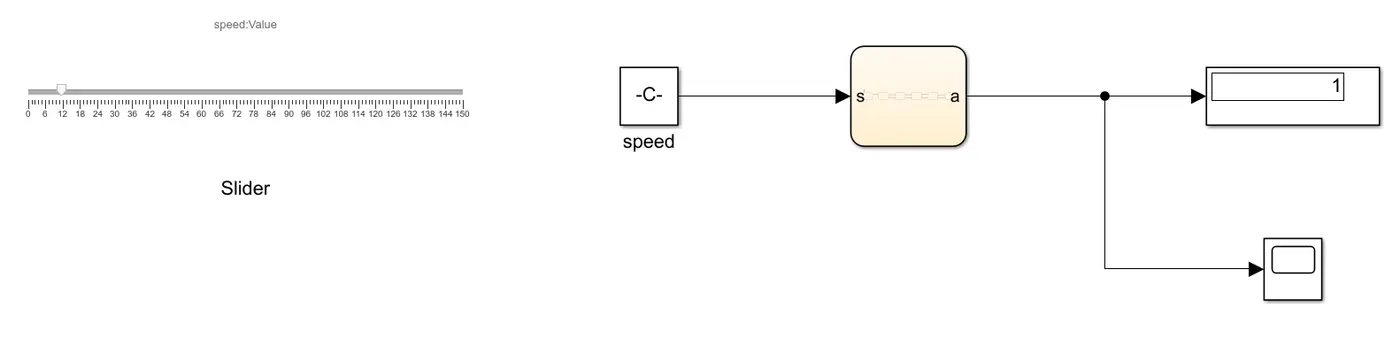
- Come out of the chart and add a slider block to give speed and input. Make a range for 0-150 values for slider. Connect the slider with the constant block.
- Join the constant block with the chart. Output needed to be known and it is displayed by display block and a scope block.
- Save the file and run the simulation for infinite seconds. This helps us to do changes while running the simulation. On slider we make changes for speed values.
Model:
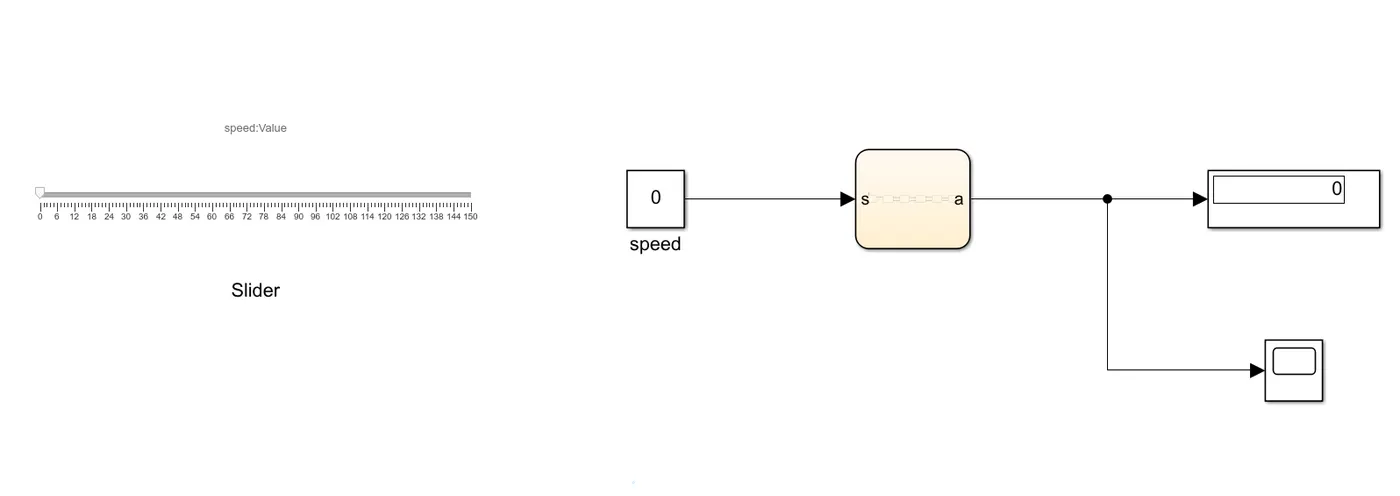
Chart:
Parameters:
Observations:
Gear 1: When the value for speed is changed in between 0-15, the display shows 1.
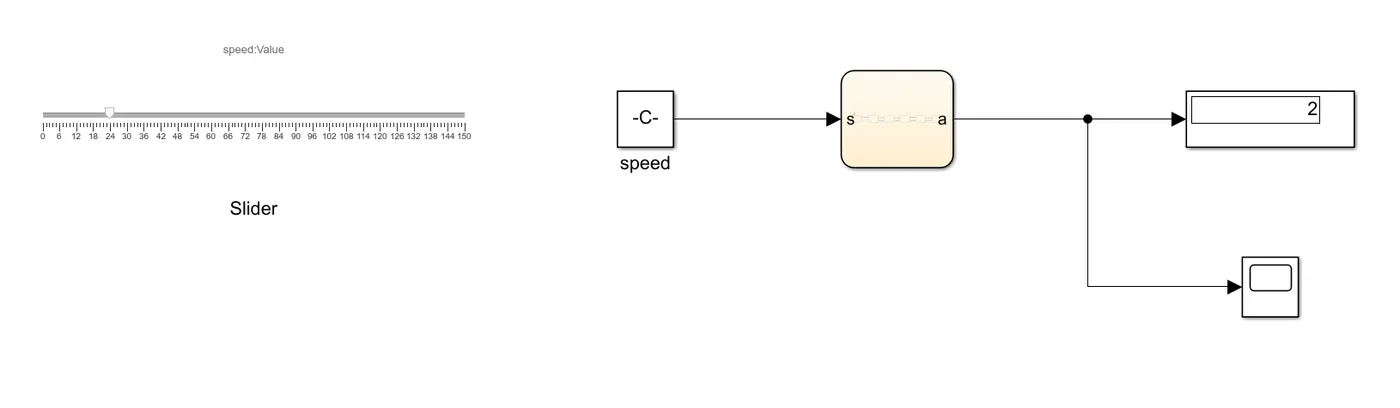
Gear 2: When the value for speed is changed in between 16-25, the display shows 2.
Gear 3: When the value for speed is changed in between 26-40, the display shows 3.
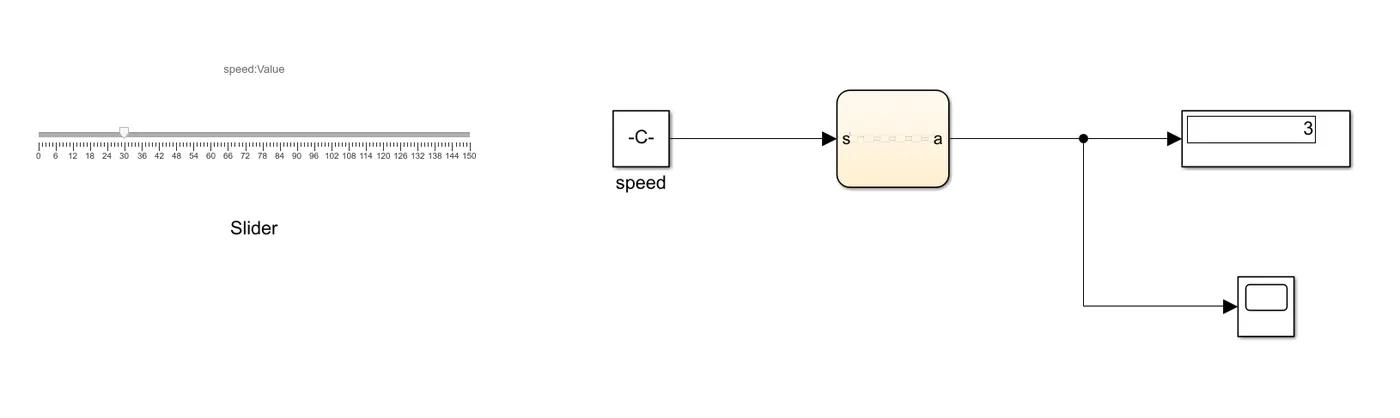
Gear 4: When the value for speed is changed in between 41-60, the display shows 4.
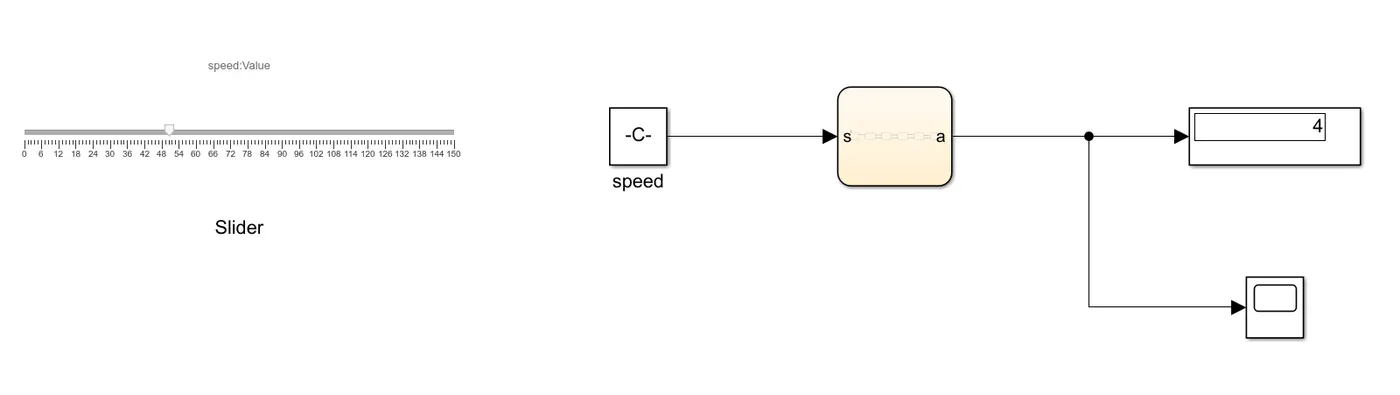
Gear 5: When the value for speed is changed for above 60, the display shows 5.
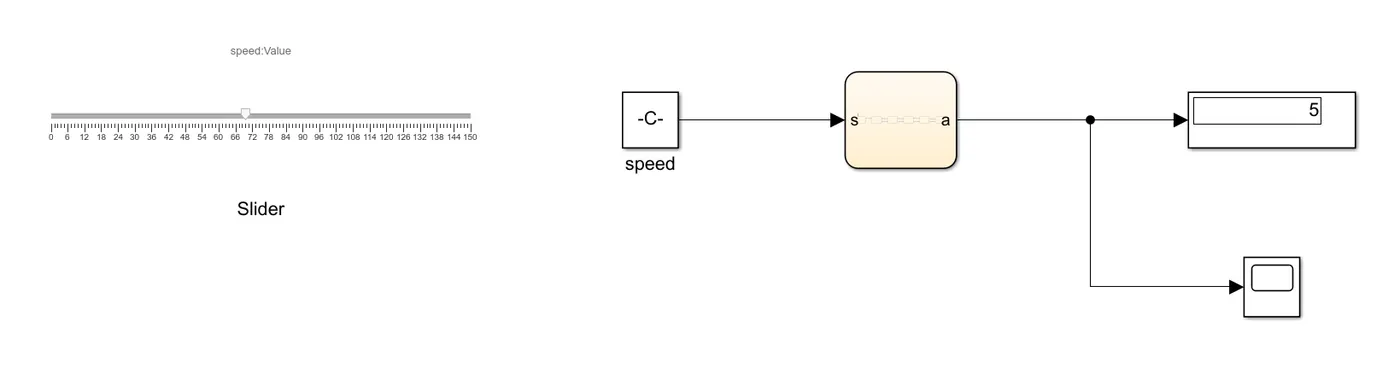
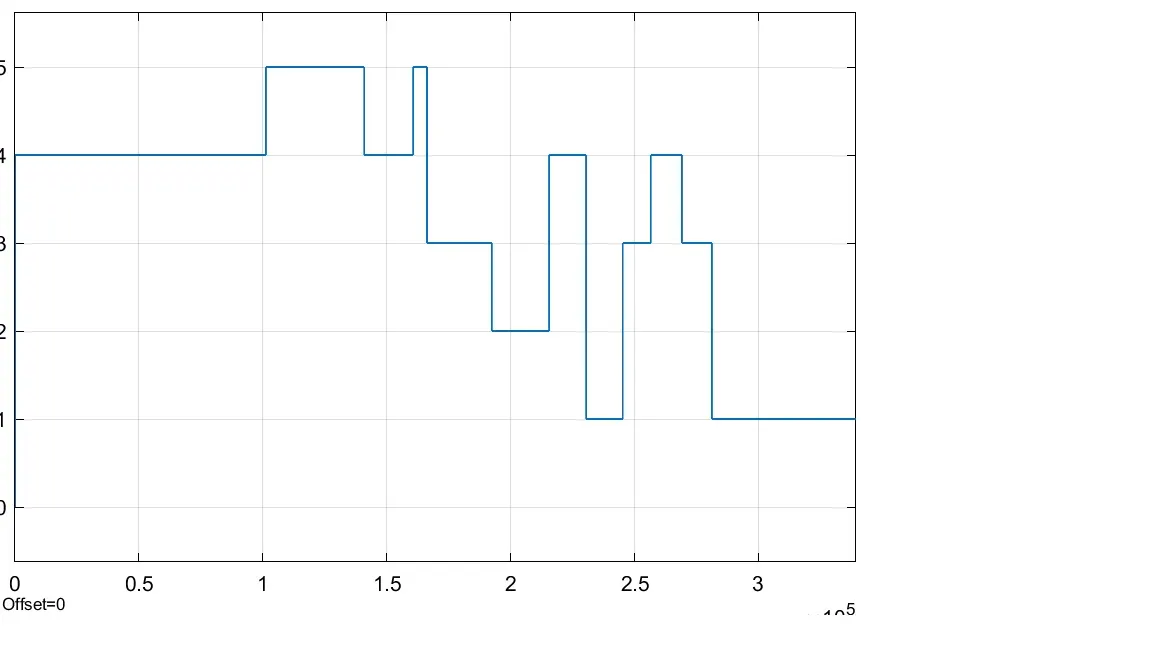
Scope: Output is plotted when the gear shifting is done from lower to higher and vice versa.
Conclusion: Therefore, the state flow logic is written for gear shift in Simulink.