Week - 4
AIM
1)Implement control logic of a “washing machine” using Stateflow as per given sequence:
- If the power supply is available, the system gets activated
- If the Water supply is not available, stop the process & indicate through LED
- Soaking time should be 200s followed by Washing time of 100s.
- Then rinsing happens for next 20s & dryer runs for 50s
After all the processes have completed turn on the finished LED
2) Make a Simulink chart for the “Gear shift” logic as per below conditions:
Speed Range(kmph) Gear
0 to 15 1
16 to 25 2
26 to 40 3
41 to 60 4
Above 61 5
Give speed input while the simulation is running & display the gear number
BLOCKS USED FOR AIM 1
1. Toggle Switch: To switch ON/OFF power and water supply. 2 nos of toggle switch are used
2. Constant block: To connect to the toggle switch and gives toggle output 1 or 0. 2 nos are used
3) Chart: To draw stateflow diagram of washing machine working
4) GoTo block: To collect the working process of washing machine based on Simulation time(soak,wash,rinse,dry). Other necessary details are collected from GoTo block
5) From block: To collect the output from GoTo block and connect to scope block. Equal number of GoTo block and From block are used
6) Scope: To analyse the working of washing machine against Simulation time by collecting output from From block
7) Lamp: Used as indicator to show each state of washing machine. Green light indicates the current process in stateflow in washing machine. Red light indicates that the corresponding action is not executing this time
BLOCK DIAGRAM
The washing machine simulink program is attached in google drive as washingmachine.slx
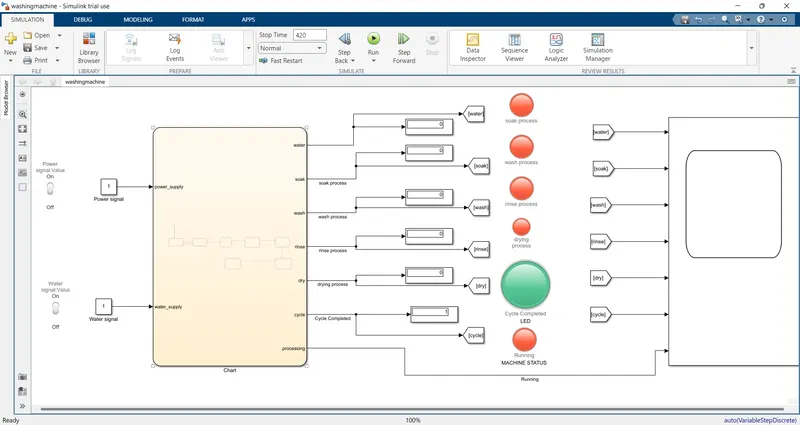
CHART STATEFLOW DIAGRAM
PROCEDURE
EXPLANATION OF SIMULATION BLOCK
1) Turn on the toggle switch for both power supply and water supply
2) Connect the power and water toggle switch to 2 constant block such that whenever the toggle switch is ON, constant block shows 1 and output and whenever the toggle switch is OFF, constant block shows 0 as output
3) Connect the output from constant block to the chart block. The chart block receives that output as its input
4) The chart block receives water_supply and power_supply as its input
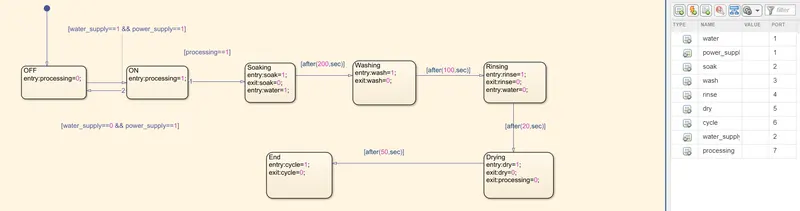
5) When the chart block satisfies the input condition, which is enclosed in [],it executes the case 1 or case 2. The case 1 is the state flow process of washing machine. The case 2 is the indicator button showing red colour, when the water supply is not there
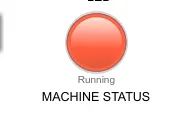
6) Whenever the water supply switch is not turned ON, it is indicated by this button shown below. Also, after the cycle completed, this button shows red colour. The button is green when the machine is running
7) Whenever each process is executing in washing machine inside the chart flow diagram, it is indicated through green colour in LED as shown outside
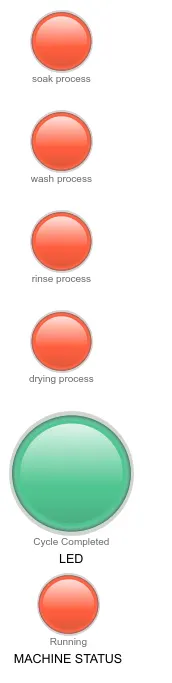
The working of indicator LED can be understood by clicking the step forward button adjacent to run simulation. Whenever each process is running inside chart, the corresponding LED light is switched ON by turning green
8)Each process in the washing machine is analysed against simulation time using scope block.This is done by connecting scope block to the output of the chart stateflow diagram. This is to analyse what is going on inside washing machine (chart stateflow diagram) during simulation run. The simulation analysis diagram is shown below
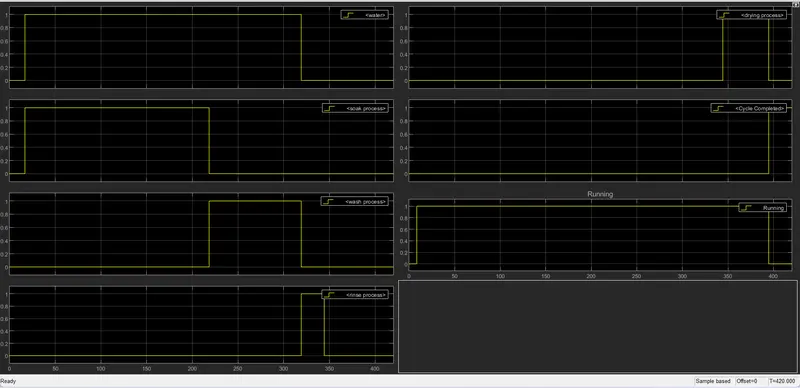
The simulation time is set as 420 sec, so as to analyse result accurately
EXPLANATION OF CHART STATEFLOW DIAGRAM
When the water supply and power supply are switch ON, chart receives it as input as 1. When the both input is 1, washing machine is switch On and moves to processing stage. Then it moves to soaking stage, during soaking water is feed into machine that is shown as entry:water=1.After soaking for 200 sec, it moves to washing state. After washing for 100 sec, then rinse for 20 sec. During the start of rinsing, water is drained out as entry:water=0.Then rinsing start (This can be understood from graph). After rinsing for 20 sec, then starts drying. After 50 sec, drying finished, then the cytcle completed, which is indicated as green colour through LED
BLOCKS USED FOR AIM 2
1) Toggle Switch: To switch ON the engine
2)Constant block: To connect to toggle switch and slider gain
3) Slider gain: To change the speed of vehicle
3)Chart block: To indicate the stateflow of shifting gear mechanism of vehicle
4)Scope block:To study the variation of speed as per the operation of slider gain block. Also to understand the shifting gear mechanism when the speed changes
5) Display: To indicate the gear number as per the change in speed
BLOCK DIAGRAM
The gear changing display program is attached in google drive as gearsimulinkchallenge.slx
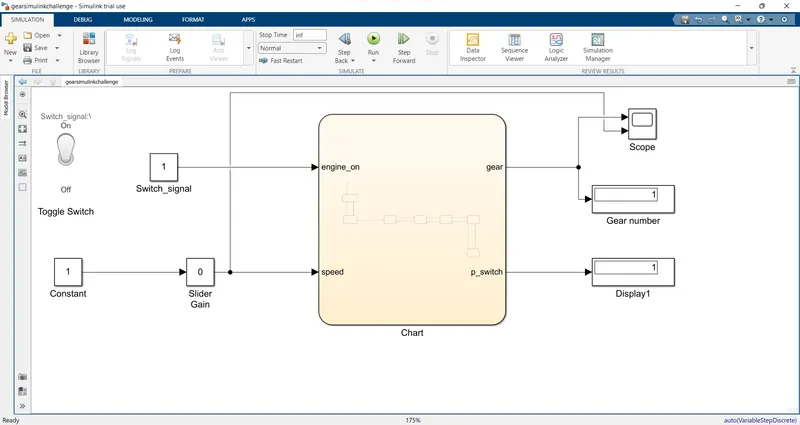
CHART STATEFLOW DIAGRAM
PROCEDURE
EXPLANATION OF SIMULATION BLOCK
1)When the toggle switch is turned ON, the engine start,which is represented by engine_on connected as input to chart diagram. If switched off, the gear changing mechanism won't work, ie, the gear number won't display as per the change in slider values (speed)
2)The slider block is also connected to chart so as to give the varying speed as input
3)The output of the chart block is gear number and power switch ON/OFF condition. The gear number displays the values from 1 to 5, as per the varying speed input from slider block. The another display block indicates the ON/OFF condition of power switch so that the engine start
4) The gear number output and slider gain input are connected to same scope block to study the how the gear number changes when the speed is changed
5) The simulation time is set as infinity (inf)
EXPLANATION OF CHART STATEFLOW DIAGRAM
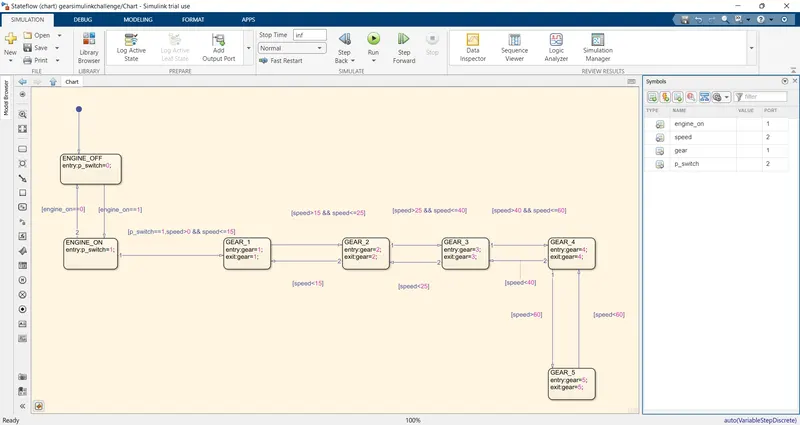
At first, the engine is in OFF state. When the toggle switch is turned ON, the engine starts and the chart receives engine_on as input, engine_on=1. When the engine_on==1, then only the gear number is displayed. When the toggle switch is OFF, chart receives engine_on=0 as input, and the gear number is not displayed when slider value changes.
When toggle switch is turned on, it turnes the power switch on, by showing p_switch=1 and ENGINE is ON. When the speed increases from 0-140, it executes the corresponding block conditions as shown in chart diagram. When the speed reduces, then also the gear number changes as it is shown in reverse direction arrow in the block. The speed conditions are shown in []. Based on the speed input, the chart executes the suitable gear block as output and then the corresponding gear number is displayed as output in chart block