Project 1 - Parsing NASA thermodynamic data
Objective:-
1) To develop a function that extracts 14 coefficients and calculates Specific heat,enthalpy and entropy for all 53 species in data file
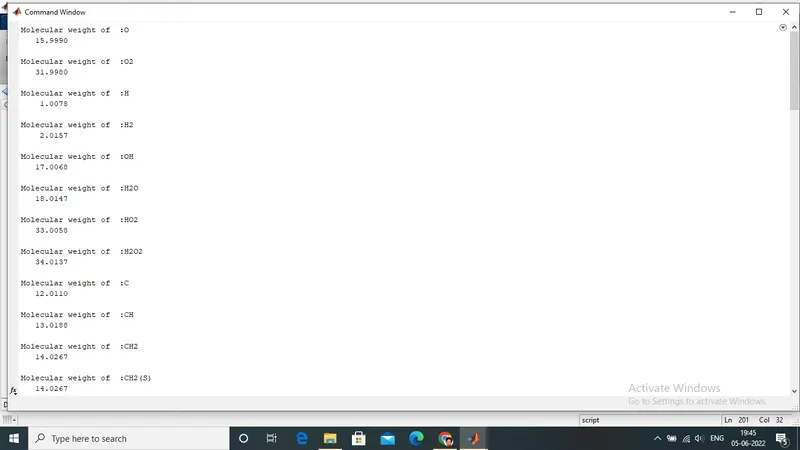
2)Develop a code to calculate molecular weight of each species and display it in command window
3)To plot Specific heat,enthalpy and entropy Vs local temperature range and dump them in seperate folder in different location
Principle:-
NASA came up with the polynomials of 53 species to calculate Cp,H and S
Formulas:-
Formulas for calculating Cp,H and S are same as shown by skill lync on challenge page
Steps for doing program:-
Step 1:We open a file THERMO.dat in read only format
Step 2:Reading lines of file using fgetl command to skip unnecessary lines. After skipping unnecessary lines, splitting the character array that we get from fgetl command and converting it to number format using str2num() for global temp range and 14 coefficients
Step 3:Create element symbol array by looking at 53 species from data file and create the atomic mass array with same array size of element symbol array
Step 4:Create for loop for accessing 53 species in data file
Step 5:Create if loop to put convenient values for local temperature ranges for 53 species
Step 6:Getting the species name every time for 53 iterations using programing techniques
Step 7:Create low temperature range and high temperature range using local temperature values with linspace size as 500
Step 8:Use of code to calculate molecular weight using atomic weight by adding each atomic weight
Step 9:Displaying molecular weight by making use of strcat() for convenience
Step 10:Use for loop to fetch 3 lines below each species as character array(14 coefficients) and convert it to number array
Step 11:Make 14 coefficient number array to 3X5 array (make last coefficient as zero) and convert 3X5 array to 1x15 array to store coefficients. 1 X 15 array is creating for easily accessing the values of coefficients
Step 12:Reading high temperature and low temperature coefficients to seperate variable array
Step 13:Calculation of high & low temperature values of Cp,H and S using for loop
Step 14:Make new directory using mkdir() to dump the image of plot for Cp,H and S Vs Temperature(T) in seperate folder for 53 species in data file
1)Code for calculating molecular mass
element_symbol=['O','H','C','N','AR'];
atomic_weight=[15.999;1.00784;12.011;14.0067;19.974;19.974];
for i=1:length(species)
for j=1:length(element_symbol)
if species(i)==element_symbol(j)
molecular_weight=molecular_weight+atomic_weight(j);
pos=j;
end
end
n=str2num(species(i));
if n>1
molecular_weight=molecular_weight+atomic_weight(pos)*(n-1);
end
end
%Displaying molecular weight of species
disp(strcat('Molecular weight of :',species));
disp(molecular_weight);
2)Code to Calculate Cp
Cphigh=0;Cplow=0;
for i=1:5
Cphigh=Cphigh+high_temp_coeff(i).*Thigh.^(i-1); %High temperature coefficient is evaluating using high temperature range
end
Cphigh=Cphigh*8.314; %8.314 is Universal gas constant
for i=1:5
Cplow=Cplow+low_temp_coeff(i).*Tlow.^(i-1); %Low temperature coefficient is evaluating using low temperature range
end
Cplow=Cplow*8.314;
3)Code to Calculate H
Hhigh=0;Hlow=0;
%high temp H
for i=1:5
Hhigh=Hhigh+(high_temp_coeff(i).*Thigh.^(i-1))/i;
end
Hhigh=Hhigh+high_temp_coeff(6)./Thigh;
Hhigh=Hhigh.*8.314.*Thigh;
%low temp H
for i=1:5
Hlow=Hlow+(low_temp_coeff(i).*Tlow.^(i-1))/i;
end
Hlow=Hlow+low_temp_coeff(6)./Tlow;
Hlow=Hlow.*8.314.*Tlow;
4)Code to Calculate S
Shigh=0;Slow=0;
%high temp S
for i=2:5
Shigh=Shigh+(high_temp_coeff(i).*Thigh.^(i-1))./(i-1);
end
Shigh=Shigh+(high_temp_coeff(1).*log(Thigh))+high_temp_coeff(7);
Shigh=Shigh.*8.314;
%low temp S
for i=2:5
Slow=Slow+(low_temp_coeff(i).*Tlow.^(i-1))./(i-1);
end
Slow=Slow+(low_temp_coeff(1).*log(Tlow))+low_temp_coeff(7);
Slow=Slow.*8.314;
5) Plotting function (Plot function is same for Cp,H & S)
figure(3)
plot(Tlow,Slow,Thigh,Shigh);
xlabel('Temperature');ylabel('Entropy');
legend('low temperature S','high temperature S');
grid on
title(species)
saveas(figure(3),'Entropy.jpg');
6)Making new directory to dump images in one folder
mkdir('D:\NASAprojectimage',species);
cd(strcat('D:\NASAprojectimage\',species));
7)Conditional statements to determine local temperature range for 53 species
if a<=19||a>=21&&a<=28
low_temp_range=200;high_temp_range=3500;
end
if a==20
low_temp_range=300;high_temp_range=3000;
end
if a==29
low_temp_range=300; high_temp_range=4000;
end
if a==30||a==31
low_temp_range=300; high_temp_range=5000;
end
if a>=32&&a<=41
low_temp_range=200; high_temp_range=6000;
end
if a==42
low_temp_range=300; med_temp_range=1382; high_temp_range=5000;
end
if a==43
low_temp_range=300; med_temp_range=1368; high_temp_range=5000;
end
if a==44
low_temp_range=300; med_temp_range=1478; high_temp_range=5000;
end
if a==45||a==46
low_temp_range=200; high_temp_range=6000;
end
if a>=47&&a<=51
low_temp_range=300; high_temp_range=5000;
end
if a==52
low_temp_range=200; high_temp_range=6000;
end
if a==53
low_temp_range=300; high_temp_range=5000;
end
A) Molecular weight display in command window
B)Screenshot showing seperate folder where images of Cp,H and S of 53 species are dumped

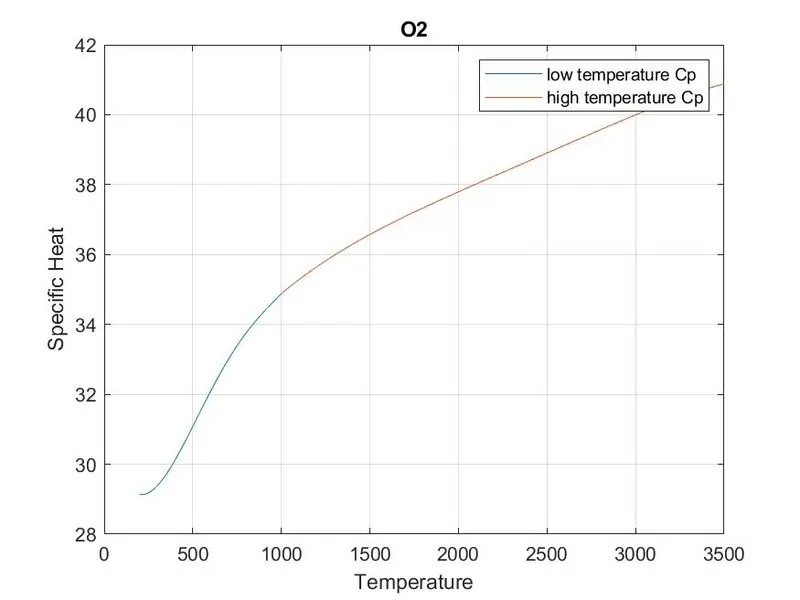
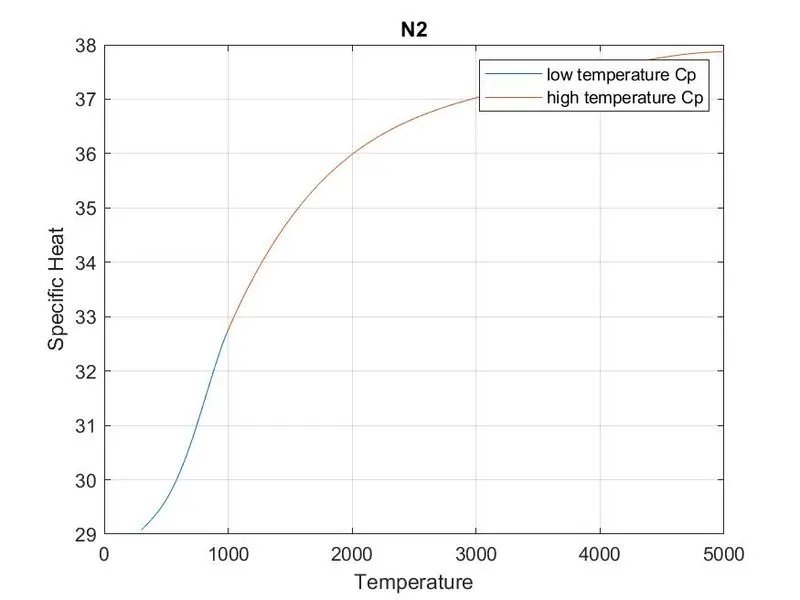
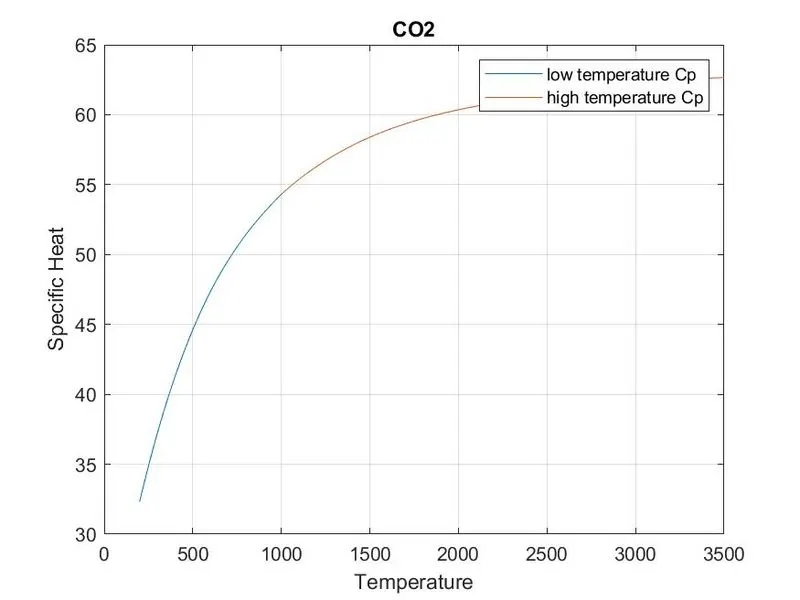
C)Cp Plots for O2,N2,CO2
MAIN PROGRAM CODE IS SHOWN BELOW
clear all;close all;clc;
f1=fopen('THERMO.dat','r');                         %Opening file THERMO.dat in read only format('r').File is in same worksheet directory
heading=fgetl(f1);                                  %Reading first line from file
glob_temp_char=fgetl(f1);                           %Reading global temperature reading
glob_temp_char_array=strsplit(glob_temp_char,' ');  %Splitting character array with spaces' '
%Converting global temperature character array to number array
for i=1:3
global_temp(i)=str2num(glob_temp_char_array{i+1});
end


med_glob_temp_range=global_temp(2);
med_temp_range=1000;
%Skipping the next 3 lines in file
for i=1:3
skip_line=fgetl(f1);
end


for a=1:53              %for loop for accessing 53 elements in file
    %Creating if loop for 53 elements for as to get local temperature range
if a<=19||a>=21&&a<=28
    low_temp_range=200;high_temp_range=3500;
end
if a==20
    low_temp_range=300;high_temp_range=3000;
end
if a==29
    low_temp_range=300; high_temp_range=4000;
end
if a==30||a==31
    low_temp_range=300; high_temp_range=5000;
end
if a>=32&&a<=41
    low_temp_range=200; high_temp_range=6000;
end
if a==42
   low_temp_range=300; med_temp_range=1382; high_temp_range=5000;
end
if a==43
   low_temp_range=300; med_temp_range=1368; high_temp_range=5000;
end
if a==44
   low_temp_range=300; med_temp_range=1478; high_temp_range=5000;
end
if a==45||a==46
   low_temp_range=200; high_temp_range=6000;
end
if a>=47&&a<=51
   low_temp_range=300; high_temp_range=5000;
end
if a==52
   low_temp_range=200; high_temp_range=6000;
end

if a==53
     low_temp_range=300; high_temp_range=5000;
end
%Code for molecular weight
element_symbol=['O','H','C','N','AR'];
atomic_weight=[15.999;1.00784;12.011;14.0067;19.974;19.974];
    find_species=fgetl(f1);         %Fetching the line in the file where species name exist
    species_char=strsplit(find_species,' ');%Splitting the character array where blank spaces there
    species=species_char{1};         %Getting first element from splitted array
    Tlow=linspace(low_temp_range,med_temp_range,500);   %Creating 500 values for low temperature coefficients
    Thigh=linspace(med_temp_range,high_temp_range,500); %Creating 500 values for high temperature coefficients
    molecular_weight=0;
    %Code to calculate molecular weight
for i=1:length(species)
    for j=1:length(element_symbol)
       if species(i)==element_symbol(j)
           molecular_weight=molecular_weight+atomic_weight(j);
            pos=j;
       end
    end
    n=str2num(species(i));
    if n>1
    molecular_weight=molecular_weight+atomic_weight(pos)*(n-1);
    end
end
    %Displaying molecular weight of species
    disp(strcat('Molecular weight of  :',species));
    disp(molecular_weight);

% To read all the 14 coefficients for particular species in one variable
% and store the 14 coefficients in one variable array
for k=1:3
A=fgetl(f1);
t=findstr(A,'E');
j=1;        if(k==1||k==2)
                for i=1:5
                coeff=A(j:t(i)+3);
                j=t(i)+4;
                carray(k,i)=strsplit(coeff,'');
                c(k,i)=str2num(carray{k,i});
                 tt=1;

                end
            end
            if(k==3)
                for i=1:4
                coeff=A(j:t(i)+3);
                j=t(i)+4;
                carray(k,i)=strsplit(coeff,'');
                c(k,i)=str2num(carray{k,i});
                c(k,5)=0;

                end

            end

end
%Code to convert 3X5 coefficient array to 1X15 array
ff=size(c);
x=1;
for j=1:ff(1)
    for i=1:ff(2)
        c1_array(x)=c(j,i);
        sp_c1_array(a,x)=c1_array(x);
        x=x+1;
    end
end


   high_temp_coeff=sp_c1_array(a,1:7);
   low_temp_coeff=sp_c1_array(a,8:14);
   %Code to Calculate Cp
   Cphigh=0;Cplow=0;
   for i=1:5
        Cphigh=Cphigh+high_temp_coeff(i).*Thigh.^(i-1);    %High temperature coefficient is evaluating using high temperature range
   end

   Cphigh=Cphigh*8.314;             %8.314 is Universal gas constant
    for i=1:5
        Cplow=Cplow+low_temp_coeff(i).*Tlow.^(i-1);        %Low temperature coefficient is evaluating using low temperature range
   end
   Cplow=Cplow*8.314;

   %plot Cp
  cur_dir=pwd;
 %Making new directory and putting it in folder
   mkdir('D:\NASAprojectimage',species);
   cd(strcat('D:\NASAprojectimage\',species));
   figure(1)
   plot(Tlow,Cplow,Thigh,Cphigh);
   xlabel('Temperature');ylabel('Specific Heat');
   legend('low temperature Cp','high temperature Cp');
   grid on
   title(species)
   saveas(figure(1),'Specfic heat.jpg');


   %Calculate H
   Hhigh=0;Hlow=0;
   %high temp H
   for i=1:5
        Hhigh=Hhigh+(high_temp_coeff(i).*Thigh.^(i-1))/i;
   end
   Hhigh=Hhigh+high_temp_coeff(6)./Thigh;
   Hhigh=Hhigh.*8.314.*Thigh;

   %low temp H
    for i=1:5
        Hlow=Hlow+(low_temp_coeff(i).*Tlow.^(i-1))/i;
   end
   Hlow=Hlow+low_temp_coeff(6)./Tlow;
   Hlow=Hlow.*8.314.*Tlow;

   %plot H

   figure(2)
   plot(Tlow,Hlow,Thigh,Hhigh);
   xlabel('Temperature');ylabel('Enthalpy');
   legend('low temperature H','high temperature H');
   grid on
   title(species)
   saveas(figure(2),'Enthalpy.jpg');

   %Calculate S
   Shigh=0;Slow=0;
   %high temp S
   for i=2:5
       Shigh=Shigh+(high_temp_coeff(i).*Thigh.^(i-1))./(i-1);
   end
     Shigh=Shigh+(high_temp_coeff(1).*log(Thigh))+high_temp_coeff(7);
     Shigh=Shigh.*8.314;
     %low temp S
   for i=2:5
       Slow=Slow+(low_temp_coeff(i).*Tlow.^(i-1))./(i-1);
   end
     Slow=Slow+(low_temp_coeff(1).*log(Tlow))+low_temp_coeff(7);
     Slow=Slow.*8.314;

      %plot S

   figure(3)
   plot(Tlow,Slow,Thigh,Shigh);
   xlabel('Temperature');ylabel('Entropy');
   legend('low temperature S','high temperature S');
   grid on
   title(species)
   saveas(figure(3),'Entropy.jpg');

     med_temp_range=1000; %As the med_temp_range is 1000 for most of the species,initialising it to 1000,but the value changes to 3 or 4 species based on conditional statements
end