Week - 4
Challenge:
- Implement control logic of a “washing machine” using Stateflow as per given sequence:
- If the power supply is available, the system gets activated
- If the Water supply is not available, stop the process & indicate through LED
- Soaking time should be 200s followed by Washing time of 100s.
- Then rinsing happens for next 20s & dryer runs for 50s
After all the processes have completed turn on the finished LED
2. Make a Simulink chart for the “Gear shift” logic as per below conditions:
Speed Range(kmph) Gear
0 to 15 1
16 to 25 2
26 to 40 3
41 to 60 4
Above 61 5
Give speed input while the simulation is running & display the gear number.
Objective: #1
1. Implement control logic of a washing machine using stateflow by giving certain condition as power input and water input. As per this input, the machine operates and obtain the output by lamp light.
Description:
Initially this challenge need explanation of stateflow
Stateflow: It is a control logic tool used to model reactive systems via state machines and flow charts within a simulink model.
- As usual open the matlab, then simulink and open the chart by doble click or search through library
- After double click on the chart block, you get the entire window changes into yellowish brown theme, so we learn lot about stateflow and its conditions.
- lets dive into the challenges
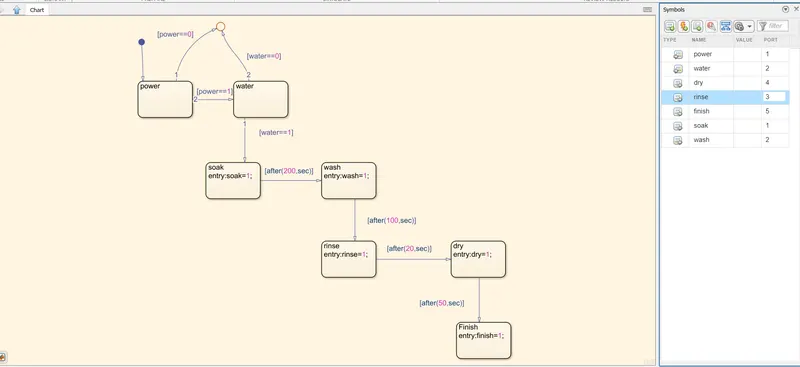
- Get number of state block you need, and connect with neccesary path
- assign the value for power which is 0 or 1 (off or on) conditions
- Same as water, but here water available or not (1 or 0)
- The condition which both satisfied power and water then go to the step soaking for 200 seconds
- After completing soaking, exit the soaking block with value 1 which is completed here
- The conditions same for washing,rinsing, and drying;
- Finally finished signal get activated for completion
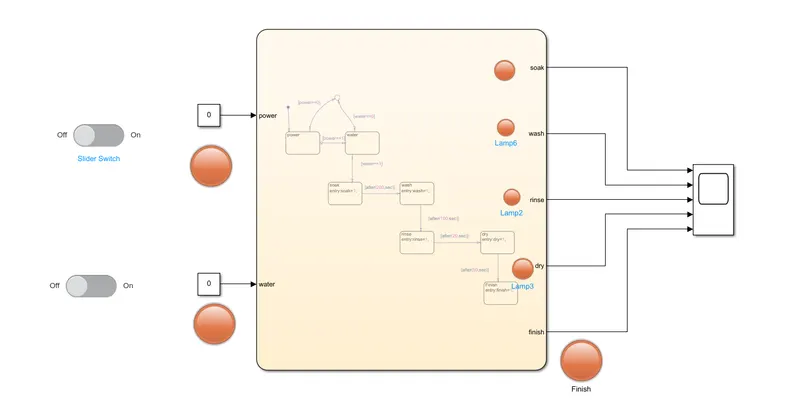
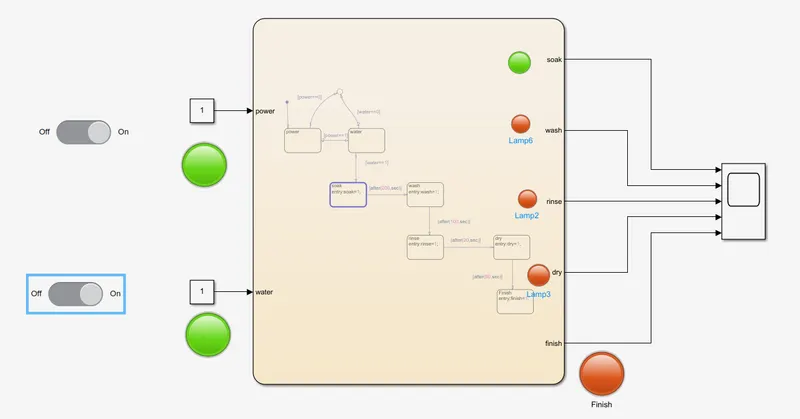
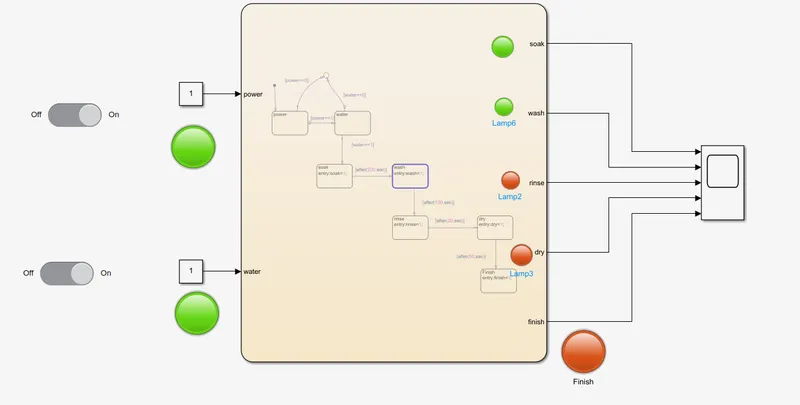
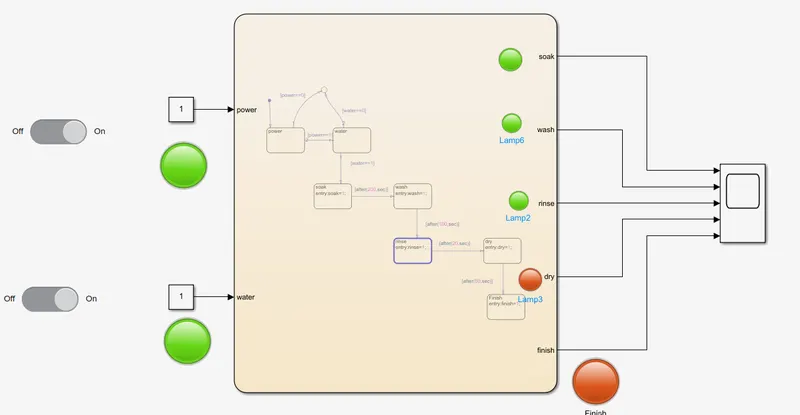
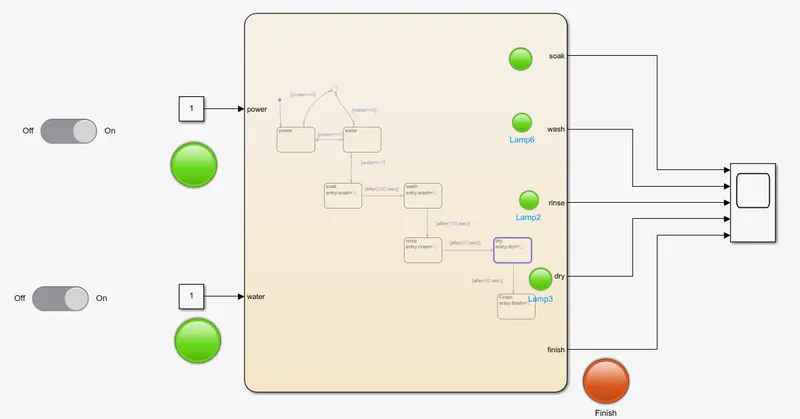
- On the simulink window we uses the lamp for indicating the process completed or not
- And we use switches for ON or OFF conditon
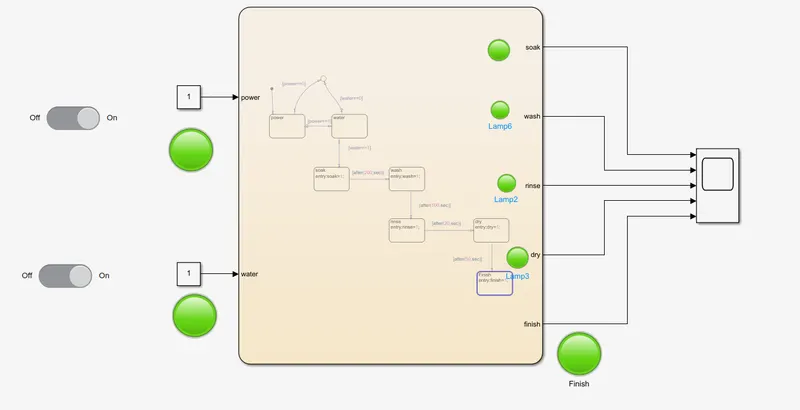
here is the model
The chart inside how the conditions assigned:
here we see the condition and assigning the values.
condition: [after(30,sec)] this condition says that rectangular block wait for 30 sec to proceed further.
Inside box:
variable name
entry: dry=1; here we assigning the value for dry variable where we can use as output data or input or something else.
By the above picture you can see the rght side where the signal pan, we can modify the variable in required data
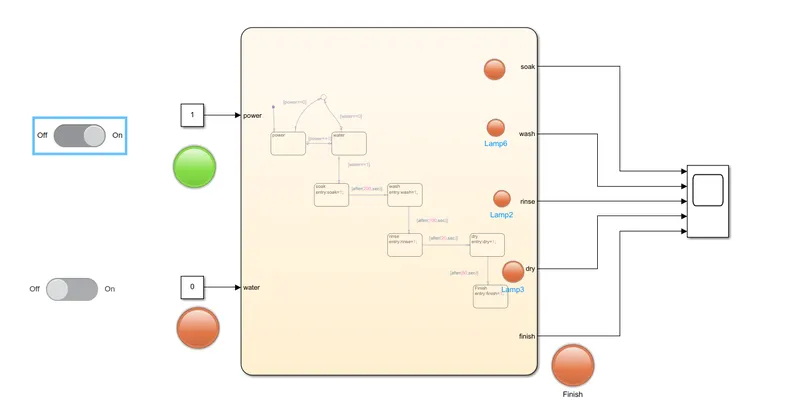
When power ON(1) and water not available(0):
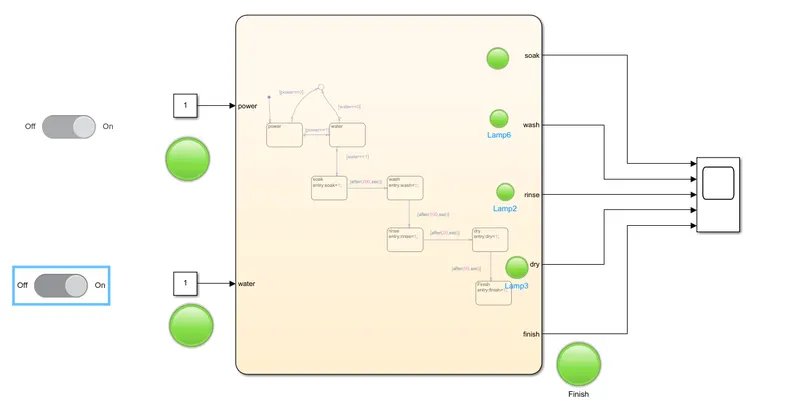
When both power and Water signals on:
Steps involved
Step1
Step2
Step3
Step4
Final step:
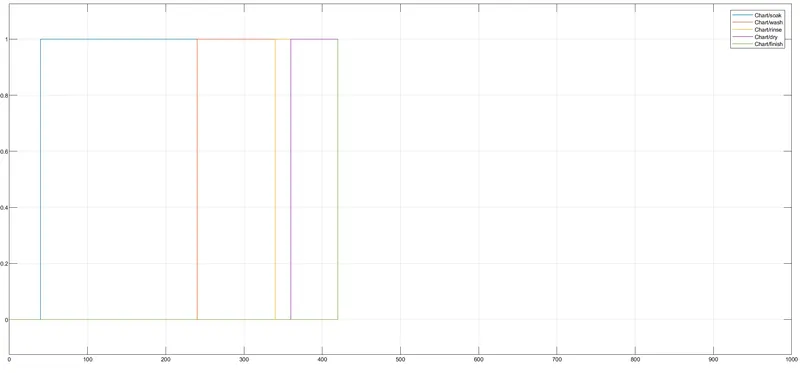
Slope shows graph
Objective:#2
Speed Range(kmph) Gear
0 to 15 1
16 to 25 2
26 to 40 3
41 to 60 4
Above 61 5
Description:
1. Create a chart block for defining the stateflow as per the given conditions.
2. Inside it, the circular junction is to terminate the signal flow and return a null value.
3. If ignition is OFF i.e. 0, the process is terminated at the junction else 1 is carry forwarded.
4. If speed is less than or equal to 0, the flow is terminated and gear 0 is activated at the junction else 1 is carry forwarded.
5. If speed is greater than 0 and less than or equal to 15, the flow is terminated and gear 1 is activated.
6. The same steps follows for speed given above with respective gears.
7.Define ignition and speed as inputs where as speedometer, scope and gear number display as outpus
8. Connect the chart block with constant blocks for ignition and speed inputs.
9. Input switches connected to them are rotary switch and a slider bar to adjust variable speeds repectively.
10. A common scope block is connected to observe the speed numerically and obtain the output plot.
A simulink model for operating the gear shift mechanism according to given conditions is shown below
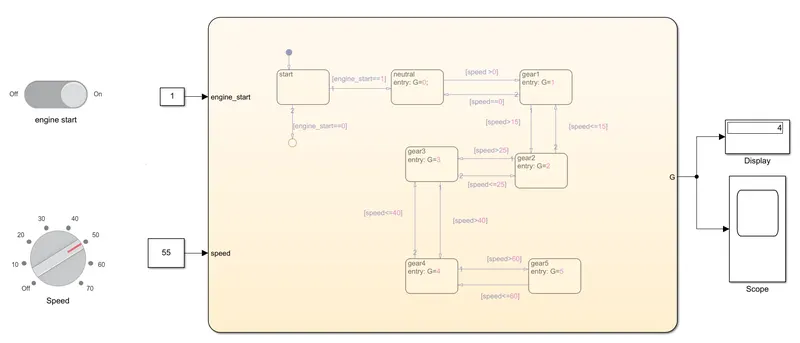
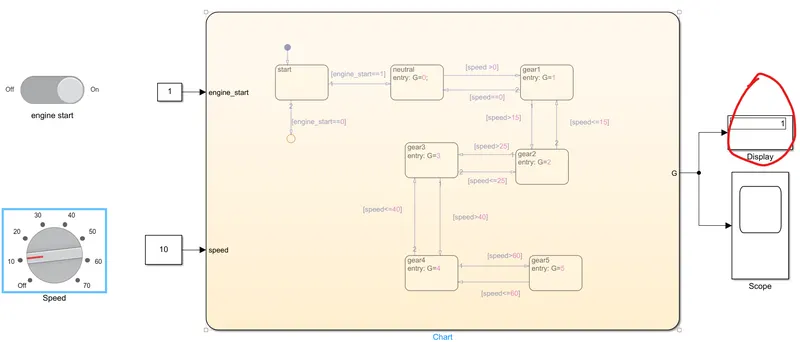
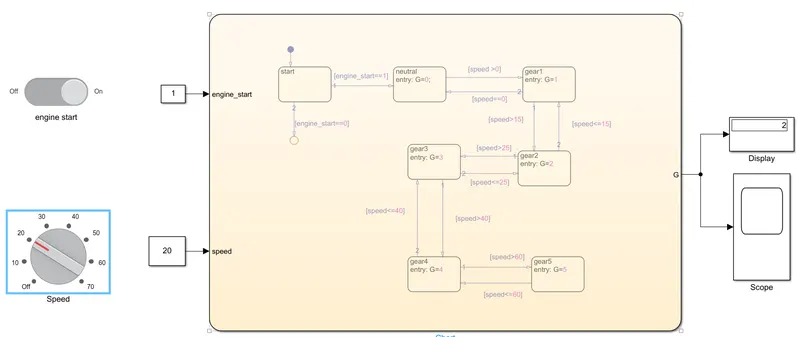
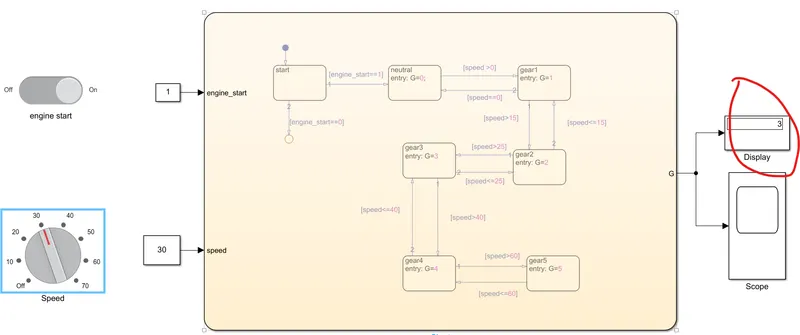
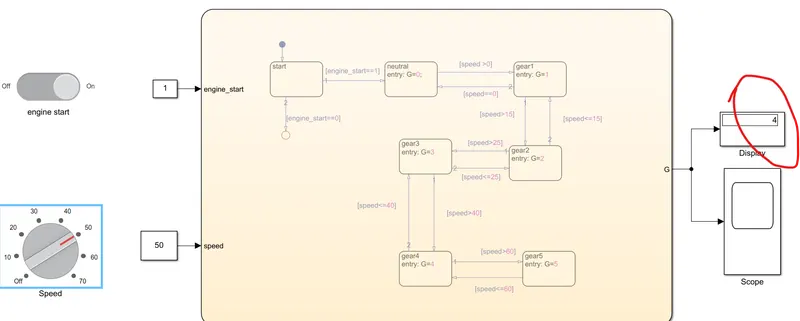
In the above figure shows the actual simulink model of Gear shift using stateflow as per the input condition. The input is taken as speed which varies manually and the gear shift is obtained as per the condition given below.
chart model:
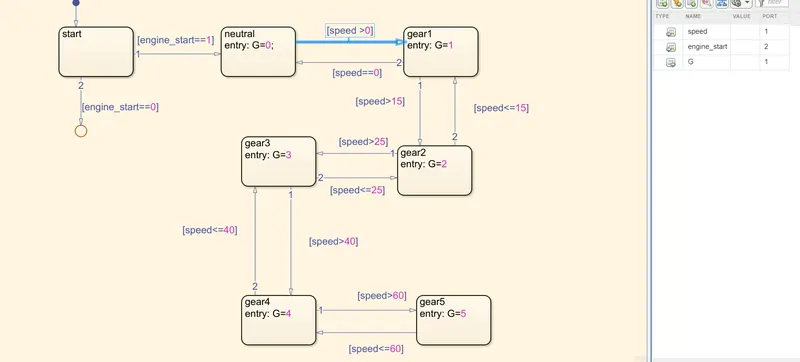
In gear shifting the conditon given for directive to other block or arrows in chart has different from last challenge
here we use the condition which is >(greater than),<(less than),=(equal to) to move from one spot to next
lets see for every gear for various speed:
speed for gear1:
speed for gear2:
speed for gear3:
speed for gear4:
speed for gear5:
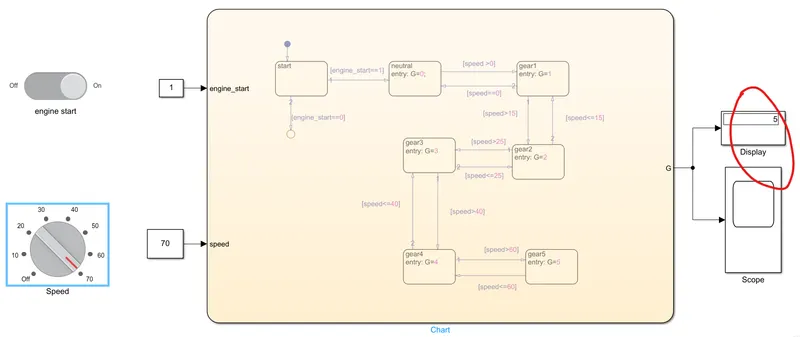
The final graph by scope how the gear shift according to speed:
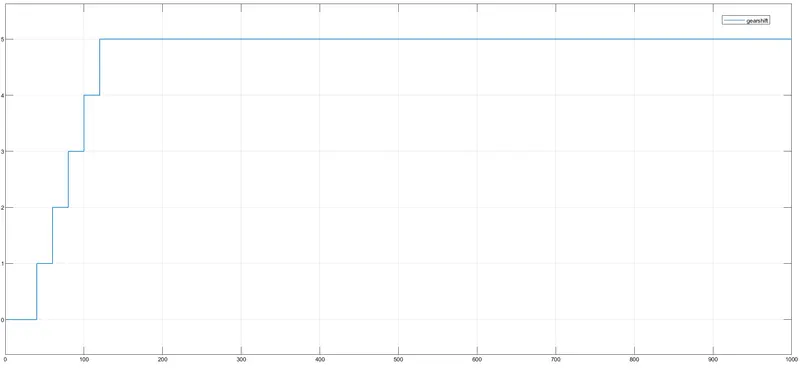
Here I have used 1000 values for stop time, so the graph shows the maximum space after 200 seconds
This is avoidable, but here it is one of my mistake that i have found to understand.
Result:
From above figure we obtain that the washing machine works according to the input supply of power and water else it won't work and indicated by lamp light green and red respectively.
Same for gear shifting we obtained that spedd varies the gear shift done by automatically as per the given condition and the change of gear indicated by lamp light as the speed varies from 0-70 kmph..
Errors I have faced:
Initially it was difficult to maintain the cursor option where to position for configure, moving option, edit the name, connections and other handling problem in chart window.
conditions and logic used in the chart was different from other kind of subtle.
I got mistake in assigning the proper stop time, if you see the above graph the mistake i have made.
Using some dashboard blocks like lamps and switches and feel different in connection with chart blocks