Week - 4
REPORT WEEK04
TASK1
AIM
Implement control logic of a “washing machine”.
OBJECTIVES
To Implement control logic of a “washing machine” using Stateflow as per given sequence:
1) If the power supply is available, the system gets activated.
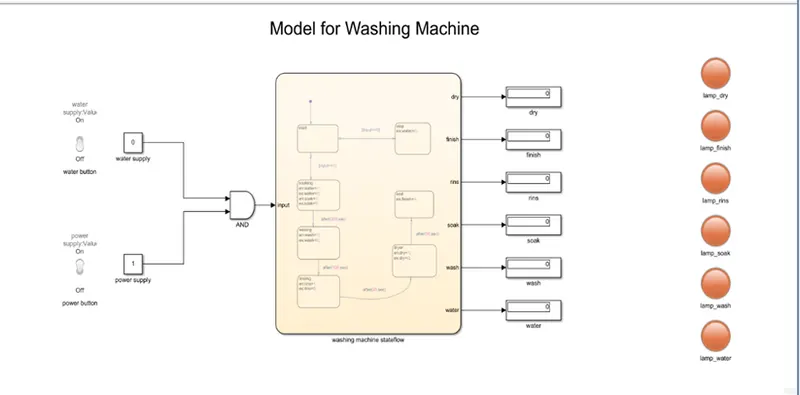
2) If the Water supply is not available, stop the process & indicate through LED.
3) Soaking time is 200s followed by Washing time of 100s.
4) Then rinsing happens for next 20s & dryer runs for 50s.
THEORY
Washing Machine:
1) Washing Machine is the household machine used for washing clothes.
2) It agitates your clothes in a soapy detergent and water to remove any dirt and stains before spinning to drain the water after the cycle. The main component of a washing machine is the drum, which fills up with water.
3) Below is the figure of general washing machine construction,
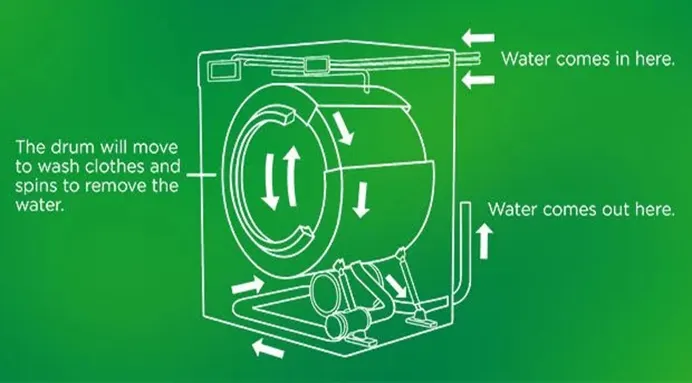
FIG: Washing Machine Construction
Stateflow:
1) Stateflow (is a tool in MATLAB) is a control logic tool used to model systems via state machines and flowcharts within a Simulink model. Stateflow uses a concept of the finite state machine.
2) Stateflow also provides state transition tables and truth tables.
BODY
Model:
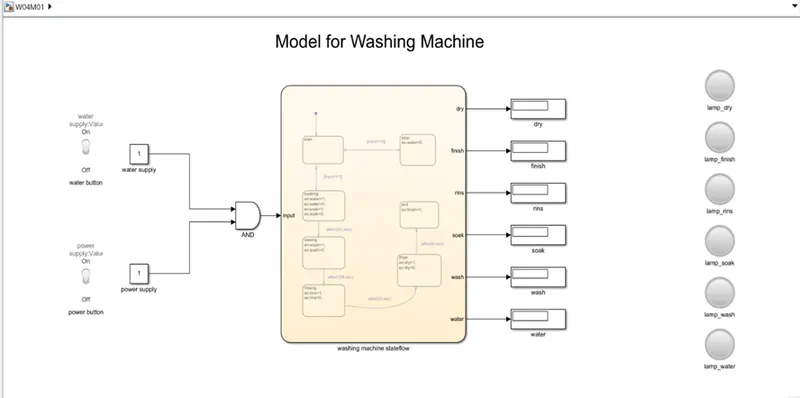
FIG: Model for Washing Machine
Stateflow Model:
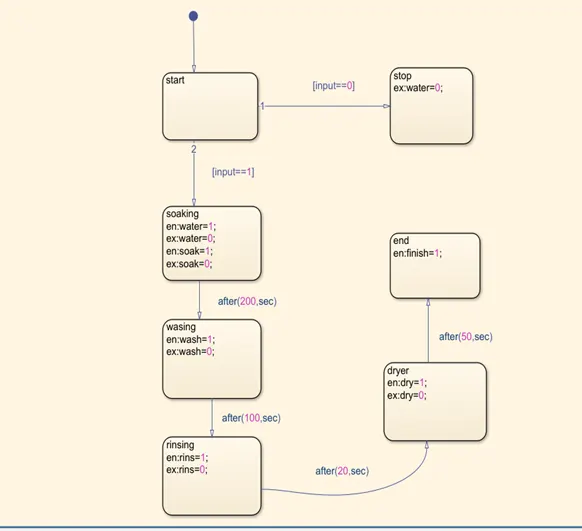
Blocks Used:
Toggle Switch, Constant, AND gate, Chart, Display and Lamp
Logic:
1) In Simulink model Toggle switches are used to represent water supply and power supply. Switches are connected to the Constants. Output of constants is given to the AND gate.
2)Output of AND gate(input) is connected to the Chart. Chart contains stateflow of given conditions.
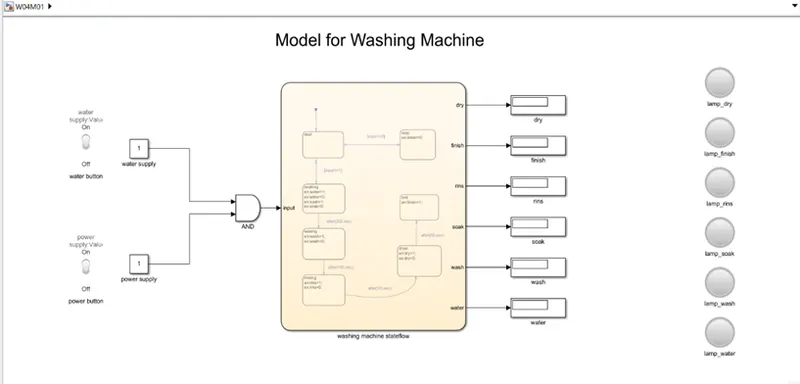
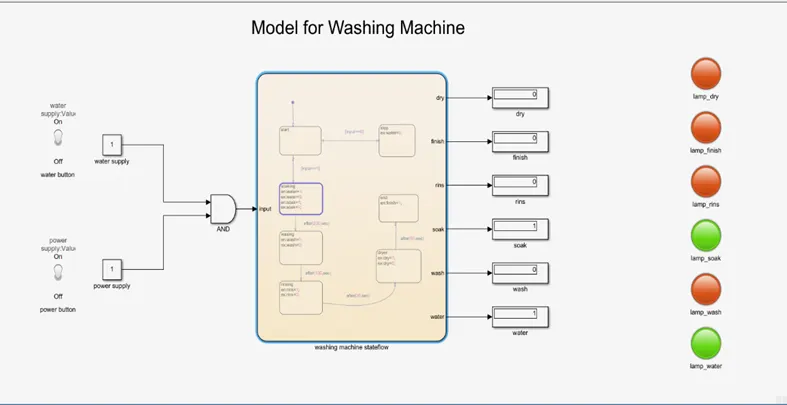
3) The 6 Outputs, of Chart block are given to 6 Displays and those displays are connected with Lamps. If particular state is executing in the Stateflow the display of same name will display=1 and simultaneously Lamp will change colour from Red to Green.
4) Inside Chart we used blocks to represent states. The states are,
Start: Process ready to run
Stop: Stop when water is unavailable
Soaking: soak for 200s
Washing: wash for 100s
Rinsing: rinse for 20s
Drying: dry for 50s
End: Finish process after drying.
5) In the block ‘en’ gives output when state starts, ‘ex’ gives output value when state is finished, ‘after()’ is keyword means start next process after time given in brackets.
6) Keywords used inside block are: ‘en’ for entry, ‘ex’ for exit, ‘after’ for delay.
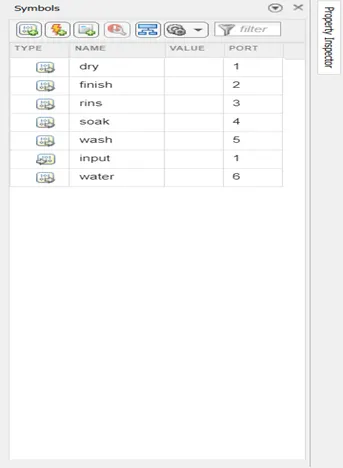
7) Input and Output parameters of Chart block are represented below,
OUTPUT
1) Output before start:
2) Output when started Soaking State:
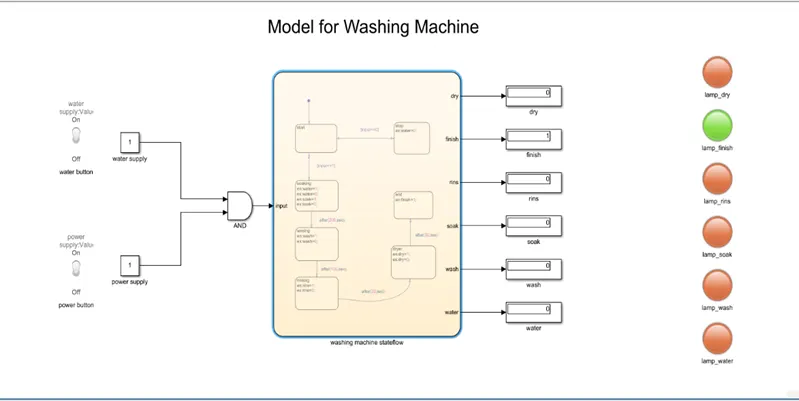
3) Output when process is finished:
4) Output when water supply is unavailable:
OBSERVATIONS
1) When state is running display=1 and Lamp for that state will be green.
2) When finished finish Lamp will be green.
3) When water supply is unavailable process stops.
CONCLUSION
We built model for washing machine with given conditions and observed output.
TASK2
AIM
Make a Simulink chart for the “Gear shift”.
OBJECTIVES
1) To Make a Simulink chart for the “Gear shift” logic as per below conditions:
|
Speed Range(kmph) Gear 0 to 15 1 16 to 25 2 26 to 40 3 41 to 60 4 Above 61 5 |
2) Give speed input while the simulation is running & display the gear number.
THEORY
Gear Shifting:
1) Gear shifting in a vehicle is mainly done as response to the external conditions. Example: If, there is traffic at some distance then speed is reduced by appling brakes. Then gear also shifted to lower number to efficiently run vehicle at lower speed.
2) Gear shifting is done by Gear Lever.
3) there is defined range for each gear.
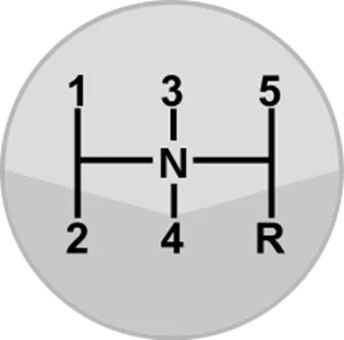
FIG: Gear Lever
BODY
Model:
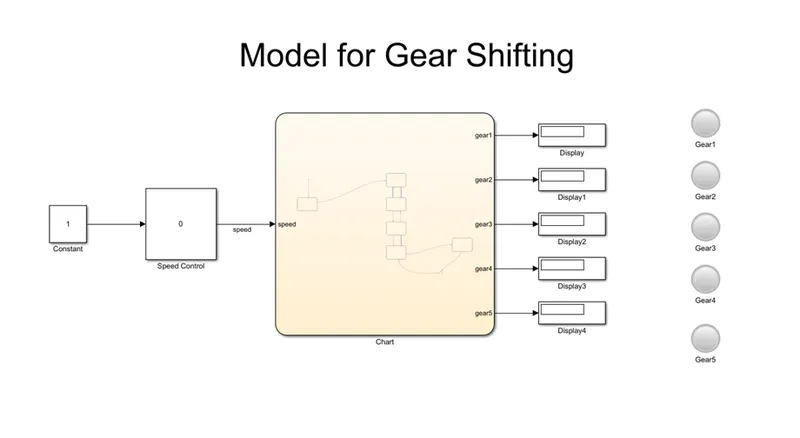
FIG: Model for Gear Shifting
Blocks Used:
Constant, Slider Gain, Chart, Display, Lamp.
Logic:
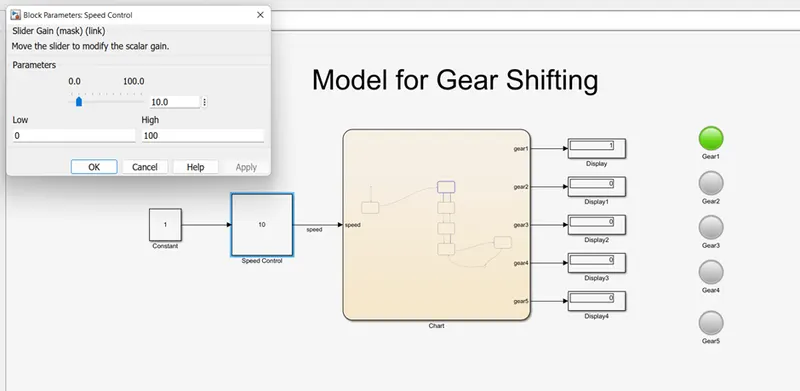
1) To change the speed, we are using slider gain and modifying its parameters. Constant is given as input to the slider gain. Slider Gain parameters are given below,
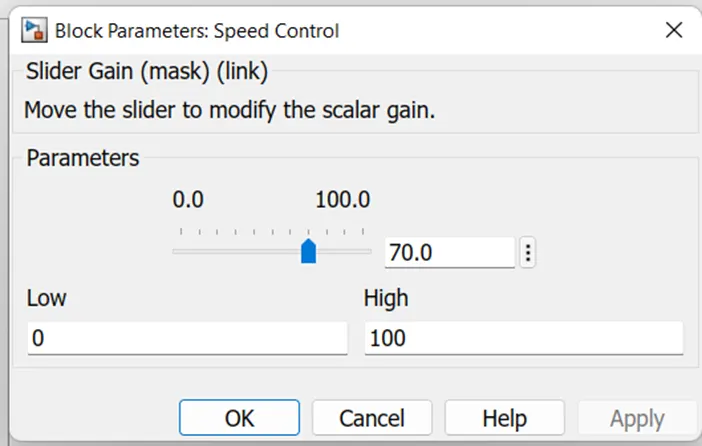
2) Output of Slider Gain (named ‘speed’) is given as input to the Chart block.
3) Output of Chart is given to 5 Displays for 5 gears and these displays are connected to the Lamps. Logic is that when we change the speed the gear number corresponding to current speed will be displayed on Display and Lamp with gear number becomes green otherwise it is Red.
4) Inside Chart we can see that, we used different blocks for different Gears and conditions are provided as per our objectives.
5) Parameters of Simulation Run time are modified. Represented below,
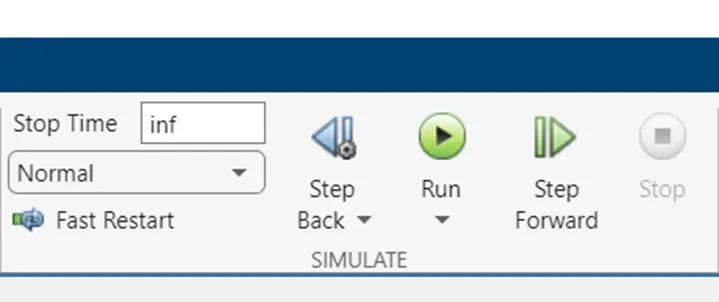
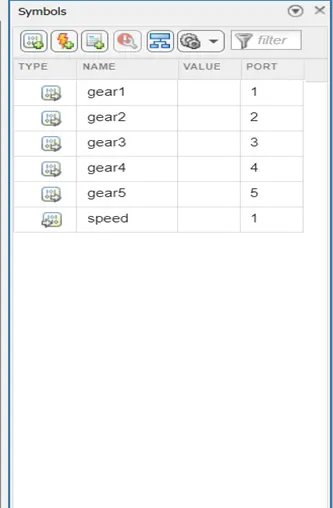
6) Input and Output parameters are represented below,
Stateflow Model:
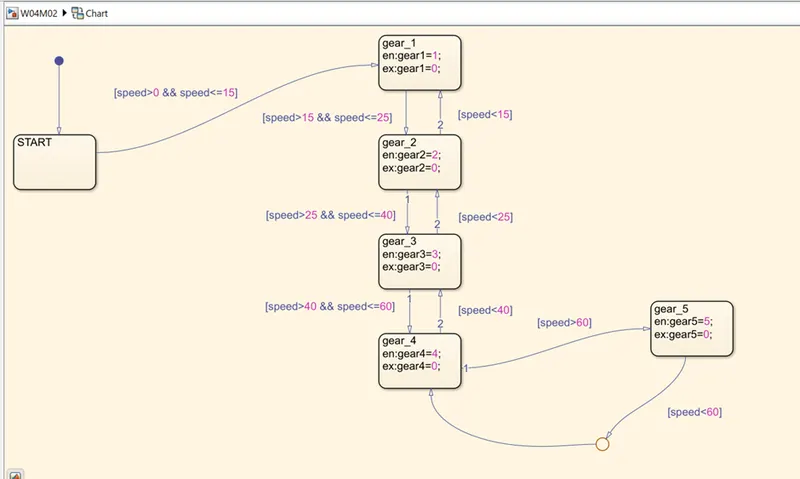
FIG: Stateflow Model
OUTPUT
1) Output Gear1:
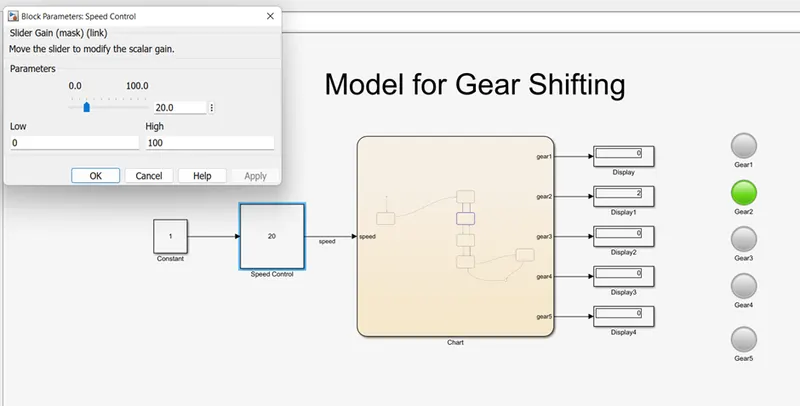
2) Output Gear2:
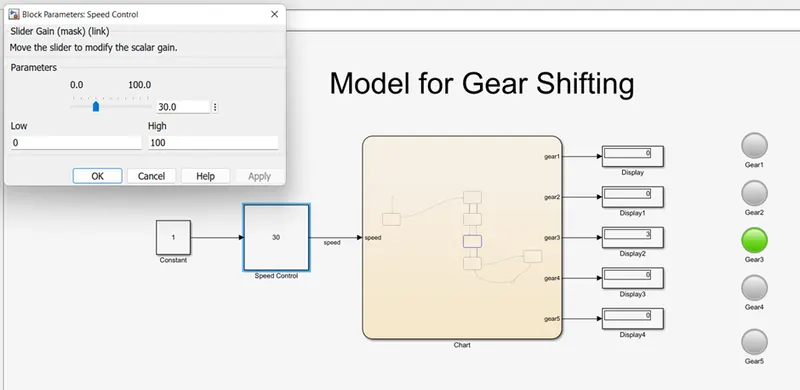
3) Output Gear3:
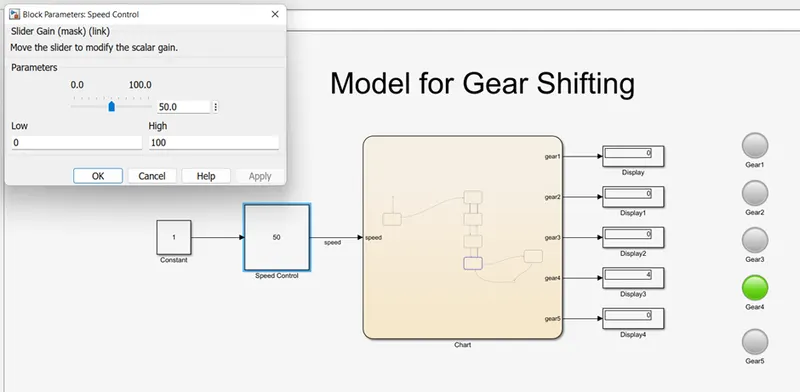
4) Output Gear4:
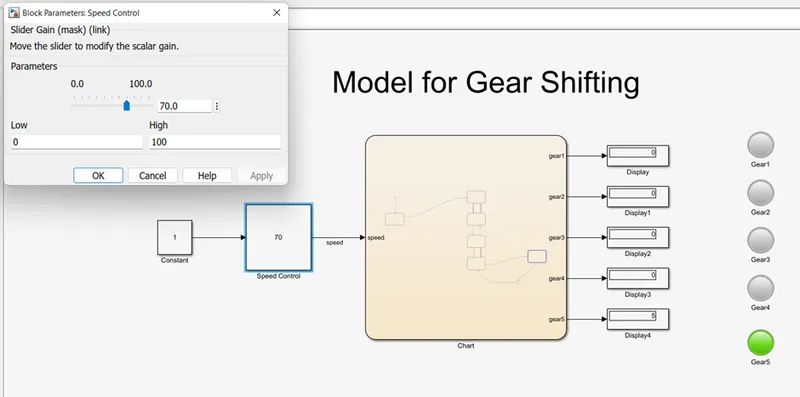
5) Output Gear5:
OBSERVATION
1) When we change speed by Slider gain, we can observe gear shift as per required conditions.
2) Display and Lamp will indicate Gear number.
CONCLUSION
We built Gear Shifting Model as per given conditions and observed Output.