Project - Data Handling and Interpolation
REPORT FINALM02
AIM
In a laboratory experiment, data of voltage and current has been recorded and the same is attached in an excel file ( VI.xlsx ). Read the excel file in the Matlab program and perform the interpolation in the range of -17.3:0.1:0.9.
Generate the interactive plot for the interpolated data. Additionally, compute the current values for given voltages below and store them in a text file.
VV = [-17.2 -17.1 -13.8 -13.5 -13.0 -12.5 -11 -9 -5.76 -6 -1 0.11 0.25 0.5 0.61]’
THEORY
1) First, we opened the given file and used xlsread command to read data from excel file.
We read values of v and i.
2) Used other variable vq= -17.3:0.1:0.9 to define range and interval. We then plotted original data and interpolated data in a plot. We used interp1 command to interpolate.
3) We have to plot I values for given V in excel file. So, we again used interp1 command to find corresponding I values of given V values.
4) We finally write these new current values in txt file named i_new_out.txt.
PROGRAM
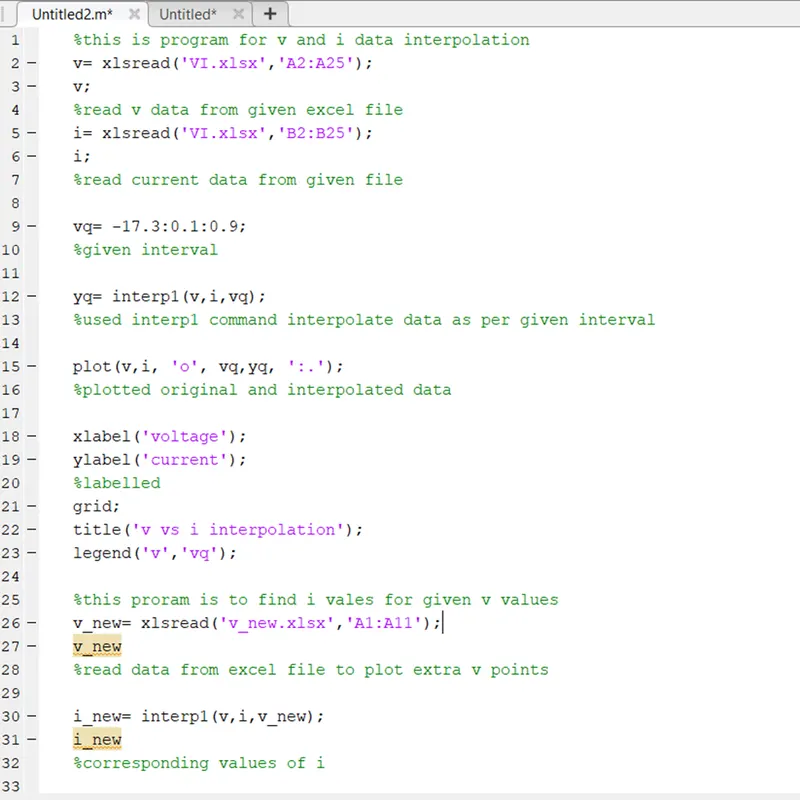
This program is to read data from excel file then interpolated data the found corresponding values of I of given v.
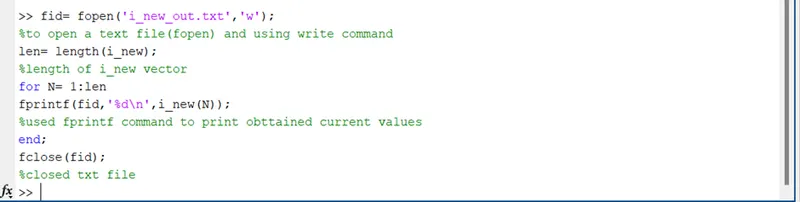
This program is to write I values in txt file
OUTPUT
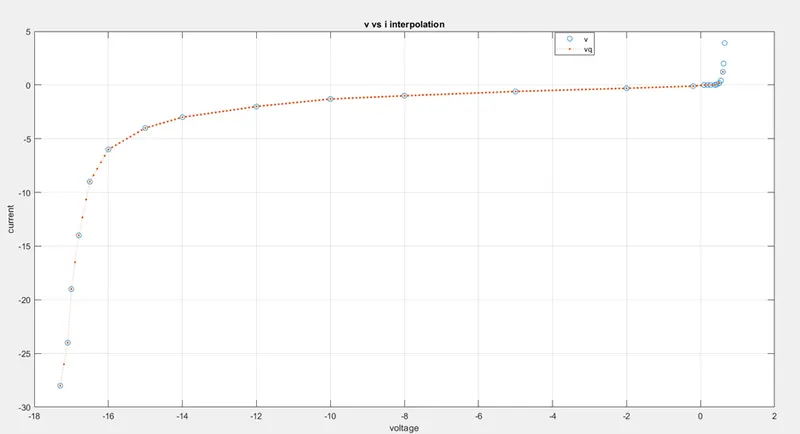
Plot of v and vq.
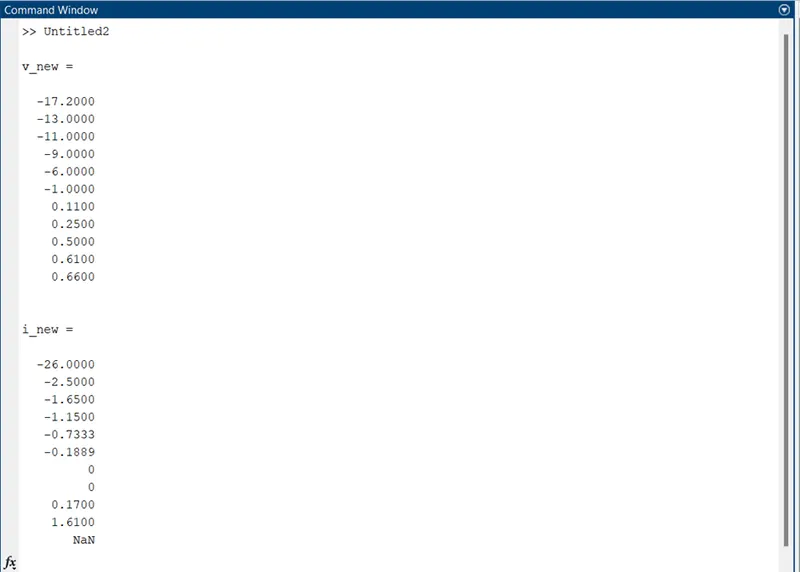
Found corresponding values of i.
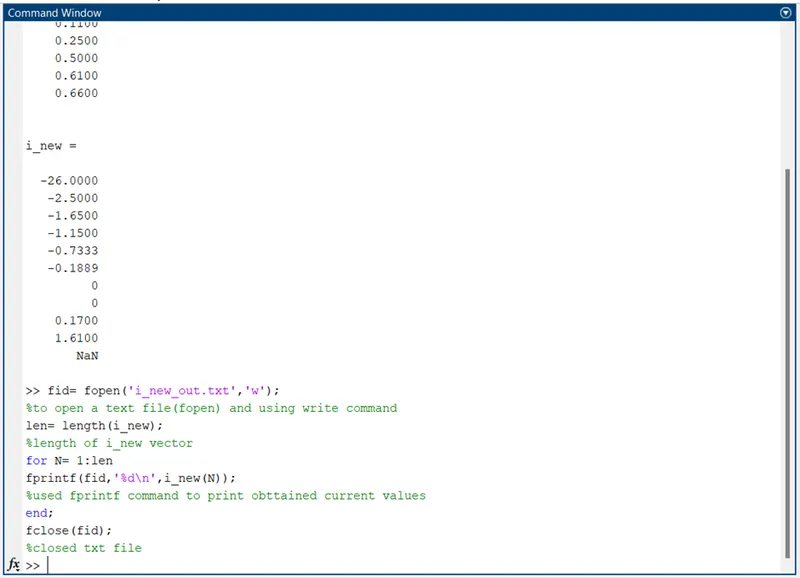
Program in command window to write txt file.
CONCLUSION
Studied given question and observed output.