Week - 4
AIM: 1. Implement control logic of a “washing machine” using Stateflow as per given sequence.
2. Make a Simulink chart for the “Gear shift” logic as per conditions provided in question.
State Flow:Stateflow provides a graphical language that includes state transition diagrams, flow charts, state transition tables, and truth tables. You can use Stateflow to describe how MATLAB algorithms and Simulink models react to input signals, events, and time-based conditions.
- Implement control logic of a “washing machine” using Stateflow as per given sequence.
CONDITIONS:
- If the power supply is available, the system gets activated
- If the Water supply is not available, stop the process & indicate through LED
- Soaking time should be 200s followed by Washing time of 100s.
- Then rinsing happens for next 20s & dryer runs for 50s
BLOCKS USED:
- Chart
- Lamp
- Slider switch
- Display
- Constant
Chart: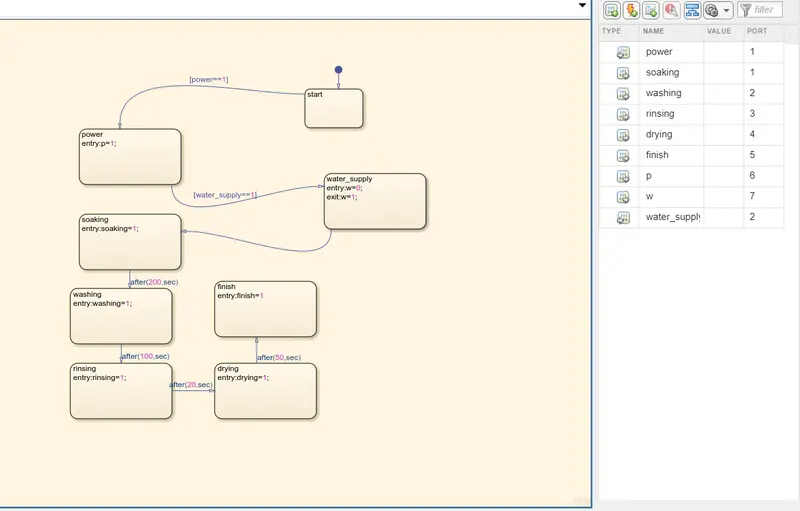
fig.1
Code Explaination:
- Here we use state flow chart and we have given 2 input as constanty block one is for power supply,another is for water supply.
- Inside the chart we have use states and as per the condition first we give start start where by default transiton is power supply and then connected to the power state by giving the condition power==1 to check the power input and after the power supply we add a water supply state and give the condition water supply==1.
- after water supply soaking after 200sec,washing,after 100sec,rinsing,after 20sec,drying,after 50sec,complete.
- and the all output (soaking,washing,rinsing,drying,finish,p,w) is connected with the display as well as lamp and the input side we connected a slider switch and lamp is connected.
1st Condition: If the power supply is available, the system gets activated
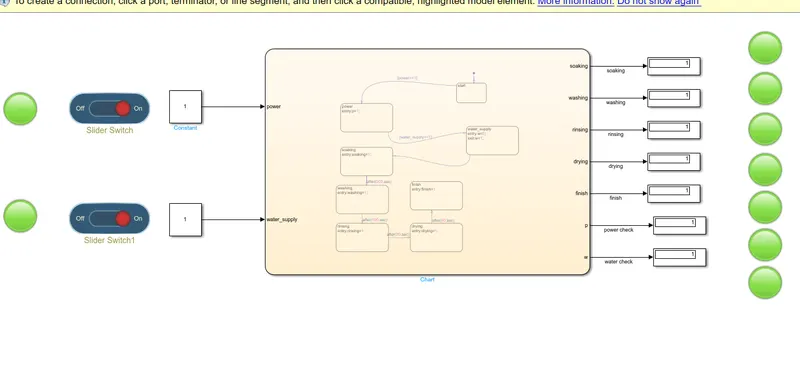
- Here the power supply is on so every thing is showing green.
2nd Condition: If the Water supply is not available, stop the process & indicate through LED
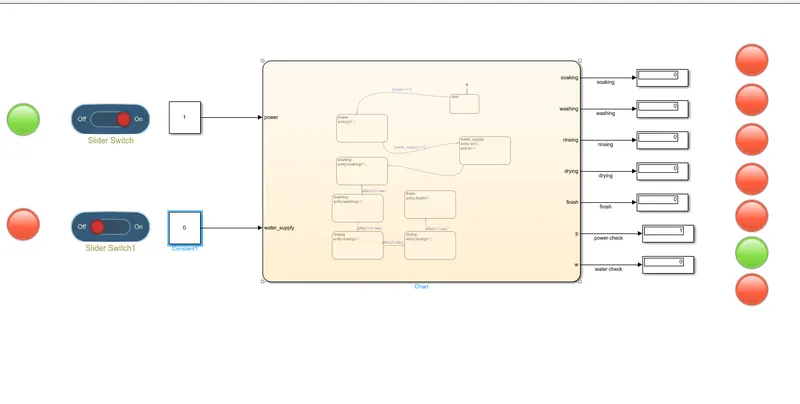
- Here the water supply is off and power is on, so only power is showing green others are showing red.
- For the rest condition the fig(1) is satisfied.
- after all process the finish will on the led light.
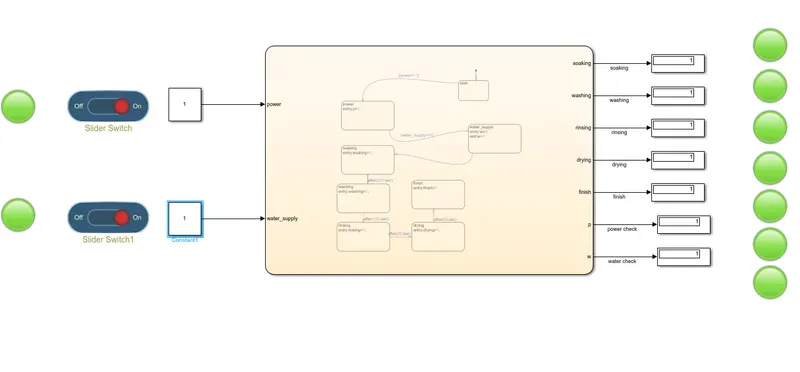
- here finish led is showing green.
2.Make a Simulink chart for the “Gear shift” logic as per below conditions:
CONDITIONS:
Speed Range(kmph) Gear
0 to 15 1
16 to 25 2
26 to 40 3
41 to 60 4
Above 61 5
- Give speed input while the simulation is running & display the gear number.
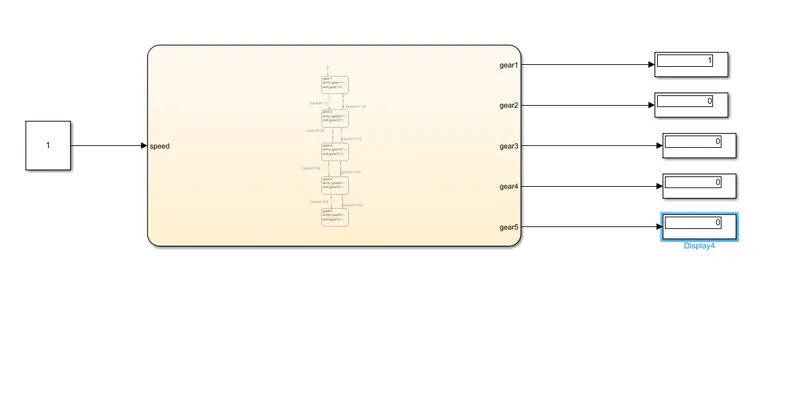
MODEL:
Inside Chart:
BLOCK USED:
- Constant block
- Chart
- Display
EXPLAINATION:
- Here we used a chart and one constant block is there as input.
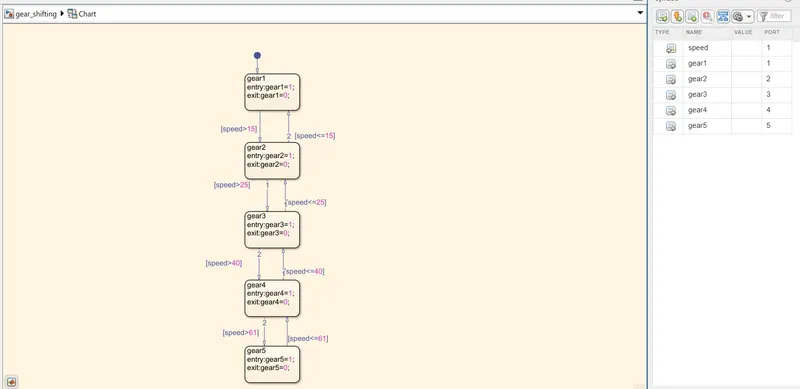
- Inside the chart we have taken state with default transition.
- And given the condition for next state as speed is greater than 15 move to gear 2 andagain it backs to first gear if it is less than equal to 15.
- Now for the 3nd gear same condition is given like speed>25, and went back to 2nd gear if speed <=25.
- now for the fourth gear speed>40 angain went bake to 3 speed <=40.
- At the end for the 5th gear speed >61 and went bake to 4th gear is speed<=61.
- finally all the gear output is connected with the display.
1st condition: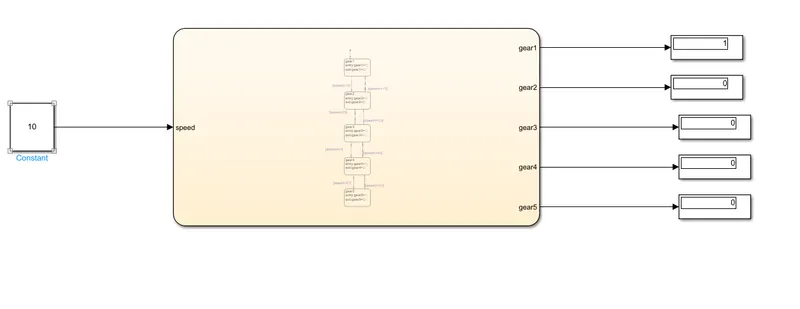
Here we provide speed as 10 and gear1 displaying 1.Hence,satisfied.
2nd condition:
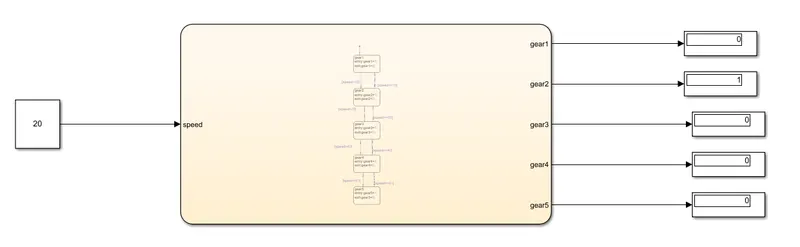
Here we provide speed as 20 and gear2 displaying 1.Hence,satisfied.
3rd Condition:
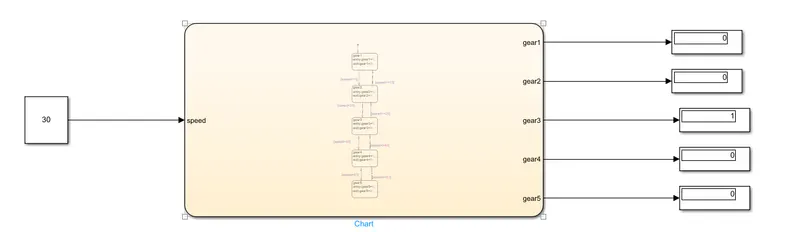
Here we provide speed as 30 and gear3 displaying 1.Hence,satisfied.
4th Condition:
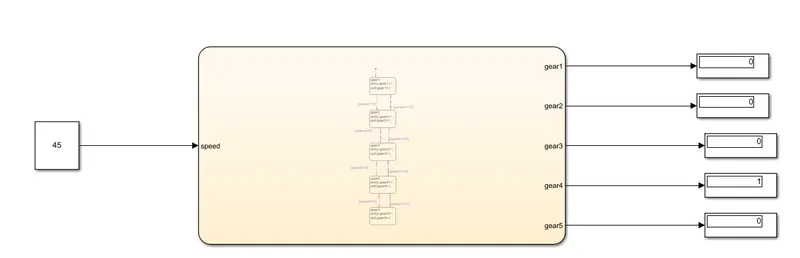
Here we provide speed as 45 and gear4 displaying 1.Hence,satisfied.
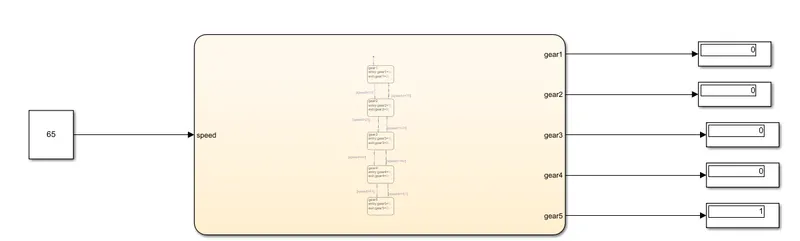
Here we provide speed as 65 and gear5 displaying 1.Hence,satisfied.