Project 1 - Parsing NASA thermodynamic data
AIM:
- Write a function that extracts the 14 co-efficients and calculates the enthalpy, entropy and specific heats for all the species in the data file. You will be reading this file NASA thermodynamic data
-
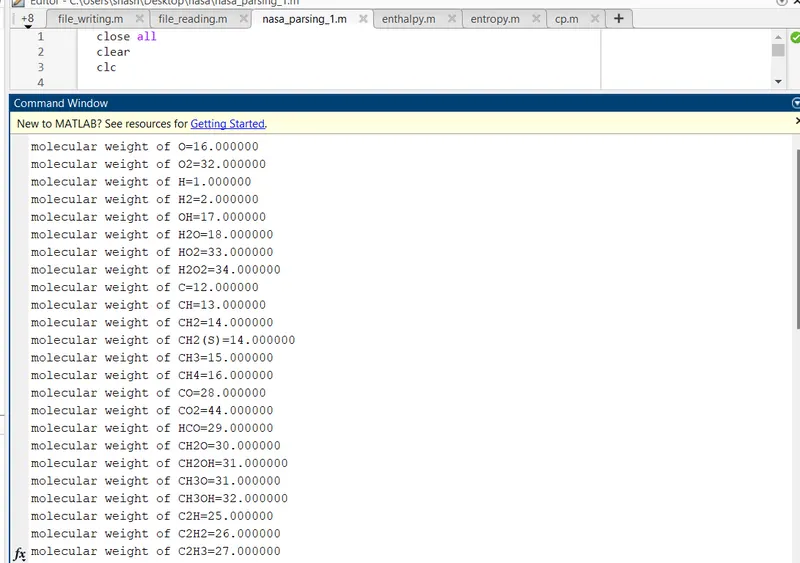
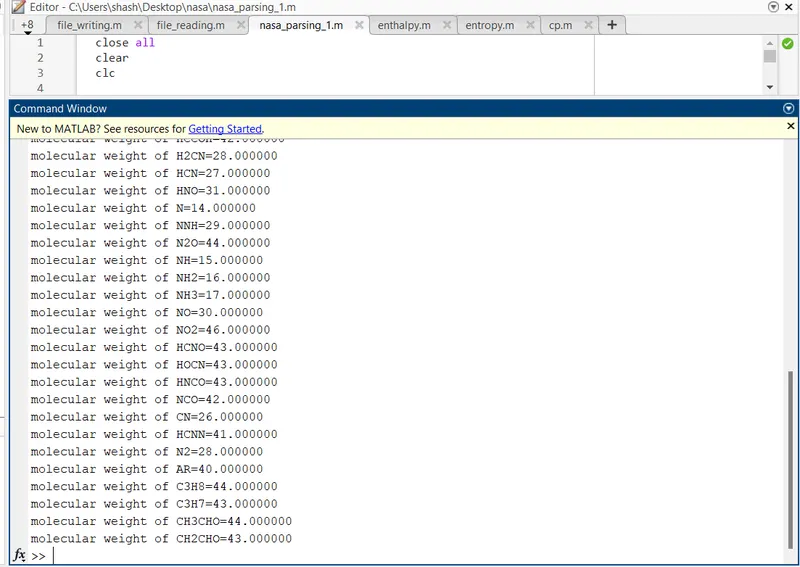
Calculate the molecular weight of each species and display it in the command window.
-
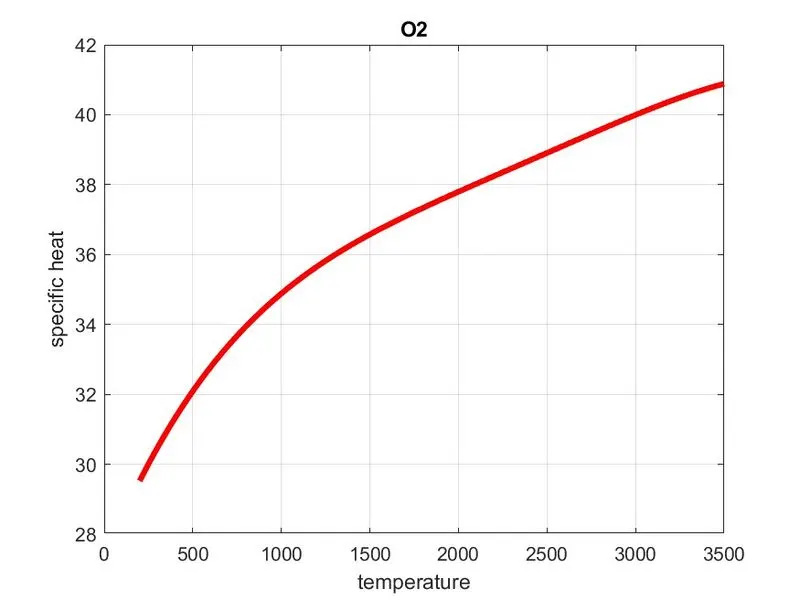
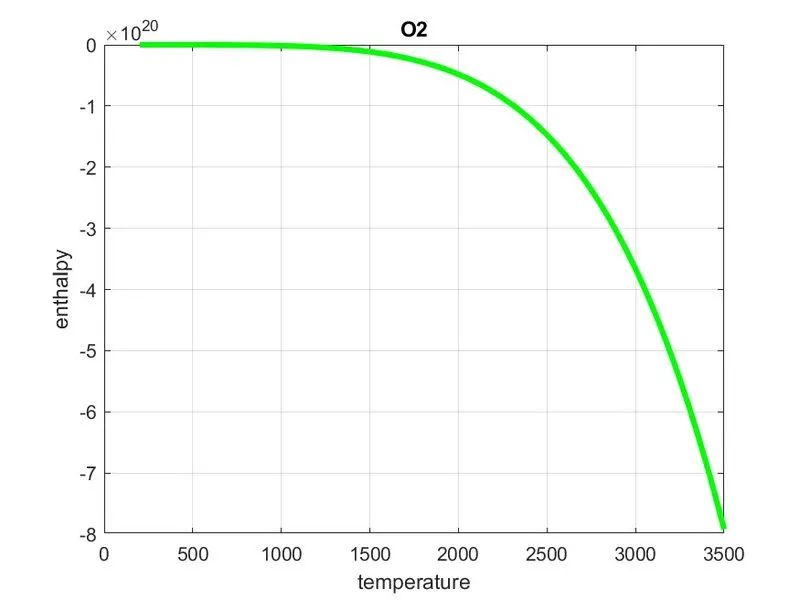
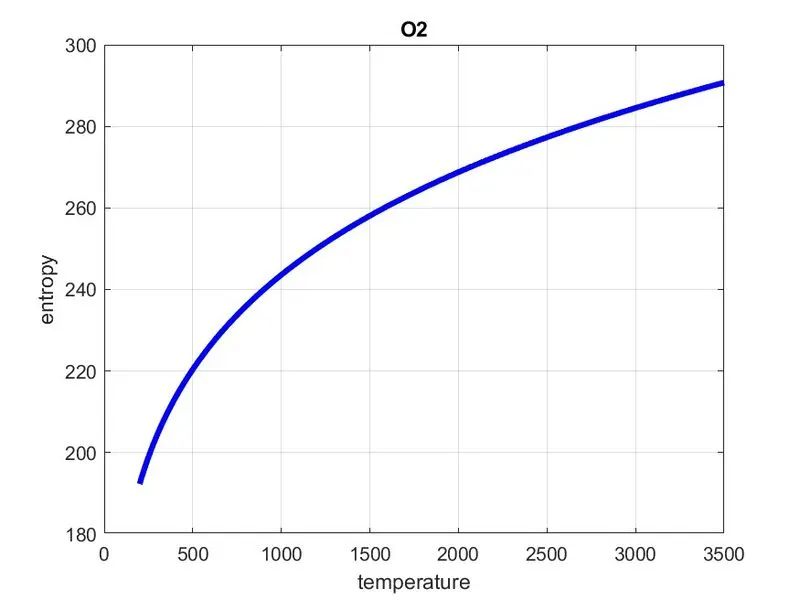
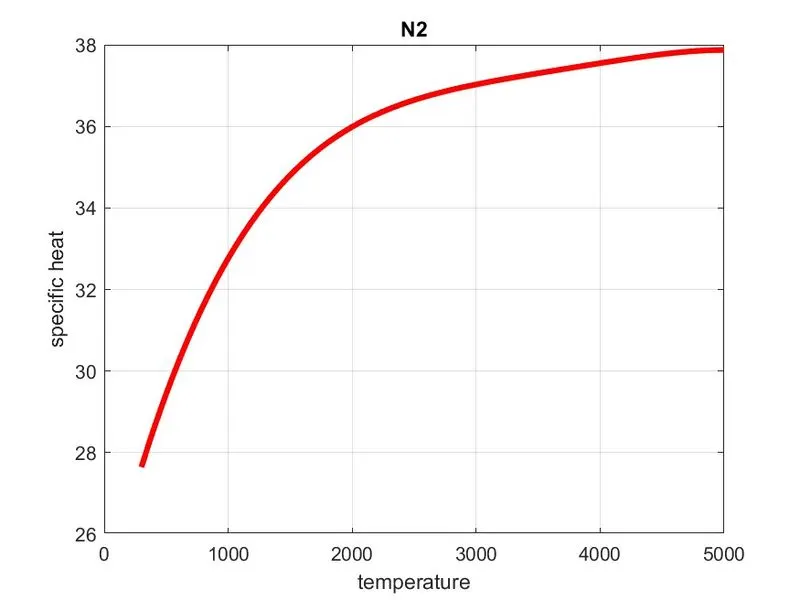
Plot the Cp, Enthalpy and Entropy for the local temperature range (low temperature : high temperature) specific for each species.
THEORY:
FILE PARSING:
- Parsing a file means reading in a data stream and building a memory model of the content of that data. This aims at facilitating perfoming some kind of transformation on the data. Parsing splits a file or other input into pieces of data that can be easily stored or manipulated.
- Basically we are here to extract the data from the NASA thermodynamic data which is given by you and calculate the enthalpy,entropy and specific heat for each species and plot the the graph with respect to local temperature range.
- To claculate the specific heat ,enthalpy and enthalpy by the formula provided in the question section

- Here temperature will varry for each species and we have to use formula accordingly,the FIRST 7 coefficients are HIGH-temperature coefficients and the SECOND 7 coefficients are LOW-temperature coefficients.
- And then we have to calculate molecular weight for each species by using (molecular weight=atomic weight* no. of atoms)
FUNCTIONAL PROGRAM:
- PROGRAM FOR SPECIFIC HEAT
function [specific_heat]=cp(a1,a2,a3,a4,a5,a8,a9,a10,a11,a12,T,R,local_mid_temp)

if T<= local_mid_temp
    specific_heat = (a8+a9*T+a10+T.^2+a11*T.^3+a12*T.^4)*R;
else
    specific_heat = (a1+a2*T+a3*T.^2+a4*T.^3+a5*T.^4)*R;

end
end
CODE EXPLAINATION:
- Here we use Cp as function and provide all the input as the formula and here we use se if else condition loop fo that to identifie the high temperature and low temperature range and as per the condition we give the formula and close all the loop.
- PROGRAM FOR ENTHALPY:
function [H]=enthalpy(a1,a2,a3,a4,a5,a6,a8,a9,a10,a11,a12,a13,T,R,local_mid_temp)
if T<= local_mid_temp
    H=(a8+(a9*T)/2+(a10*T.^2)/3+(a11*T.^3)/4+(a12*T.^4)/5+(a13*T.^5)/6)*R;
else
    H=(a1+(a2*T)/2+(a3*T.^2)/3+(a4*T.^3)/4+(a5*T.^4)/5+(a6*T.^5)/6)*R;
end
end
CODE EXPLAINATION:
- Here we use ENTHALPY as function and provide all the input as the formula and here we use se if else condition loop fo that to identifie the high temperature and low temperature range and as per the condition we give the formula and close all the loop.
- PROGRAM FOR ENTROPY:
function [s]=entropy(a1,a2,a3,a4,a5,a7,a8,a9,a10,a11,a12,a14,T,R,local_mid_temp)

if T<= local_mid_temp
    s=(a8*log(T)+a9*T+(a10*T.^2)/2+(a11*T.^3)/3+(a12*T.^4)/4+a14)*R;
else
    s=(a1*log(T)+a2*T+(a3*T.^2)/2+(a4*T.^3)/3+(a5*T.^4)/4+a7)*R;
end
end
CODE EXPLAINATION:
- Here we use ENTROPY as function and provide all the input as the formula and here we use se if else condition loop fo that to identifie the high temperature and low temperature range and as per the condition we give the formula and close all the loop.
MAIN PROGRAM:
close all
clear
clc

% opening and reading data file
f1 = fopen('THERMO.dat','r');

l1=fgetl(f1);

% Skiping the global temperature and header
for i = 1:4
    comment=fgetl(f1);
end

%creating new folder
mkdir ('newnasa')
for k=1:53
% Extracting the species
species=fgetl(f1);
% Local temperature
species_name=strtok(species);

[name,temp]=strtok(species,'G');
R=strsplit(temp,' ');
local_low_temp=str2double(R(2));
local_high_temp=str2double(R(3));
local_mid_temp=str2double(R(4));

% defining the temperature range from local temp limit
T=linspace(local_low_temp,local_high_temp,1000);

line_1=fgetl(f1);
A=strfind(line_1,'E');
a1=str2double(line_1(1:(A(1)+3)));
a2=str2double(line_1((A(1)+4):(A(2)+3)));
a3=str2double(line_1((A(2)+4):(A(3)+3)));
a4=str2double(line_1((A(3)+4):(A(4)+3)));
a5=str2double(line_1((A(4)+4):(A(5)+3)));

line_2=fgetl(f1);
B=strfind(line_2,'E');
a6=str2double(line_2(1:(B(1)+3)));
a7=str2double(line_2((B(1)+4):(B(2)+3)));
a8=str2double(line_2((B(2)+4):(B(3)+3)));
a9=str2double(line_2((B(3)+4):(B(4)+3)));
a10=str2double(line_2((B(4)+4):(B(5)+3)));

line_3=fgetl(f1);
C=strfind(line_3,'E');
a11=str2double(line_3(1:(C(1)+3)));
a12=str2double(line_3((C(1)+4):(C(2)+3)));
a13=str2double(line_3((C(2)+4):(C(3)+3)));
a14=str2double(line_3((C(3)+4):(C(4)+3)));

% Defining the universal gas constant value R in (J/k.mol)
R=8.3145;

% calculating specific heat
specific_heat=cp(a1,a2,a3,a4,a5,a8,a9,a10,a11,a12,T,R,local_mid_temp);
% calculating enthalpy
H=enthalpy(a1,a2,a3,a4,a5,a6,a8,a9,a10,a11,a12,a13,T,R,local_mid_temp);
% calculating entropy
s=entropy(a1,a2,a3,a4,a5,a7,a8,a9,a10,a11,a12,a14,T,R,local_mid_temp);


%calculation of molecular weight
elements = ['C','H','O','N','A'];
atomic_weight=[12 1 16 14 40];

mol=0;
for i=1:length(species_name)
for j = 1:length(elements)

  if strcmpi(elements(j),species_name(i))
      mol=mol+atomic_weight(j);
      pls=j;
  end
end
n=str2double(species_name(i));
if n>1
    mol=mol+atomic_weight(pls)*(n-1);
end
end

 % Creating new folder

  cd ('newnasa')
  mkdir(species_name)
  cd(species_name)

%plotting for temperature vs specific heat
figure(1)
plot(T,specific_heat,'Color','r',LineWidth=3)
grid on
title(species_name)
xlabel('temperature')
ylabel('specific heat')
saveas(gcf,'fig.jpg')


%plotting for temperature vs enthalpy
figure(2)
plot(T,H,'Color','g',LineWidth=3)
grid on
title(species_name)
xlabel('temperature')
ylabel('enthalpy')
saveas(gcf,'fig1.jpg');


%plotting for temperature vs entropy
figure(3)
plot(T,s,'Color','b',LineWidth=3)
grid on
title(species_name)
xlabel('temperature')
ylabel('entropy')
saveas(gcf,'fig2.jpg');

%saving the plot
cd('C:\Users\shash\Desktop\nasa');

fprintf('molecular weight of %s=%f\n',species_name,mol)
end
CODE EXPLAINATION:
- Start the program with close all,clear,clc,
- And then open and read the thermodynamic data provide in the question by using 'fopen' command.
- Then use 'fgetl' command to read line by line from data.
- So we skipping tha data that we don't need here for the question by creating for loop.
- Again we have to extract the local temperature data and also species name for each species so we here create a for loop for all 53 species.
- And extract the line by 'fgetl' command and aging we se 'strtok' command to extract SPECIES NAME from each line.
- And for the local temprature which is present in the same line we use 'strtok' command for rest of the part
- And then we create a temprature range for better result with high and low temprature using 'linspace' command.
- Now we extract the all data after the species name for calculation of Cp,H & S .
- So for extractng the data from the line we use firstly 'strfind' command to fine the position of 'E' and then by using 'str2double' command for converting the number to string also by using the positon fo 'E' we extract every data independently.
- And this will continue for all the line untill the second species line will come.
- And now from the function created above for Specific heat,Entropy,Enthalpy we call all the function for calculating that.
- And now we are going to calculate the molecular weight of each species so first we count the no of elements used in the whole data and we found it '5' so firstly we created it in a array and also create an array for the atomic weight of that elements at the same position.
- Now we created a 'for loop' for the species name so that it goes from first to last word of species name.
- And inside that for loop again i created one more 'for loop' for the element array to compare with the species name.
- So now for comparing we use 'strcmpi' command to compare of each words of the Species name with the element array.
- And also before creating the loop we taken a variable called mol and assigning its value 0.
- Now after comparing we give mol=mol(which is previous one)+atomic weight(which is at the same place where the element present).
- Now we give a varible 'pls' to hold the position of last atomic weight of element.
- Now after the first for loop we creat a variable 'n' for the no present in the species name and using 'str2double' command converted that string to number.
- And now again i given a if statment after the first loop ended n>1 then mol=mol+atomic weight*pls(where the last position holded)*(n-1) because once we have added it so we are subtracting it.
- Now end that if statment and end the loop also.
- now plot the temperature and specific heat, temperature and entropy, temperature and enthalpy also provide grid on, title,xlabel,ylabel.
- So before the first for loop i created a new directry using 'mkdir', and inside loop we use'cd' command to move into that folder where all plot saved as figure and after plotting we save the plot by using 'saveas' commamnd and then returen to the previous folder 'cd' where matlab code is saved.
- And we lastly use 'fprintf' command to print the molecular weight in the command window.
- Finally end the loop.
RESULTS:
RESULTS OF MAIN CODE:
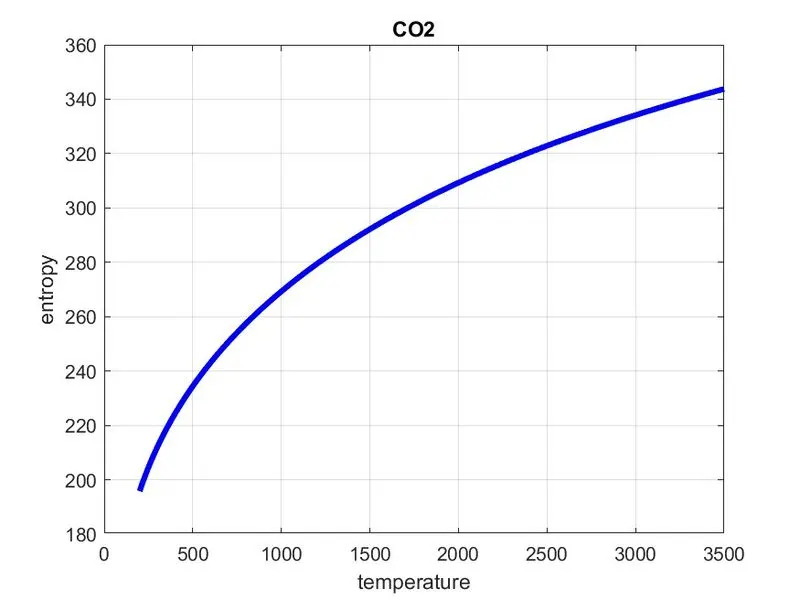
- As per the question we have to show the plot of O2,N2,CO2.
- O2
- N2
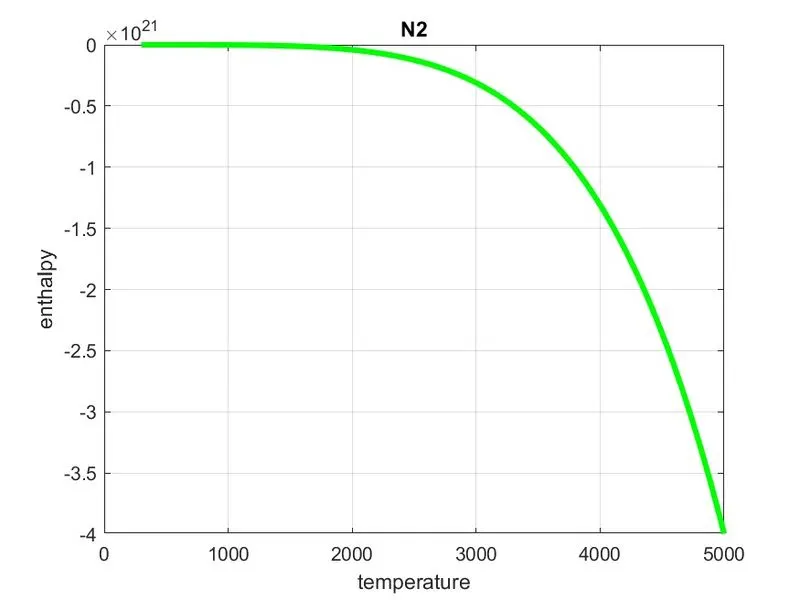
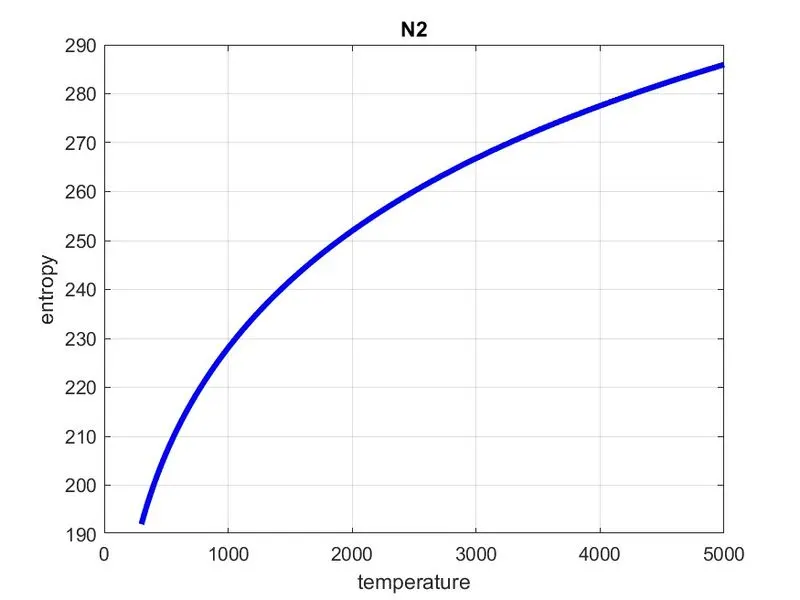
- CO2
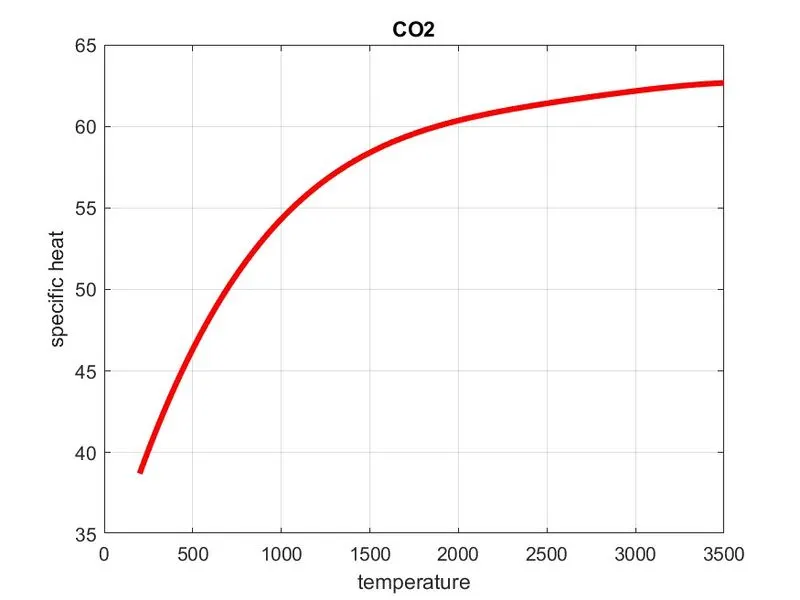
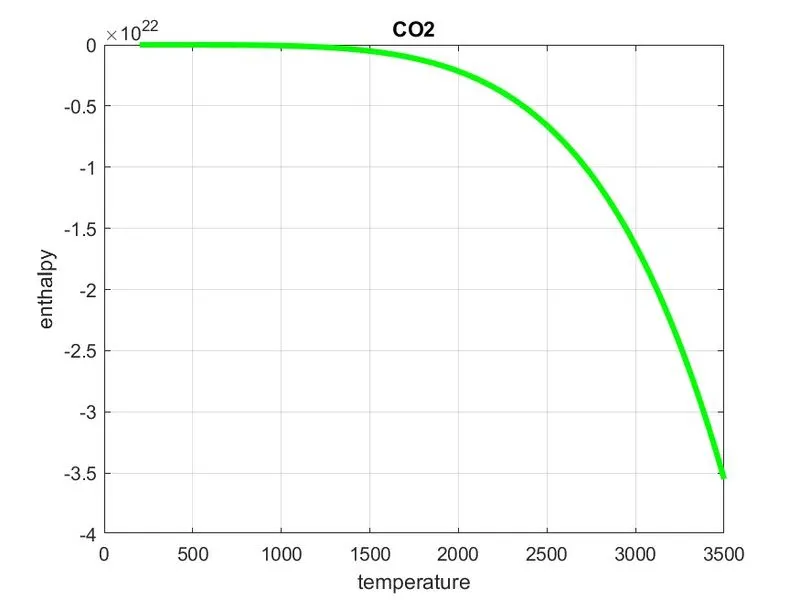
RESULTS OF MOLECULAER WEIGHT:
SCREEN SHOT OF THE FILES :