Week - 4
1)
Our objective is to create a state flow diagram of washing machine process which satisfies the following objectives:
- If the power supply is available, the system gets activated.
- If the Water supply is not available, stop the process & indicate through LED.
- Soaking time should be 200s followed by Washing time of 100s.
- Then rinsing happens for next 20s & dryer runs for 50s.
The stateflow diagram can be implemented using the chart block from simulink. Dashboard elements from simulink library are available inorder to be used as switches for turning on and off. The washoing machine process model using stateflow can be implemented as:
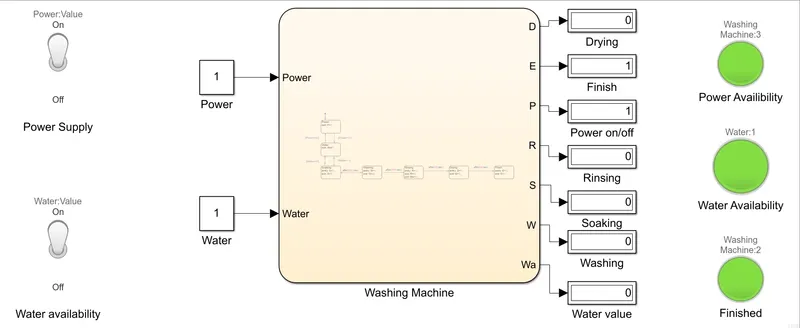
Here the toggle switches are used for switching on and off the power supply and water availability for the washing machine. The toggle switches are linked with the constant blocks Power and Water which are initially given values as '0'. So when the toggles switches are turned on the values of power and water toggles from '0' to '1'. When the power and water availability toggles to 1 or switches on the lamps on the right side switches to green.
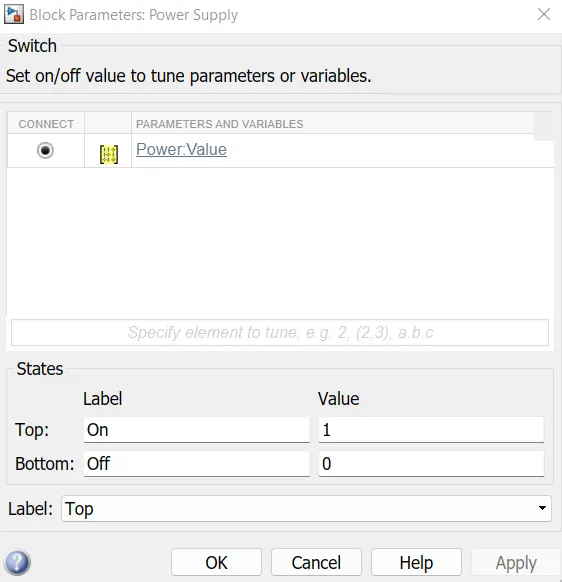
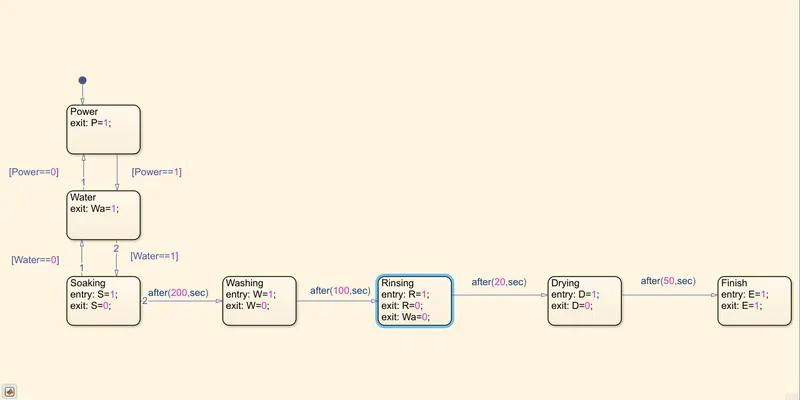
The stateflow diagram of the washing machine process is depicted above. When the Power is switched on it toggles to 1 and goes to the next state, when water=1 it goes to the next state or the first process inside the washing machine which is soaking. If water and power is 0, the process is halted. In the soaking stage beginning of the process is depicted as exit or '0' indicates the process has completed. As given in the objective after 200s it goes to the next process which is washing and '0' indicates the process has been completed and the washing time is given as 100s. After 100s it switches to the Rinsing stage, which has a duration of 20s. Similarly '0' indicates the process has been completed, Rinsing is the process where water exits from the washing machine. After 20s it switches to the Drying process of duration 50s. After completing drying the whole washing machine process is completed and E toggles to '1' when all the processes are accomplished.
Therefore for a succesfull process only power and finish display shows '1' and other processes indicates '0' as it has been completed.
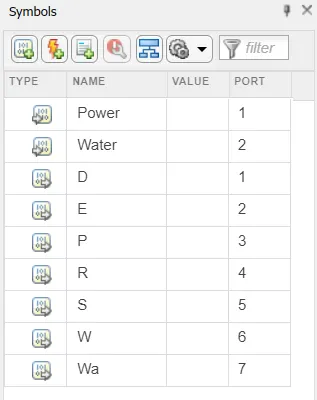
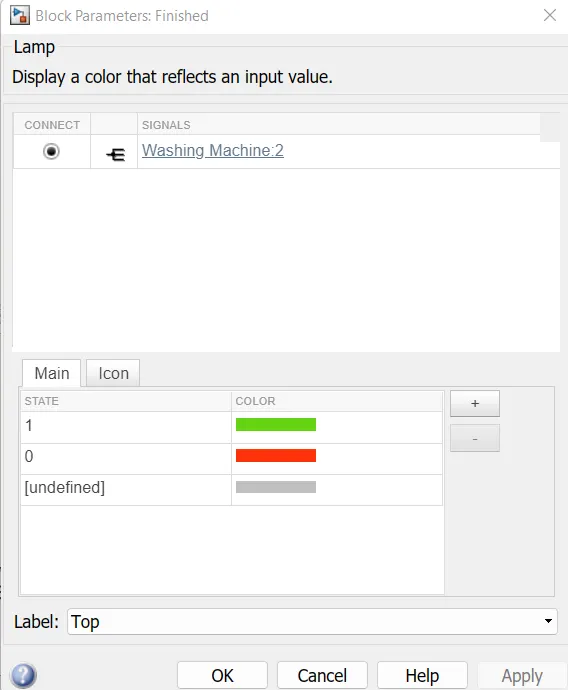
These are the output ports of the state flow block which are connected to the display block. The Lamp or indicator of finishing the process is also linked to the Finish display block.
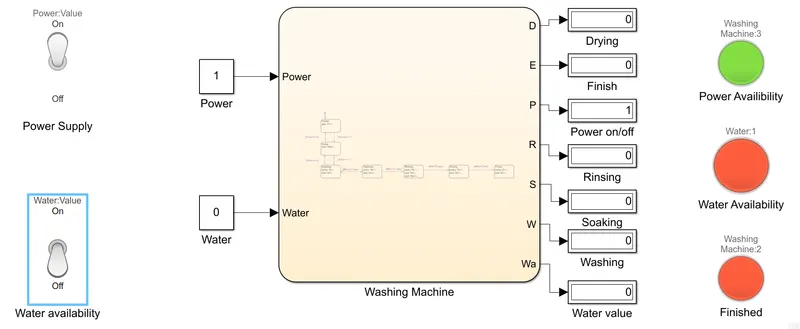
Here based on our objective, when the water is switched off the water availability indicator turns red and indicates that the whole washing machine process is halted indicating Red in the Finished lamp block.
2)
Our Objective is to make a Simulink chart for the “Gear shift” logic as per below conditions:
Speed Range(kmph) Gear
0 to 15 1
16 to 25 2
26 to 40 3
41 to 60 4
Above 61 5
And to give speed input while the simulation is running & display the gear number.
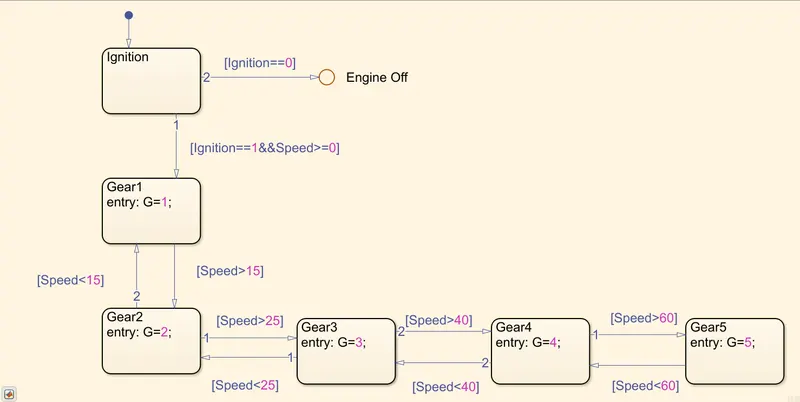
The above figure depicts the stateflow chart of the gear shift system. Here when ignition input toggles to 1, The engine is on and goes to gear 1 when speed is greater than or equal to 0. Now when the throttle is pushed further and gains a speed>15 the vehicle shifts to gear 2. and the state flow is structured such that when the speed becomes less than 15 the vehicle again shifts to gear 1. Now when the speed is greater than 25 the vehicle shifts to gear 3 and goes back to gear 2 when speed becomes less than 25. And when the speed becomes greater than 40, the vehicle shifts from gear 3 to 4 and vice-versa. And when the speed is greater than 60 it shifts to the 5th gear.
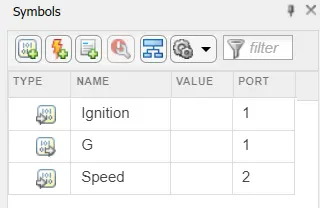
These are the ports of the stateflow chart and here the ignition is linked with a toggle switch and the speed is controlled by slider which depicts the throttle and the Gear is linked with a display.
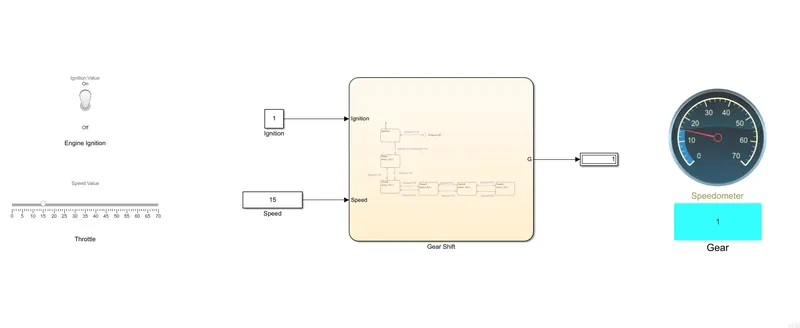
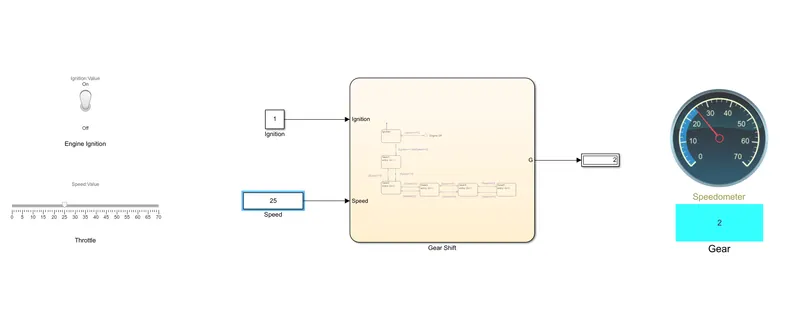
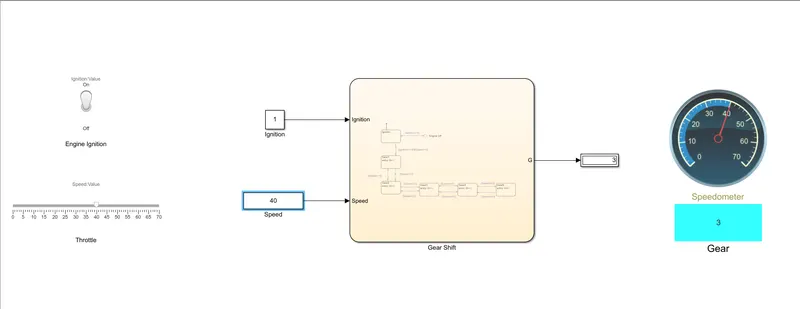
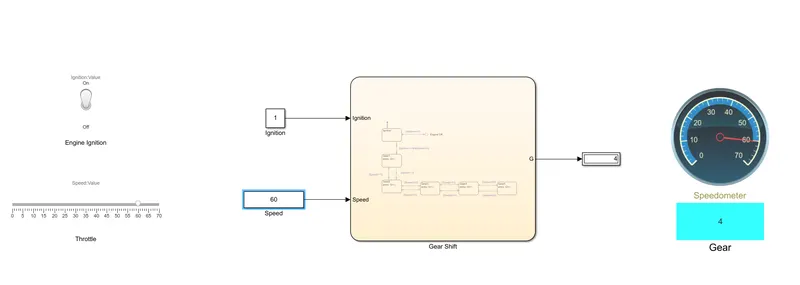
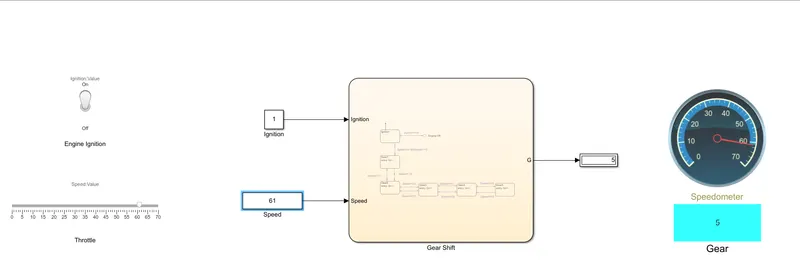
For displaying the Gear shift while the simulation is running, we can set the stop time to inf and vary the slider or throttle such that we can see the gear change in display block as the speed varies inside the speedometer.