Week-3 Challenge: ADVISOR Tool
From the Link provided in the FAQ section of Week 3 video Advisor Demo, we can download the advisor toolbox. After setting the path in MATLAB we can access Advisor tool through Command window.
1)
After opening the Advisor tool box and changing it to metric system click on start. A GUI window will be openend with vehicle information and drop down list of different vehicle models.
Our objective is to check whether the given vehicle with default 25 modules of Eneergy storage system can travel 45 km.
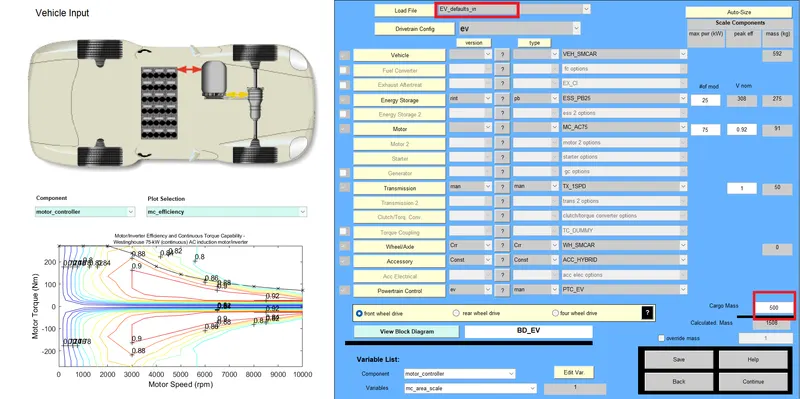
Then select 'EV_defaults_in' from load file which shows the vehicle model of an EV and change the 'cargo mass' to 500kg as mentioned in the question keeping all other values as default. Now we need to set the driving cycle, hence click on continue at the bottom right corner and another GUI window will be opened.
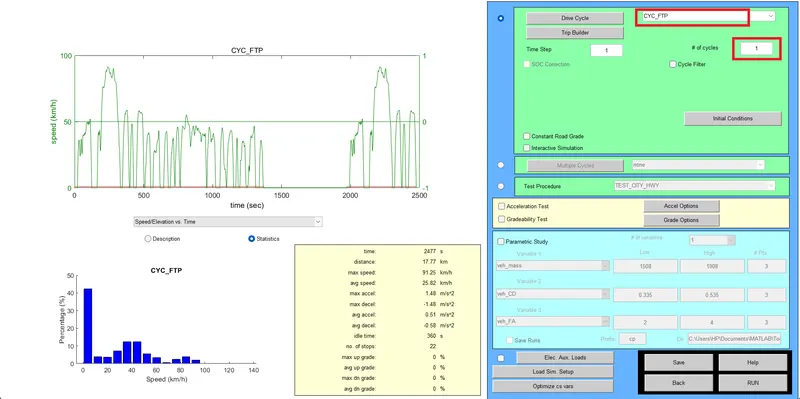
Now set the drive cycle to 'CYC_FTP' and no of cycle i.e, '# of cycle' to 1. Now we need to run the simulation for the respective inputs, hence click on 'RUN' at the bottom right corner.
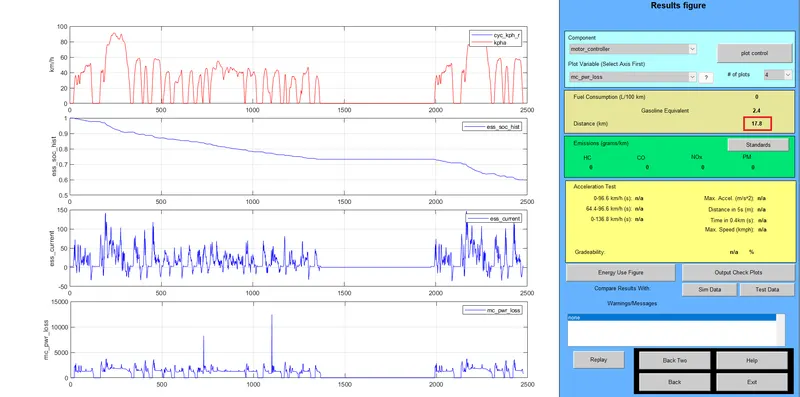
After running the simulation the results are shown in this GUI window. Here graph 1 shows the speed vs time plot, graph 2 shows the SOC level and it remains constant when the speed of the vehicle falls to zero for a certain period of time, Graph 3 shows the energy storage system current and graph 4 shows the motor controller power losses. Here on the right side we can see the distance covered with respect to the given number of drive cycle is 17.8 km at the expense of about 40% of Battery SOC.
Now click on 'Back' to go back to the previous GUI and change the '# of cycle' to 2 and run the results.
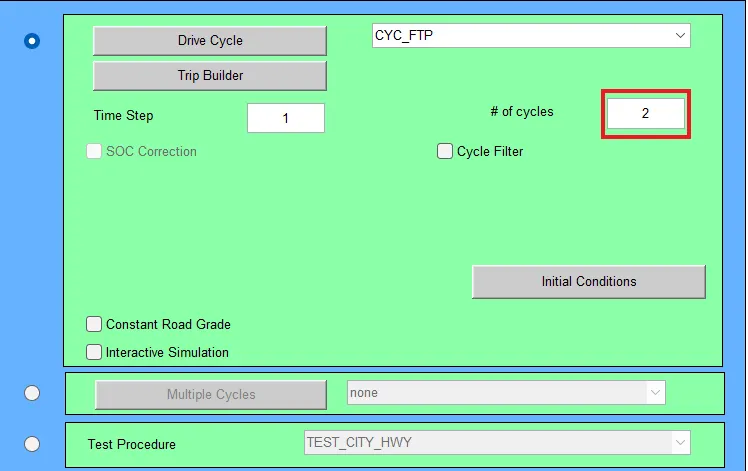
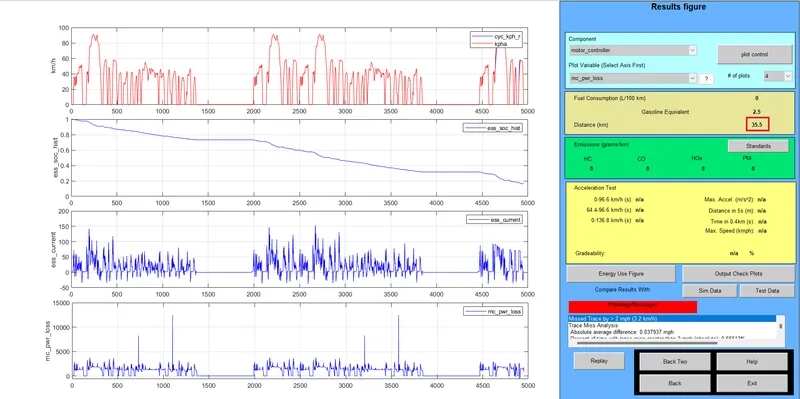
The graphs are shown as result after the simulation and the distance covered by the vehicle in 2 cycles is 35.5 km at the expense of about 80% of battery SOC. Now do the same steps by changing '# of cycle' to 3.
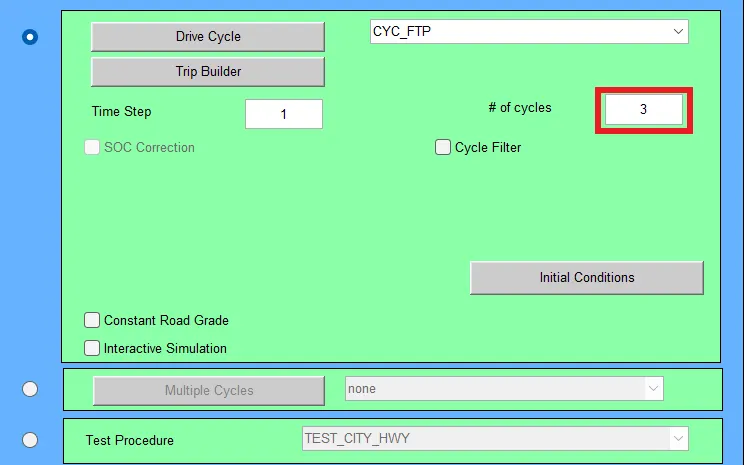
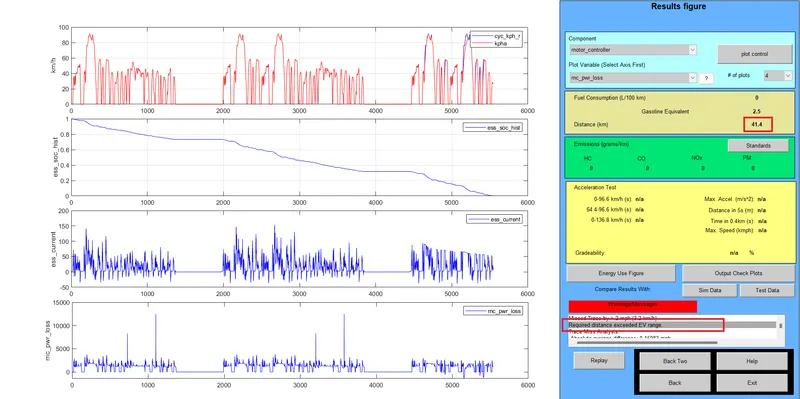
The results are shown for the respective simulation. Here the battery SOC drains out completely after reaching 41.4 km and a warning is shown with 'Required distance exceeded EV range'. Which means for the given drive cycle the vehicle completed 2 cycles and wasn't able to complete the 3rd one due to draining of battery SOC.
Hence this vehicle cannot cover 45 km with FTP drive cycle since the battery SOC has reached 0% or completely drained at a distance of 41.4 km.
2)
To meet the objective in the above case, one posible way is to increase the Battery Capacity and run the simulation to find out the required number of battery modules inorder for the vehicle to cover 45 km.
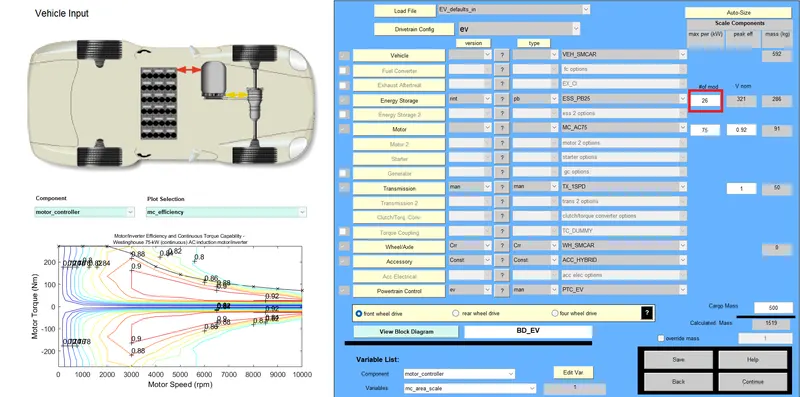
In the primary GUI along side the Energy Storage section chnage the '#of mod' from default value 25 to 26 modules. And similarly follow the steps in the above case for 3 number of cycle and Run the simulations.
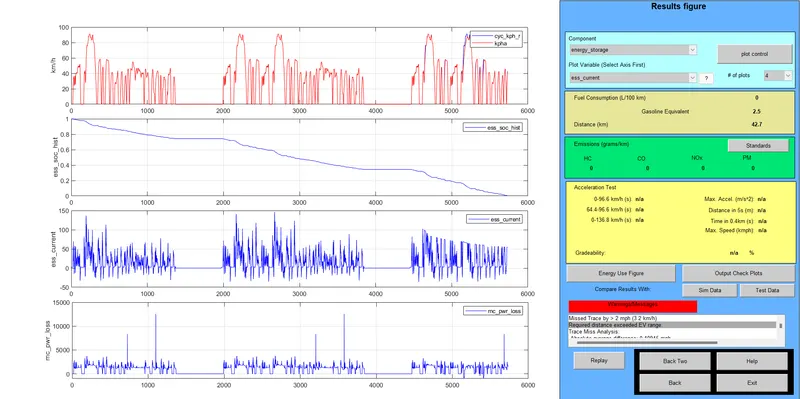
Here we can see that form graph 2, SOC goes to 0% after covering a distance of 42.7 km. As our objective is not met we need to increase the battery capacity again. Now click on 'Back Two' to go to the primary GUI to change '#of mod' to 27 modules.
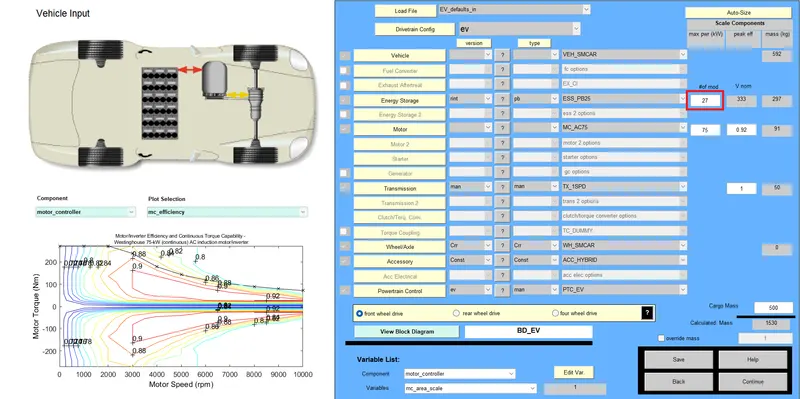
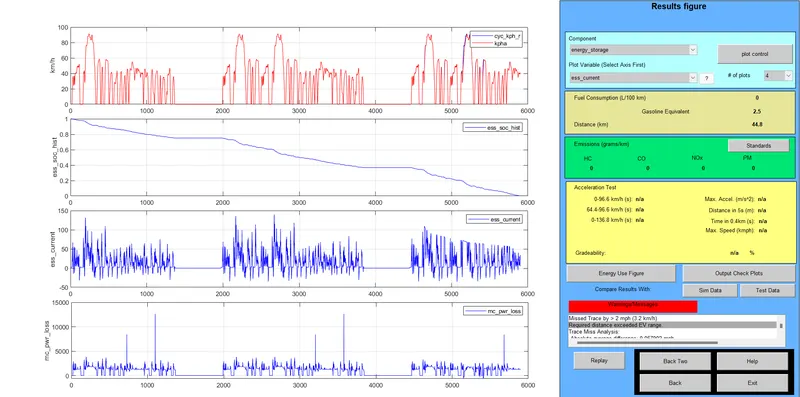
Here after running the simulation with 27 modules we can see that the battery SOC went to 0% after covering a distance of 44.8 km for the same drive cycle and number of drive cycles. We can see that our objective hasn't been met hence increase the number of module to 28.
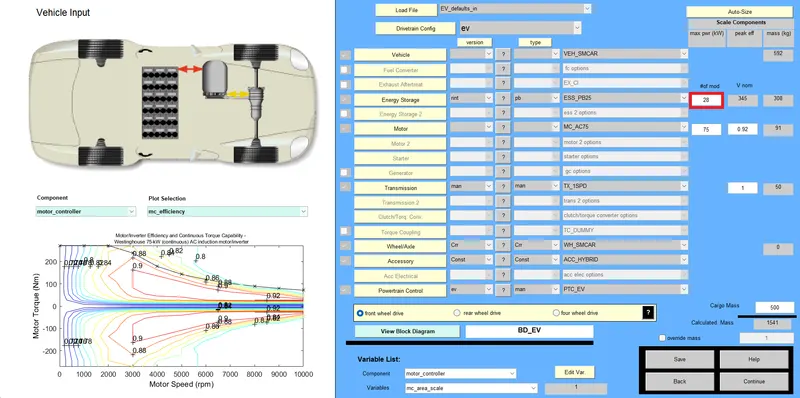
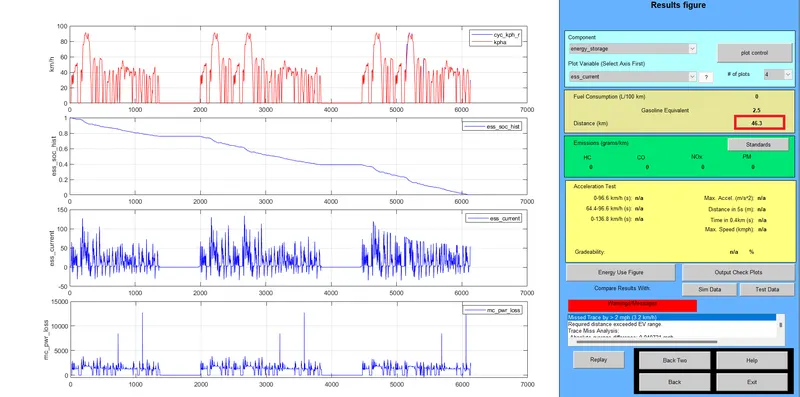
Here after running the simulations we can see that the SOC went to 0% after covering a distance of 46.3 km, which is greater than our objective of 45 km.
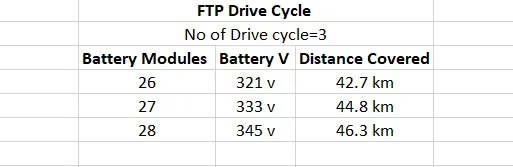
Hence from the table we can see that the vehicle will cover 45 km in FTP drive cycle by increasing the battery capacity i.e, by increasing the battery modules to 28 from default 25 value.
3)
In the primary GUI select the vehicle model as PRIUS_Jpn_defaults_in and all the default values will be loaded in the window.
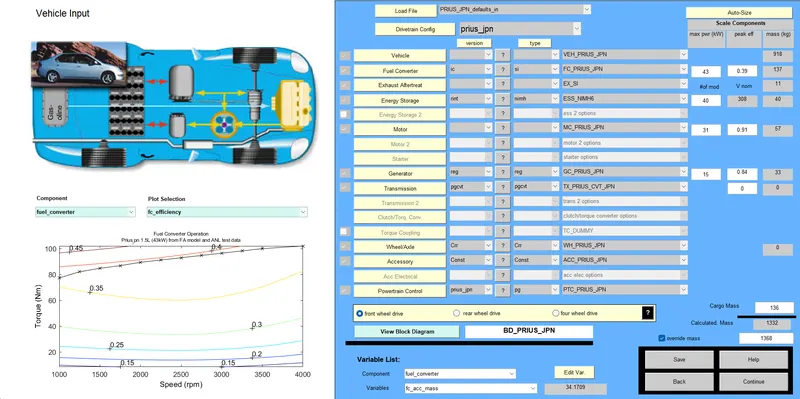
Now click on 'continue' to goto the drive cycle GUI. To set the values for Gradeability Test.
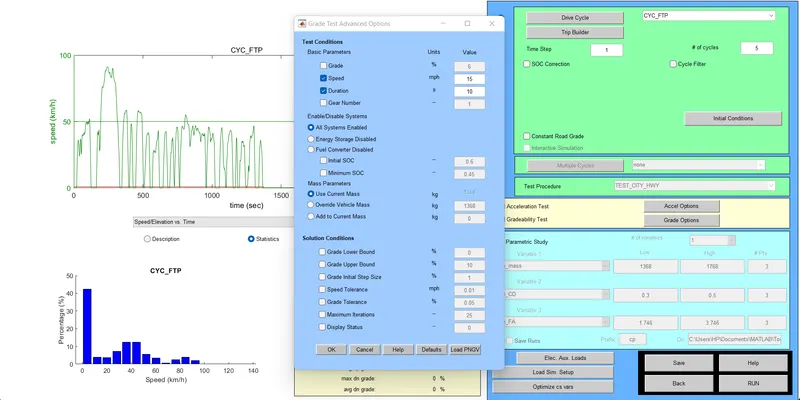
Here we are selecting the same FTP drive cycle with '# of cycles' to be 5 cycles. Below the Drive cycle parameters we can see 'Gradability Test' under 'Acceleration Test' if we select the gradebility test and select on 'Grade options' we can edit the grade test parameters. Here we are keeping the grade value constant at 6% and duration at 10 seconds. For the First case we change the speed to 15 mph and Select 'All systems Enabled' for both energy sources to get enabled during the test.
After setting the values click on 'OK' and 'RUN' the simulations.
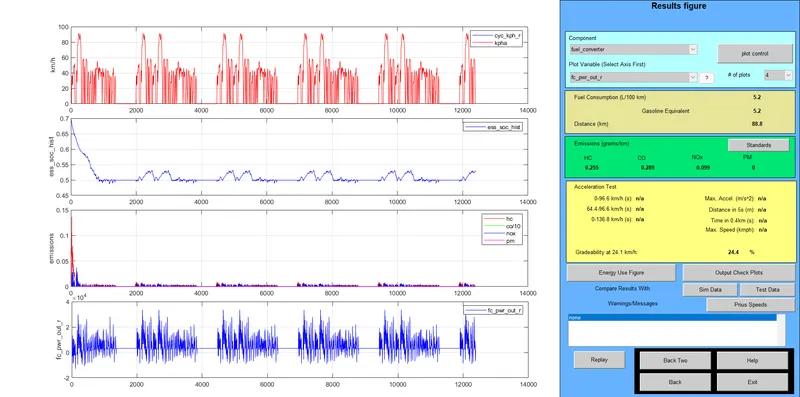
The simulation results shows the speed vs time graph, the SOC variation of the energy storage system, the emission as the evhicle model is hybrid-EV and the fuel coverter power output. Here we can see that at 15 mph or 24.1 km/h the gradeability is 24.4%.
Similarly find out the gradeability values by changing the speed from previous GUI by 5 mph and run the simulations.
For 20 mph;
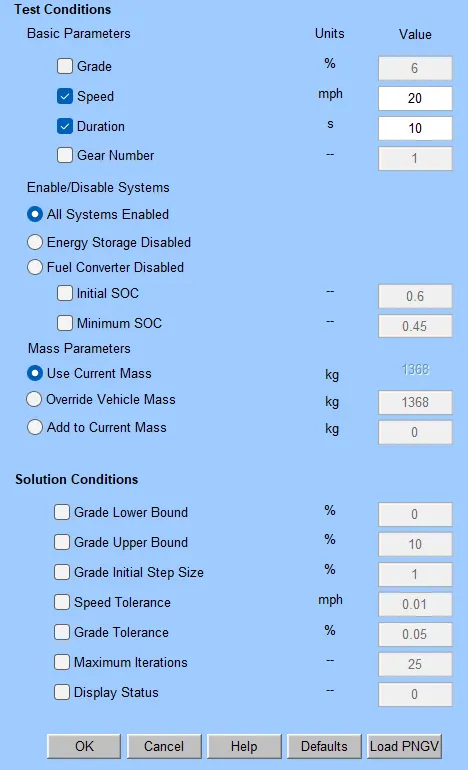
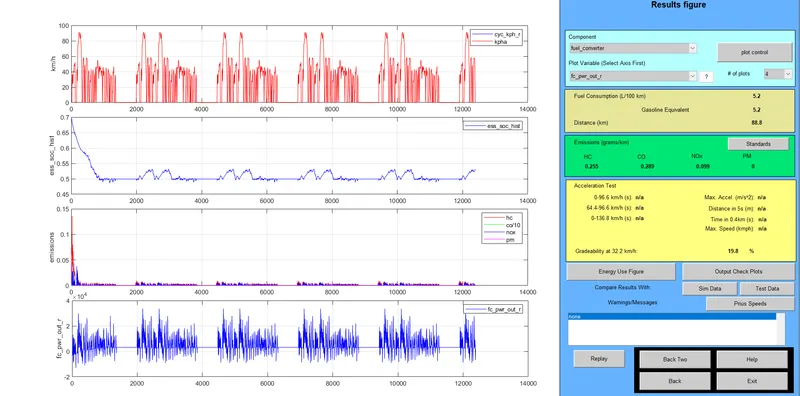
Gradeability for 20 mph or 32.2 km/h is 19.8%.
similary we find out the gradeability values till 50 mph by changing the value of speed by 5 mph.
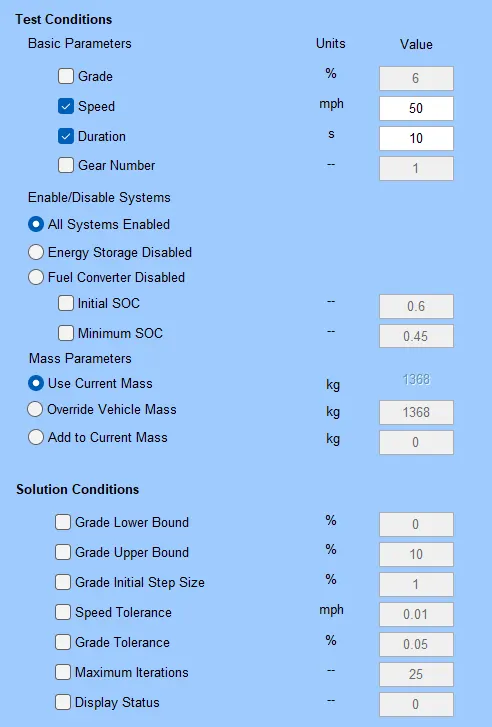
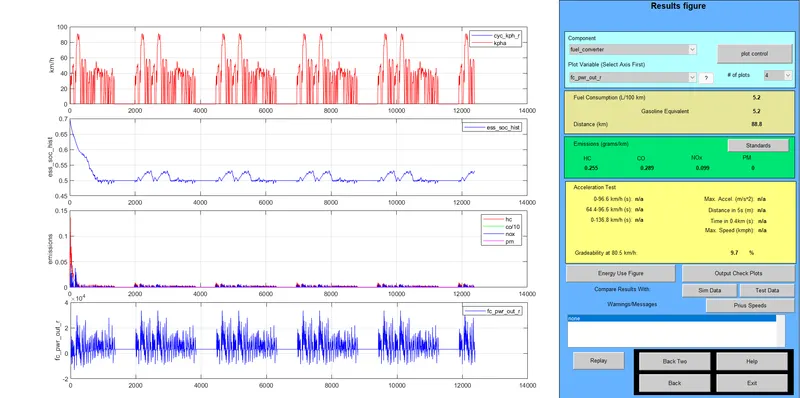
For 50 mph or 80.5 km/h the Gradeability is 9.7%. We can similarly change the time for the gradeability test as well.
From the simulations the following results were obtained:
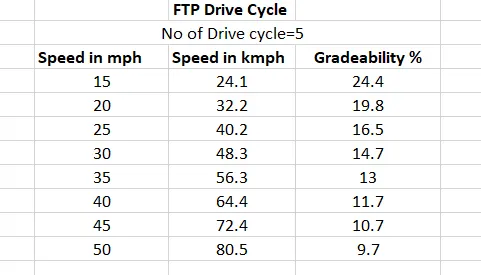
For the duration of 10 sec, by varying the speed we get the following results for gradeability. We can conclude that from the results as the speed increases the gradeability decreases. Here for the values of speed, the maximum gradeability is obtained at 15 mph and minimum gradeability is obtained at 50 mph.