Week - 4
AIM-
- Implement control logic of a “washing machine” using Stateflow as per given sequence:
- If the power supply is available, the system gets activated
- If the Water supply is not available, stop the process & indicate through LED
- Soaking time should be 200s followed by Washing time of 100s.
- Then rinsing happens for next 20s & dryer runs for 50s
After all the processes have completed turn on the finished LED.
- Make a Simulink chart for the “Gear shift” logic as per below conditions:
Speed Range(kmph) Gear
0 to 15 1
16 to 25 2
26 to 40 3
41 to 60 4
Above 61 5
Give speed input while the simulation is running & display the gear number.
EXPLAINATION-
STATEFLOW OF AUTOMATIC WASHING MACHINE MODEL-
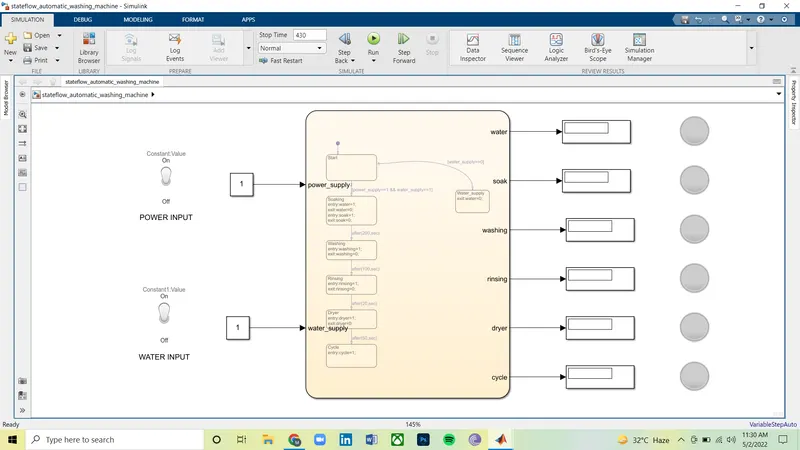
FIGURE-1
Parameter- Condition-
Value: ‘1’ means ‘input present’ Lamp color green-‘Process in-progress’
Value: ‘0’ means ‘no input present’ Lamp color red-‘Process end’
CHART-DIAGRAM-
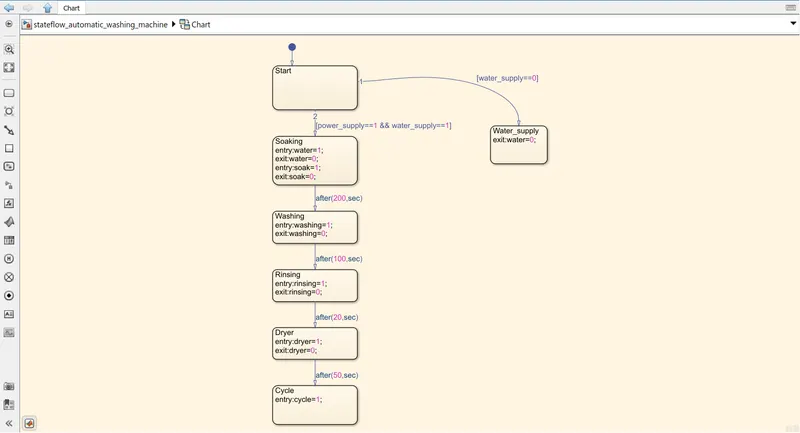
FIGURE-2
- Open the Simulink application from the Matlab software.
- Click on create ‘Blank Model’.
- Search for ‘Chart’ model & double click to start the stateflow.
- Create Transition stateflow chart as shown in the above figure 2.
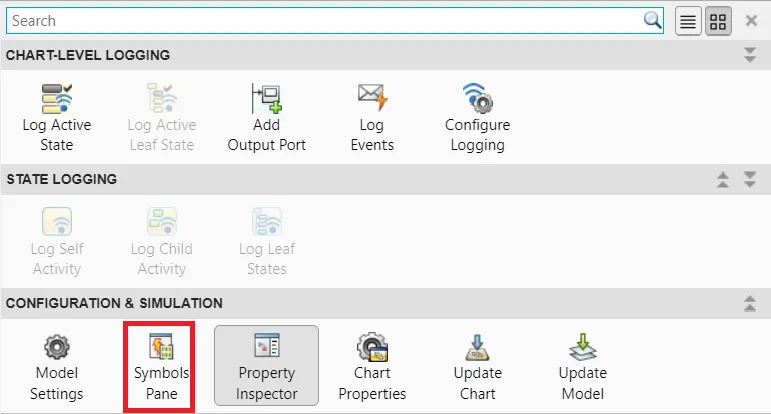 FIGURE-3
Goto the task bar search option, select symbol pane then dialogue box will appear as shown below-
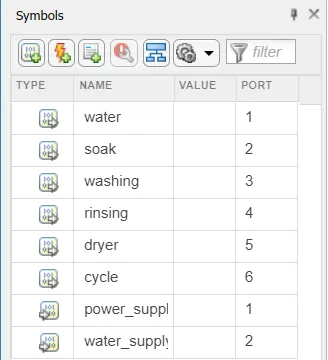
FIGURE-4
OUTPUT PARAMETERS- Water, soak, washing, rinsing, dryer & cycle.
INPUT PARAMETERS- Power_supply & water_supply.
- Exit the ‘Chart’ model which redirect to the main page of the Simulink as shown in figure 1.
- Simulation time i.e stop time is set to 430sec as shown below-
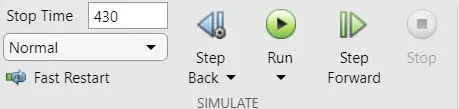
FIGURE-5
CONDITION-
- If the water_supply is cut off & only power_supply is given.
The outcome is shown below-
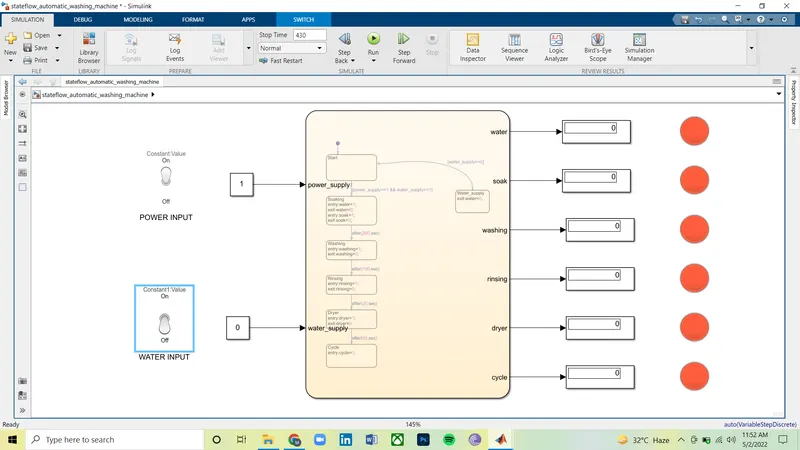
FIGURE-6
Parameter- Condition-
Value: ‘1’ means ‘input present’ Lamp color green-‘Process in-progress’
Value: ‘0’ means ‘no input present’ Lamp color red-‘Process end’
From the above diagram, it is observed that the indicator of the water is showing ‘RED’ means the process is terminated.
- If both the water_supply & power_supply is given. The outcome is shown below-
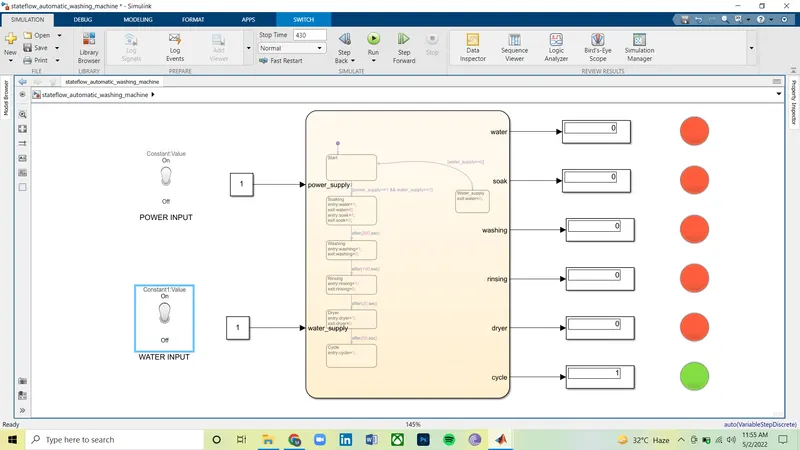
FIGURE-7
Parameter- Condition-
Value: ‘1’ means ‘input present’ Lamp color green-‘Process in-progress’
Value: ‘0’ means ‘no input present’ Lamp color red-‘Process end’
From the above diagram, it is observed that the indicator is showing ‘GREEN’, that means all the state has been executed and final completion of the process.
CONCLUSION-
The simulation of the automatic washing is used by the stateflow is done & the result is satisfactory.
2) Make a Simulink chart for the “Gear shift” logic as per below conditions:
Speed Range(kmph) Gear
0 to 15 1
16 to 25 2
26 to 40 3
41 to 60 4
Above 61 5
Give speed input while the simulation is running & display the gear number.
EXPLAINATION-
STATEFLOW OF GEAR SHIFT LOGIC MODEL-
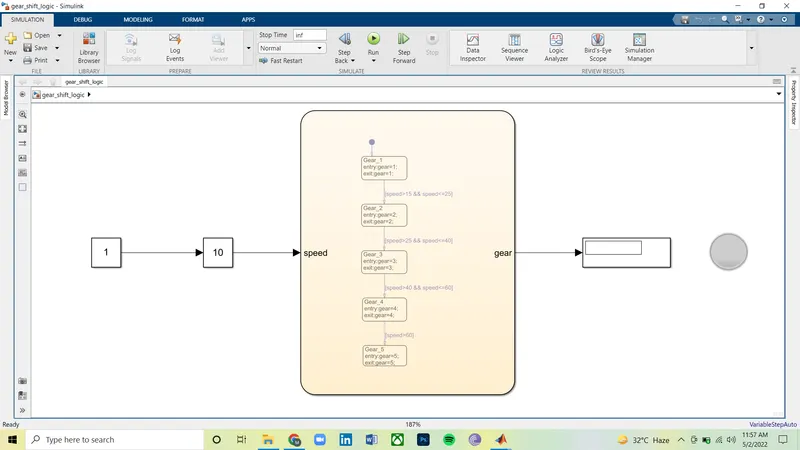
FIGURE-8
CHART DIAGRAM-
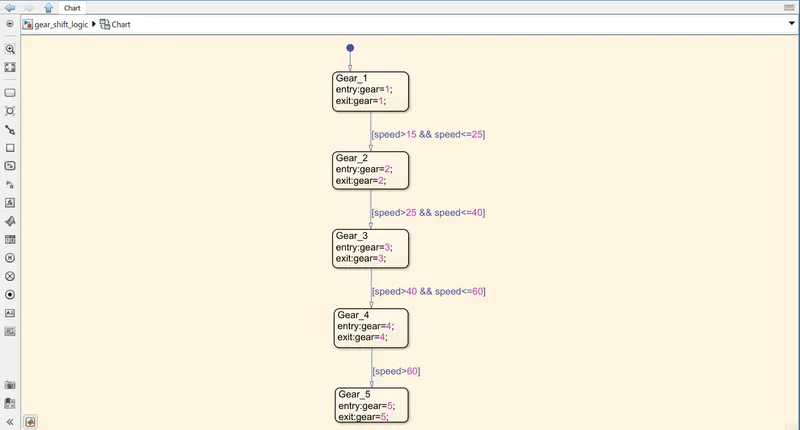
FIGURE-9
- Open the Simulink application from the Matlab software.
- Click on create ‘Blank Model’.
- Search for ‘Chart’ model & double click to start the stateflow.
- Create Transition stateflow chart as shown in the above figure 9.
FIGURE-10
Goto the task bar search option, select symbol pane then dialogue box will appear as shown below-
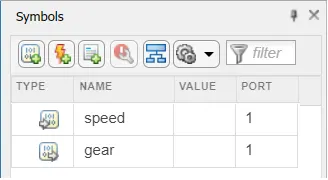
FIGURE-11
INPUT PARAMETERS- speed
OUTPUT PARAMETERS- Gear
- Simulation time i.e stop time is set to ‘inf’ as shown below-
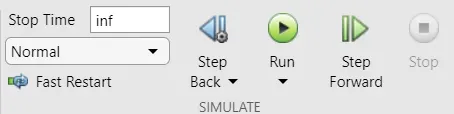
FIGURE-12
‘inf’ means infinity. Infinity results from operations like division by zero and overflow, which lead to results too large to represent as conventional floating-point values.
INPUT-
We use gain slider to provide the input in the chart.
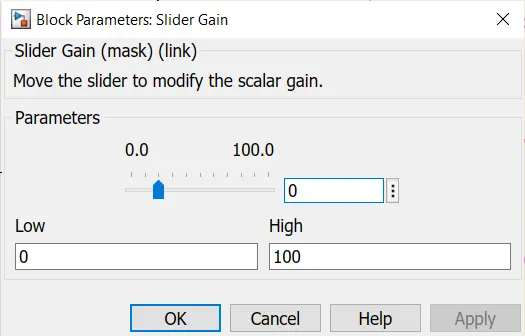
FIGURE-13
Changing the values from 0 to 100 using gain slider during the simulation.
OUTPUT-
The output is been produce by simulation which has been recorded.
GEAR-1
Speed Range(kmph): 0 to 15
Input speed: 10kmph
Color: Green
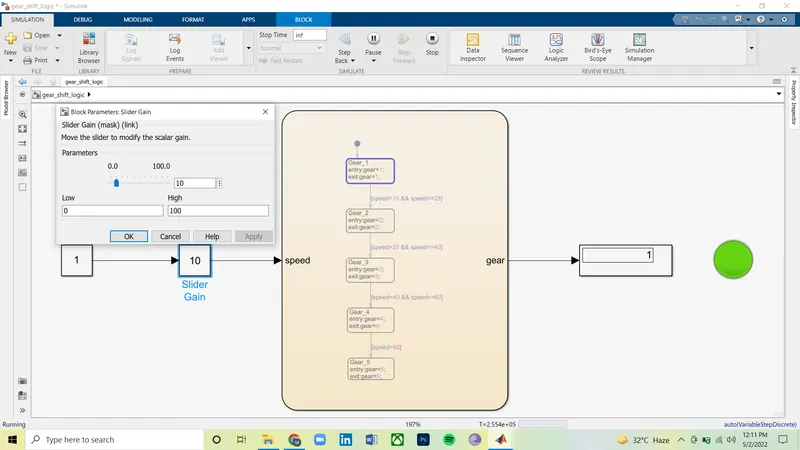
FIGURE-14
GEAR-2
Speed Range(kmph): 16 to 25
Input speed: 22kmph
Color: Blue
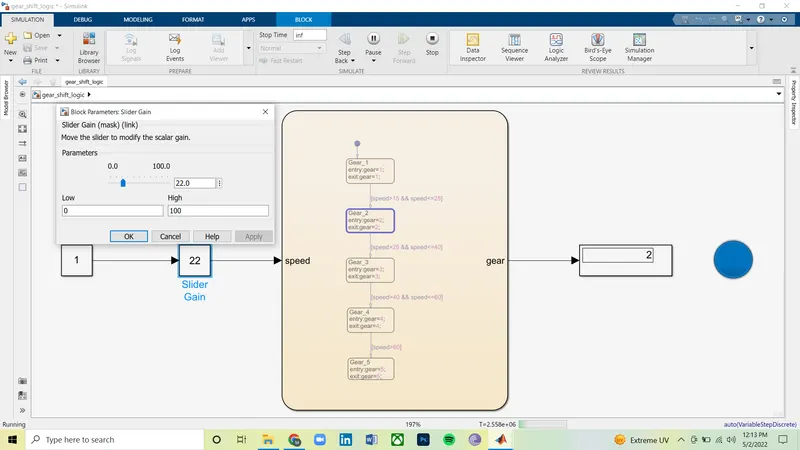
FIGURE-15
GEAR-3
Speed Range(kmph): 26 to 40
Input speed: 36kmph
Color: Light blue
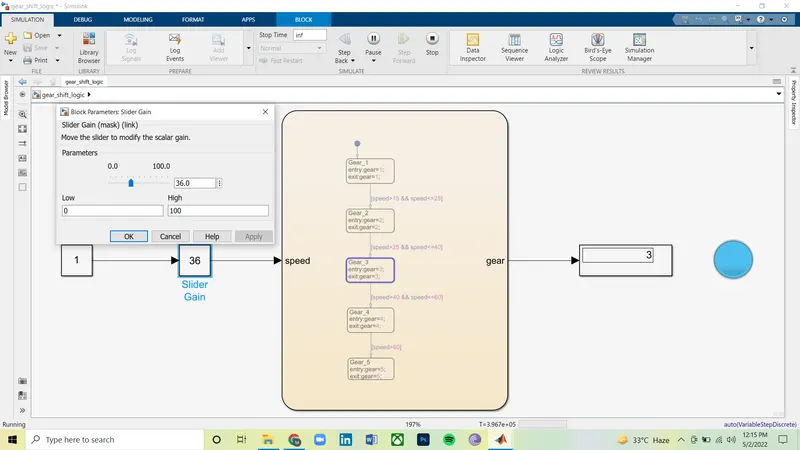
FIGURE-16
GEAR-4
Speed Range(kmph): 41 to 60
Input speed: 53kmph
Color: Yellow
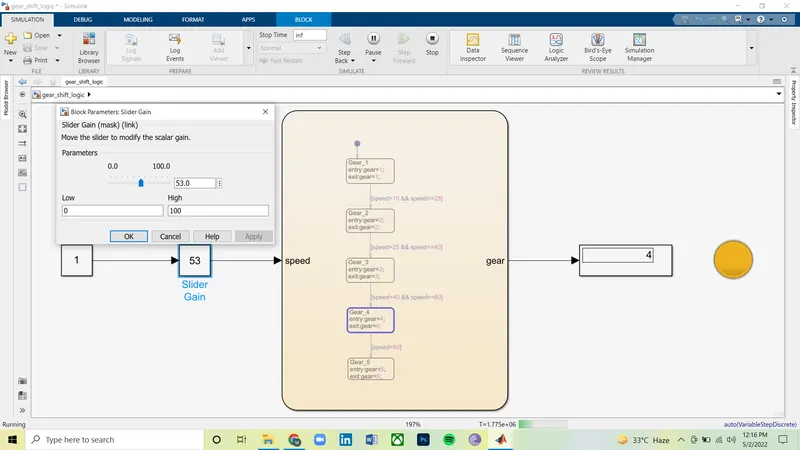
FIGURE-17
GEAR-5
Speed Range(kmph): Above 61
Input speed: 88kmph
Color: Red
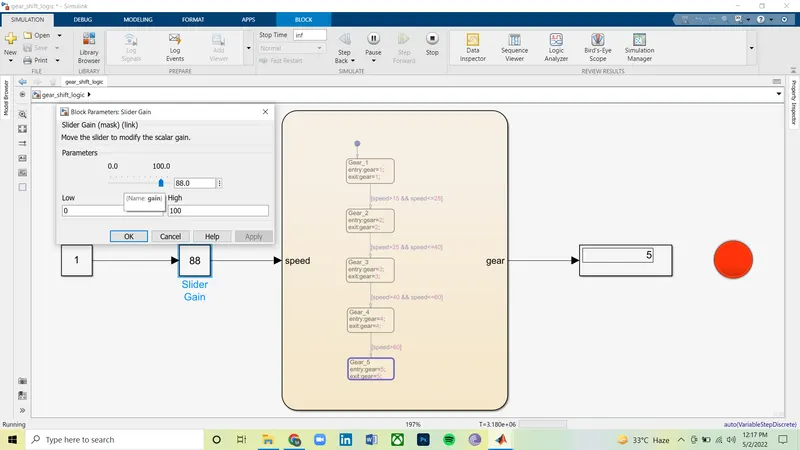
FIGURE-18
CONCLUSION-
The simulation of the ‘Gear Shift’ logic is used by the stateflow is done & the result is satisfactory.