Project 1 - Parsing NASA thermodynamic data
PROJECT 1: PARSING NASA THERMODYNAMIC DATA
AIM – To extract the 14 coefficients of the each species block of the given file or data of the NASA thermodynamic data and also to calculate the specific heat(c_p), entropy(S), enthalpy(H), and the molecular weight. Plot the graphical representation of the each element species with individual folder at the end of the program.
INTRODUCTION-
FILE PASRING- It means to resolve a sentence or a data-stream model to describe their syntactic role. It is the process of analyzing the string array, the cell array etc in the form of computer language, natural language or data structure.
In this project, is to extract the coefficient which is used to calculate the specific heat, enthalpy, entropy by the following formula:
Cp/R = a1 + a2 T + a3 T^2 +a4 T^3 + a5 T^5
H/RT = a1 + a2 T/2 + a3 T^2 /3 + a4 T^3 /4 + a5 T^4 /5 + a6/T
S/R = a1 lnT + a2 T + a3 T^2 /2 + a4 T^3 /3 + a5 T^4 /4 + a7
PROGRAM-
THE MAIN PROGRAM-
clear all
close all
clc
% GasConstant Value
R = 8.314;
% Reading the data file given
f1 = fopen('THERMO.dat','r');
% Reading the first line of the line
fgetl(f1);
Global_temp = fgetl(f1);
t = strsplit(Global_temp);
global_min = str2double(t{2});
global_mid = str2double(t{3});
global_max = str2double(t{4});
% Defining the temperature range
temp = linspace(global_min,global_max,500);
for i = 1:3
fgetl(f1);
end
for i = 1:53
l = fgetl(f1);
element_name = strtok(l);
l1 = fgetl(f1);
l2 = fgetl(f1);
l3 = fgetl(f1);
% Finding the postion of E in each given temperature
P1 = strfind(l1,'E');
P2 = strfind(l2,'E');
P3 = strfind(l3,'E');
% Finding the high temperature coefficient
hc1 = str2double(l1(1:P1(1)+3));
hc2 = str2double(l1(P1(1)+3:P1(2)+3));
hc3 = str2double(l1(P1(2)+3:P1(3)+3));
hc4 = str2double(l1(P1(3)+3:P1(4)+3));
hc5 = str2double(l1(P1(4)+3:P1(5)+3));
hc6 = str2double(l2(1:P2(1)+3));
hc7 = str2double(l2(P2(1)+4:P2(2)+3));
% Finding the low tempurature coefficient
lc1 = str2double(l2(P2(2)+4:P2(3)+3));
lc2 = str2double(l2(P2(3)+4:P2(4)+3));
lc3 = str2double(l2(P2(4)+4:P2(5)+3));
lc4 = str2double(l3(1:P3(1)+3));
lc5 = str2double(l3(P3(1)+4:P3(2)+3));
lc6 = str2double(l3(P3(2)+4:P3(3)+3));
lc7 = str2double(l3(P3(3)+4:P3(4)+3));
% Calling the specific heat function
c_p = specific_heat(hc1,hc2,hc3,hc4,hc5,lc1,lc2,lc3,lc4,lc5,R,temp,global_mid);
% Calling the enthalpy function
H = enthalpy(hc1,hc2,hc3,hc4,hc5,hc6,lc1,lc2,lc3,lc4,lc5,lc6,R,temp,global_mid);
% Calling the entropy function
S = entropy(hc1,hc2,hc3,hc4,hc5,hc7,lc1,lc2,lc3,lc4,lc5,lc7,R,temp,global_mid);
% Calling the Plotting function
plotting(c_p,H,S,temp,element_name);
% Calculating the molecular weight function
mw(i) = molecular_weight(element_name);
X = sprintf('%s_%d',element_name,mw(i));
disp(X);
end
fclose(f1)
EXPLAINAITION-
- Clear all, close all and clc is written first before starting the program because if any numerical values, variables etc, are present then the final result may get error or it may get manipulated. It will close it out.
- % Gas Constant Value
R = 8.314;
This is the given data of input value ‘R’
- % Reading the data file given
f1 = fopen('THERMO.dat','r');
fopen means to open the file of the given data,[FILE NAME-‘THERMO.dat’], so MATLAB can locate file where it is present and ‘r’ is the ‘permission’ which mean it is the reading file, likewise same for ‘w’ which means it is the writing file.
- % Reading the first line of the line
fgetl(f1);
fgetl- It’s commands which gives the first information from the given file which has been provided, if this command is done again and again then it will give the next information and so on.
In this case, [fgetl(f1)] commands gives the first information of NASA Thermodynamic which is ‘THERMO’, i.e the first line of the given data in the file.
- Global_temp = fgetl(f1);
t = strsplit(Global_temp);
To find out the global temperature(Global_temp) which it is consider as variable and fgetl(f1) will give the next information for Global_temp=300.000 1000.000 5000.000
Strsplit- This command splits on the delimiter or whitespace character {‘ ’ , ‘\f’, ‘\n’,}. If str has consecutive whitespace characters, then str split treats as one whitespace.
Str2double- str2double converts the text in str to double precision values. str contains text that represents real or complex numeric values. str can be a character vector, a cell array of character vectors, or a string array.
In this case, Global_temp will get split by the data as shown below:
global_min = str2double(t{2});
global_mid = str2double(t{3});
global_max = str2double(t{4})
global_min = ‘300.000’
global_mid = ‘1000.000’
global_max = ‘5000.000’
If the program is ‘run’ then it will show the value of ‘global_min’, ‘global_mid’ , ‘global_max’ in the workspace window.
- for i = 1:3
fgetl(f1);
end
This is done because to skip the next three information which is not useful for this program i.e comments (!).
- for i = 1:53
l = fgetl(f1);
The temperature coefficient of 53 block species are defined by using ‘for’ loop
element_name = strtok(l);
strtok- strtok parses str from left to right, using whitespace characters as delimiters, and returns part or all of the text in token.
Strtok command is used to read the first character of the element name.
l1 = fgetl(f1); [l1 = line no.1 for the species block]
l2 = fgetl(f1); [l2 = line no.2 for the species block]
l3 = fgetl(f1); [l3 = line no.3 for the species block]
% Finding the position of E in each given temperature
P1 = strfind(l1,'E');
P2 = strfind(l2,'E');
P3 = strfind(l3,'E');
Strfind- The strfind command executes a case-sensitive search. If str is a character vector or a string scalar, then strfind returns a vector of type double . If str is a cell array of character vectors or a string array, then strfind returns a cell array of vectors.
[P1= POSTION OF ‘E’(DELIMITER) IN LINE NO.1(l1)]
[P2= POSTION OF ‘E’(DELIMITER) IN LINE NO.2(l2)]
[P1= POSTION OF ‘E’(DELIMITER) IN LINE NO.3(l3)]
In this case, it is finding (strfind) the postion of ‘E’ in l1,l2,l3.
If it is compute in the command windows l1 data to find the P1, as shown below,
11 26 41 56 71
similarly for l2, l3 to find P2, P3 respectively.
- % Finding the high temperature coefficient
hc1 = str2double(l1(1:P1(1)+3));
hc2 = str2double(l1(P1(1)+3:P1(2)+3));
hc3 = str2double(l1(P1(2)+3:P1(3)+3));
hc4 = str2double(l1(P1(3)+3:P1(4)+3));
hc5 = str2double(l1(P1(4)+3:P1(5)+3));
hc6 = str2double(l2(1:P2(1)+3));
hc7 = str2double(l2(P2(1)+4:P2(2)+3));
- % Finding the low temperature coefficient
lc1 = str2double(l2(P2(2)+4:P2(3)+3));
lc2 = str2double(l2(P2(3)+4:P2(4)+3));
lc3 = str2double(l2(P2(4)+4:P2(5)+3));
lc4 = str2double(l3(1:P3(1)+3));
lc5 = str2double(l3(P3(1)+4:P3(2)+3));
lc6 = str2double(l3(P3(2)+4:P3(3)+3));
lc7 = str2double(l3(P3(3)+4:P3(4)+3));
% Finding the high temperature coefficient
- EXPLAINING THE BREAK-UP OF THE COMPUTATION OF hc1
l1 = 2.56942078E+00-8.59741137E-05 4.19484589E-08-1.00177799E-11 1.22833691E-15
hc1 = str2double(l1(1:P1(1)+3));
where as
hc1 = higher temp of coefficient of 1stline data(2.56942078E+00).
l1 = 1stline of given data of the species block.
P1 = 1stposition of the delimiter(‘E’) in 1stline.
(l1(1:P1(1)+3))
where as
1 = (2.56942078E+00) : P1(1) = 2.56942078E and +3 = (+00)
- EXPLAINING THE BREAK-UP OF THE COMPUTATION OF hc2
l1 = 2.56942078E+00-8.59741137E-05 4.19484589E-08-1.00177799E-11 1.22833691E-15
hc2 = str2double(l1(P1(1)+3:P1(2)+3));
where as
hc2 =higher temp of coefficient of 1stline data(-8.59741137E-05).
l1 =1stline of given data of the species block.
P1 =1stposition of the delimiter(‘E’) in 1stline.
(l1(P1(1)+3:P1(2)+3))
where as
P1(1) = 2.56942078E and +3 = (+00) : P1(2) = -8.59741137E and +3 = (-05)
- EXPLAINING THE BREAK-UP OF THE COMPUTATION OF hc3
l1 = 2.56942078E+00-8.59741137E-05 4.19484589E-08-1.00177799E-11 1.22833691E-15
hc3 = str2double(l1(P1(2)+3:P1(3)+3));
where as
hc3 = higher temp of coefficient of 1stline data(4.19484589E-08).
l1 = 1st line of given data of the species block.
P1 = 1st position of the delimiter(‘E’) in 1stline.
(l1(P1(2)+3:P1(3)+3))
P1(2) = -8.59741137E and +3 = (-05) : P1(3)`= 4.19484589E and +3 = (-08)
- EXPLAINING THE BREAK-UP OF THE COMPUTATION OF hc4
l1 = 2.56942078E+00-8.59741137E-05 4.19484589E-08-1.00177799E-11 1.22833691E-15
hc4 = str2double(l1(P1(3)+3:P1(4)+3));
where as
hc4 = higher temp of coefficient of 1stline data(-1.00177799E-11)
l1 = 1st line of given data of the species block
P1 = 1st position of the delimiter(‘E’) in 1stline
(l1(P1(3)+3:P1(4)+3));
where as
P1(3) = 4.19484589E and +3 = (-08) : P1(4) = -1.00177799E and +3 = (-11)
- EXPLAINING THE BREAK-UP OF THE COMPUTATION OF hc5
l1 = 2.56942078E+00-8.59741137E-05 4.19484589E-08-1.00177799E-11 1.22833691E-15
hc5 = str2double(l1(P1(3)+3:P1(4)+3));
where as
hc5 = higher temp of coefficient of 1stline data(1.22833691E-15)
l1 = 1st line of given data of the species block
P1 = 1st position of the delimiter(‘E’) in 1stline
(l1(P1(4)+3:P1(5)+3));
Where as
P1(4) = -1.00177799E and +3 = (-11) : P1(5) = 1.22833691E and +3 = (-15)
- EXPLAINING THE BREAK-UP OF THE COMPUTATION OF hc6
l2 = 2.92175791E+04 4.78433864E+00 3.16826710E+00-3.27931884E-03 6.64306396E-06
hc6 = str2double(l2(1:P2(1)+3));
where as
hc6 = higher temp of coefficient of 2nd line data(2.92175791E+04)
l2 = 2nd line of given data of the species block
P2 = 2nd position of the delimiter(‘E’) in 2nd line
(l2(1:P2(1)+3));
Where as
1 = (2.92175791E+04) : P2(1) = 2.92175791E and +3 = (+04)
- EXPLAINING THE BREAK-UP OF THE COMPUTATION OF hc7
l2 = 2.92175791E+04 4.78433864E+00 3.16826710E+00-3.27931884E-03 6.64306396E-06
hc7 = str2double(l2(P2(1)+4:P2(2)+3));
where as
hc7 = higher temp of coefficient of 2nd line data(4.78433864E+00)
l2 = 2nd line of given data of the species block
P2 = 2nd position of the delimiter(‘E’) in 2nd line
(l2(P2(1)+4:P2(2)+3));
where as
P2(1) = 2.92175791E and +4 = (+04 4) : P2(2) = 4.78433864E and +3 = (+00)
% Finding the low temperature coefficient
- EXPLAINING THE BREAK-UP OF THE COMPUTATION OF lc1
l2 = 2.92175791E+04 4.78433864E+00 3.16826710E+00-3.27931884E-03 6.64306396E-06
lc1 = str2double(l2(P2(2)+4:P2(3)+3));
where as
lc1 = lower temp of coefficient of 2ndline data(3.16826710E+00).
l2 = 2ndline of given data of the species block.
P2 = 2ndposition of the delimiter(‘E’) in 2ndline.
(l2(P2(2)+4:P2(3)+3));
where as
P2(2) = 4.78433864E and +4 = (+00 3) : P2(3) = 3.16826710E and +3 = (+00)
- EXPLAINING THE BREAK-UP OF THE COMPUTATION OF lc2
l2 = 2.92175791E+04 4.78433864E+00 3.16826710E+00-3.27931884E-03 6.64306396E-06
lc2 = str2double(l2(P2(3)+4:P2(4)+3));
where as
lc2 = lower temp of coefficient of 2ndline data(-3.27931884E- 03).
l2 = 2ndline of given data of the species block.
P2 = 2ndposition of the delimiter(‘E’) in 2ndline.
(l2(P2(3)+4:P2(4)+3));
where as
P2(3) = 3.16826710E and +3 = (+00-) : P2(4) = -3.27931884E and +3 = (-03)
- EXPLAINING THE BREAK-UP OF THE COMPUTATION OF lc3
l2 = 2.92175791E+04 4.78433864E+00 3.16826710E+00-3.27931884E-03 6.64306396E-06
lc3 = str2double(l2(P2(4)+4:P2(5)+3));
where as
lc3 = lower temp of coefficient of 2ndline data(6.64306396E-06).
l2 = 2ndline of given data of the species block.
P2 = 2ndposition of the delimiter(‘E’) in 2ndline.
(l2(P2(4)+4:P2(5)+3));
where as
P2(4) = -3.27931884E and +4 = (-03 6) : P2(5) = 6.64306396E and +3 = (-06)
- EXPLAINING THE BREAK-UP OF THE COMPUTATION OF lc4
l3 = -6.12806624E-09 2.11265971E-12 2.91222592E+04 2.05193346E+00
lc4 = str2double(l3(1:P3(1)+3));
where as
lc4 = lower temp of coefficient of 3rdline data(-6.12806624E-09).
l3 = 3rdline of given data of the species block.
P3 = 3rdposition of the delimiter(‘E’) in 3rdline.
where as
(l3(1:P3(1)+3));
1 = (-6.12806624E-09) : P3(1) = -6.12806624E and +3 = (-09)
- EXPLAINING THE BREAK-UP OF THE COMPUTATION OF lc5
l3 = -6.12806624E-09 2.11265971E-12 2.91222592E+04 2.05193346E+00
lc5 = str2double(l3(P3(1)+4:P3(2)+3));
where as
lc5 = lower temp of coefficient of 3rdline data(2.11265971E-12).
l3 = 3rdline of given data of the species block.
P3 = 3rdposition of the delimiter(‘E’) in 3rdline.
where as
(l3(P3(1)+4:P3(2)+3));
P3(1) = -6.12806624E and +4 = (-09 2) : P3(2) = 2.11265971E and +3 = (-12)
- EXPLAINING THE BREAK-UP OF THE COMPUTATION OF lc6
l3 = -6.12806624E-09 2.11265971E-12 2.91222592E+04 2.05193346E+00
lc6 = str2double(l3(P3(2)+4:P3(3)+3));
where as
lc6 = lower temp of coefficient of 3rdline data(2.91222592E+04).
l3 = 3rdline of given data of the species block.
P3 = 3rdposition of the delimiter(‘E’) in 3rdline.
where as
(l3(P3(2)+4:P3(3)+3));
P3(2) = 2.11265971E and +4 = (-12 2) : P3(3) = 2.91222592E and +3 = (+04)
- EXPLAINING THE BREAK-UP OF THE COMPUTATION OF lc7
l3 = -6.12806624E-09 2.11265971E-12 2.91222592E+04 2.05193346E+00
lc7 = str2double(l3(P3(3)+4:P3(4)+3));
where as
lc7 = lower temp of coefficient of 3rdline data(2.05193346E+00).
l3 = 3rdline of given data of the species block.
P3 = 3rdposition of the delimiter(‘E’) in 3rdline.
where as
(l3(P3(3)+4:P3(4)+3));
P3(3) = 2.91222592E and +4 = (+04 2) : P3(4) = 2.05193346E and +3 = (+00)
This process in the above as shown is computated to apply in all the 53 species block of the given data NASA Thermodynamic data.
- % Calling the specific heat function
c_p = specific_heat(hc1,hc2,hc3,hc4,hc5,lc1,lc2,lc3,lc4,lc5,R,temp,global_mid);
Cp/R = a1 + a2 T + a3 T^2 +a4 T^3 + a5 T^5
function [c_p] = specific_heat(a1,a2,a3,a4,a5,b1,b2,b3,b4,b5,R,temp,global_mid)
if temp<=global_mid
c_p = R*(a1 + a2.*temp + a3.*(temp.^2) + a4.*(temp.^3) + a5.*(temp.^4));
else
c_p = R*(b1 + b2.*temp + b3.*(temp.^2) + b4.*(temp.^3) + b5.*(temp.^4));
end
if-else command – ‘If’(condition) statement execute the code when the condition is true. If the expression is false then ‘else’ statement is execute.
It has three parts:
- If
Statement(True)
- Else
Statement(False)
- end
In this function, the first five low & high coefficient is consider as per the formulae which is mentioned[specific heat (Cp/R)],gas constant(R), temperature & global-mid temperature function. The global- mid temperature is consider whether the temperature is high & low through ‘if-else’ condition.
- % Calling the enthalpy function
H = enthalpy(hc1,hc2,hc3,hc4,hc5,hc6,lc1,lc2,lc3,lc4,lc5,lc6,R,temp,global_mid);
H/RT = a1 + a2 T/2 + a3 T^2 /3 + a4 T^3 /4 + a5 T^4 /5 + a6/T
function [H] = enthalpy(a1,a2,a3,a4,a5,a6,b1,b2,b3,b4,b5,b6,R,temp,global_mid)
if temp<=global_mid
H = R.*temp.*(a1 + a2.*(temp./2) + a3.*((temp.^2)./3) + a4.*((temp.^3)./4) + a5.*((temp.^4)./5) + a6./temp);
else
H = R.*temp.*(b1 + b2.*(temp./2) + b3.*((temp.^2)./3) + b4.*((temp.^3)./4) + b5.*((temp.^4)./5) + b6./temp);
end
In this function, the first five low & high coefficient is consider as per the formulae which is mentioned[Enthalpy H/RT)],gas constant(R), temperature & global-mid temperature function. The global- mid temperature is consider whether the temperature is high & low through ‘if-else’ condition.
- % Calling the entropy function
S = entropy(hc1,hc2,hc3,hc4,hc5,hc7,lc1,lc2,lc3,lc4,lc5,lc7,R,temp,global_mid);
S/R = a1 lnT + a2 T + a3 T^2 /2 + a4 T^3 /3 + a5 T^4 /4 + a7
function [S] = entropy(a1,a2,a3,a4,a5,a7,b1,b2,b3,b4,b5,b7,R,temp,global_mid)
if temp<=global_mid
S = R*(a1.*log(temp) + a2.*temp + a3.*(temp.^2)./2 + a4.*(temp.^3)./3 + a5.*(temp.^4)./4 +a7);
else
S = R*(b1.*log(temp) + b2.*temp + b3.*(temp.^2)./2 + b4.*(temp.^3)./3 + b5.*(temp.^4)./4 +b7);
end
In this function, the first five low & high coefficient is consider as per the formulae which is mentioned[Entropy (S/R)],gas constant(R), temperature & global-mid temperature function. The global- mid temperature is consider whether the temperature is high & low through ‘if-else’ condition.
- % Calculating the molecular weight function
function [weight] = molecular_weight(element_name)
s = {'H' 'C' 'N' 'O' 'AR'};
% atomic weight of each elements
atomic_wt = [1 12 14 16 20];
weight = 0;
for i = 1:length(element_name)
for j = 1:length(s)
if strcmp(element_name(i),s(j))
weight = weight + atomic_wt(j);
% storing the position of matched element
pos = j;
end
end
n = str2double(element_name(i));
if n>1
weight = weight + atomic_wt(pos)*(n-1);
end
end
end
sprintf - The sprintf function formats and stores a series of characters and values in the array. Any argument list is converted and put out according to the corresponding format specification.
strcmp command – The function ‘strcmp’ is used when comparing two strings for equality in Matlab. The strcmp function takes two input arguments (two strings) and returns either true or false. Strcmp will only return true if every character of both strings is the same and they are the same length. In all other cases, strcmp will return false.
This function takes the input variable as a element name. A String is created first, for the 5 basic element names and with their atomic weight function which contains atomic weight. After that they used ‘strcmp command’ to compare the name of the element name with string array. If there is repetition of an element in each species block present then ‘str2double’ is used to find that out and (n-1) is multiplied to atomic_wt of the element to calculate the molecular weight of the respective species.
- % Calling the Plotting function
plotting(c_p,H,S,temp,element_name);
function plotting(c_p,H,S,temp,element_name)
cd(pwd);
dir_name = element_name;
mkdir(dir_name);
% Plotting temperature vs specific heat
figure(1)
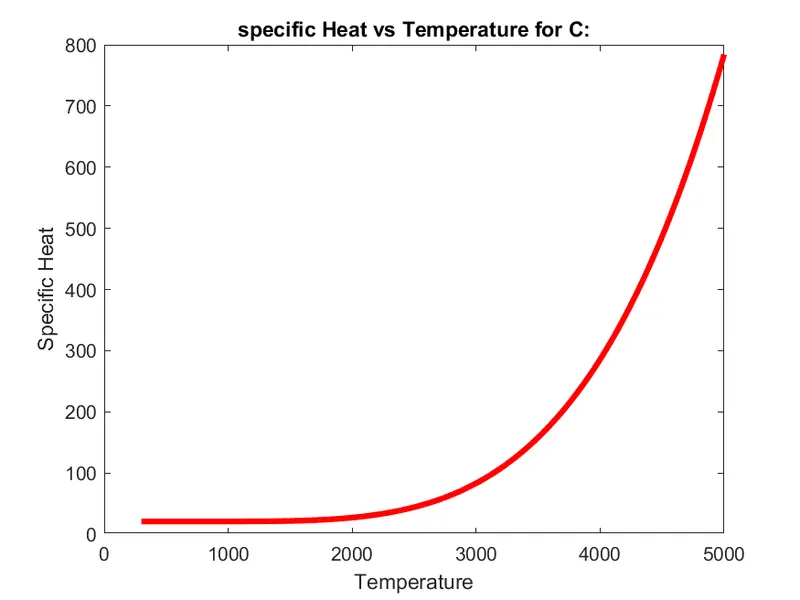
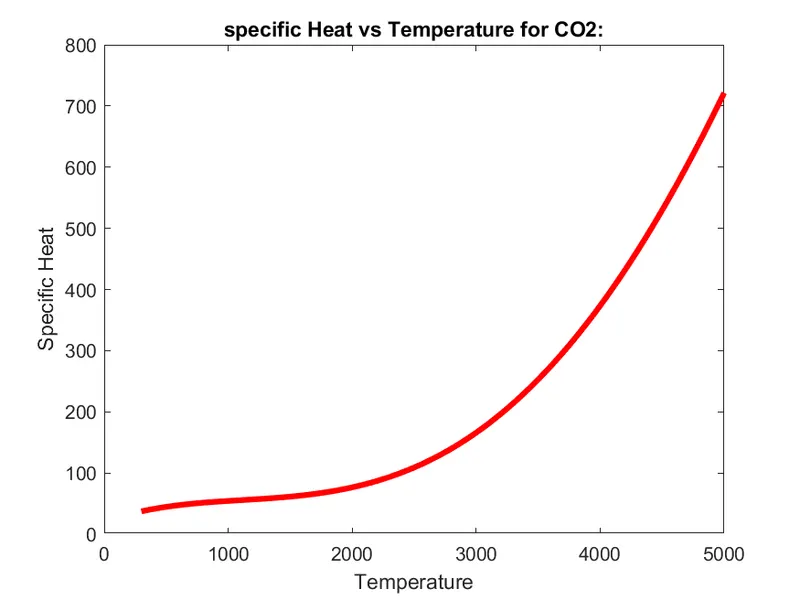
plot(temp,c_p,'LineWidth',3,'color','r');
title(sprintf('specific Heat vs Temperature for %s:',element_name));
xlabel('Temperature');
ylabel('Specific Heat');
% Plotting temperatue vs enthalpy
figure(2)
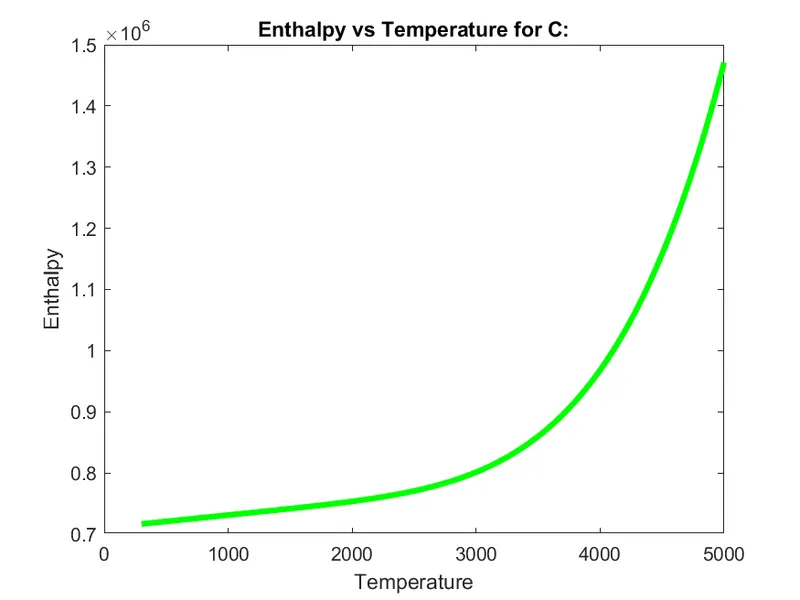
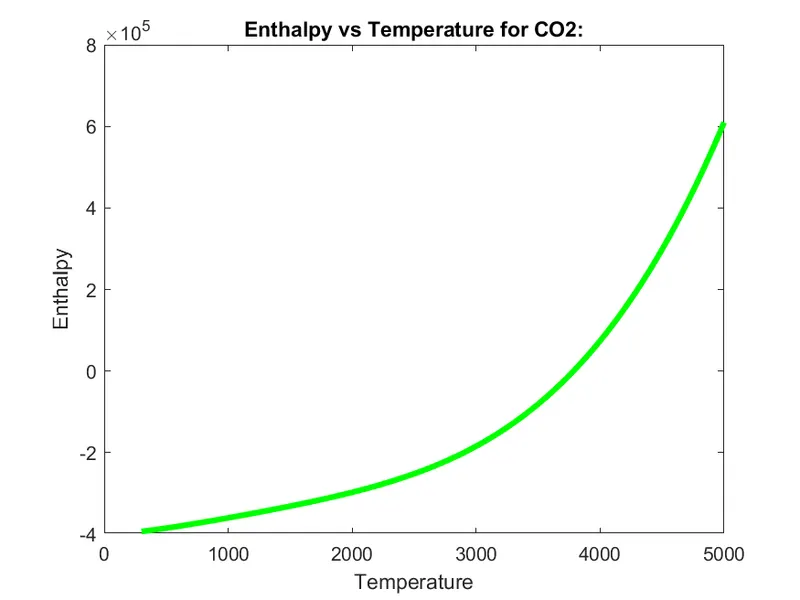
plot(temp,H,'LineWidth',3,'Color','g')
title(sprintf('Enthalpy vs Temperature for %s:',element_name));
xlabel('Temperature');
ylabel('Enthalpy');
%Plotting temperature vs entropy
figure(3)
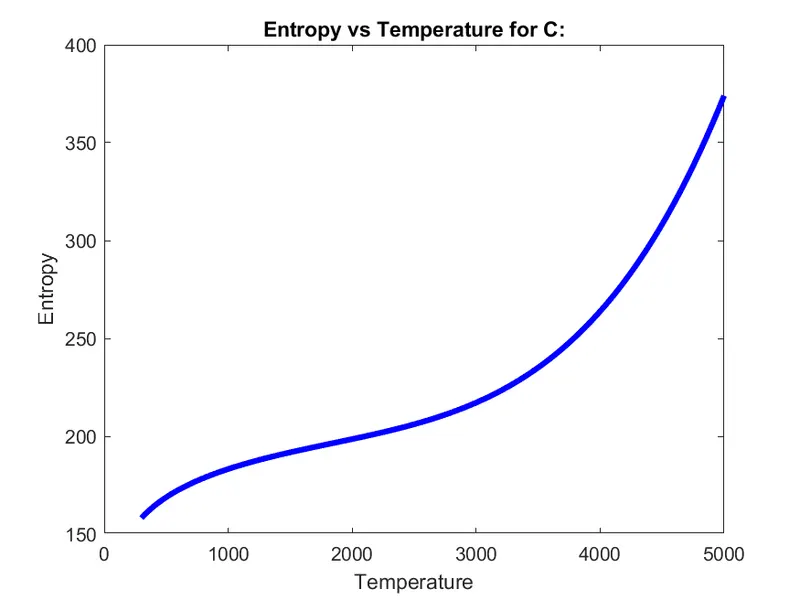
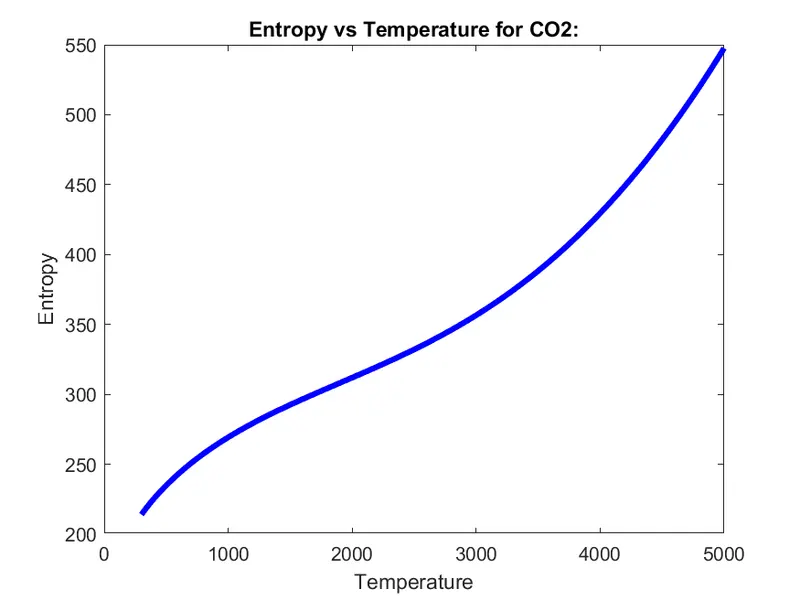
plot(temp,S,'LineWidth',3,'Color','b')
title(sprintf('Entropy vs Temperature for %s:',element_name));
xlabel('Temperature');
ylabel('Entropy');
cd(dir_name);
% To save the images captured
saveas(1,'c_p_vs_temp.png');
saveas(2,'H_vs_temp.png');
saveas(3,'S_vs_temp.png');
cd .. ;
end
- plotting(c_p,H,S,temp,element_name);
This is the graphical representation of the specific heat, enthalpy, entropy, temperature and the element name.
- function plotting(c_p,H,S,temp,element_name)
This reads the function of the specific heat, enthalpy, entropy, temperature and the element name which is executed in the matlab for plotting.
- cd(pwd);
cd - cd change the current folder.
pwd – Identify the current folder.
- dir_name = element_name;
dir – dir is the list of content.
(dir_name)list of content = (element_name) list of element name i.e [s = {'H' 'C' 'N' 'O' 'AR'};]
- mkdir(dir_name);
mkdir – mkdir makes the new folder.
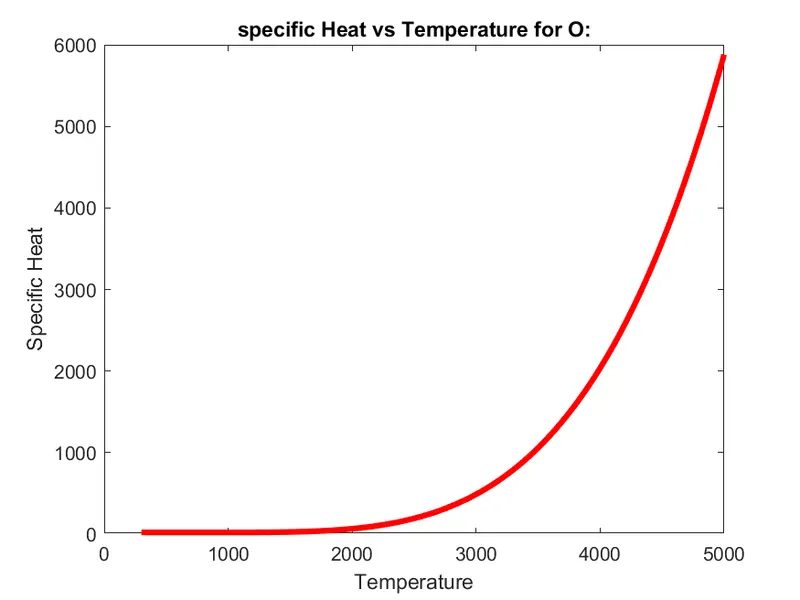
- % Plotting temperature vs specific heat
figure(1)
plot(temp,c_p,'LineWidth',3,'color','r');
title(sprintf('specific Heat vs Temperature for %s:',element_name));
xlabel('Temperature');
ylabel('Specific Heat');
figure(1)- This the first plotting graphical representation.
plot(temp,c_p,'LineWidth',3,'color','r');
- PLOT- This command is referred as the graphical representation.
- ‘temp’ – Global temperature, ‘c_p’ – specific heat
‘linewidth’ means create line thickness in the graphical representation.
‘3’ means the value in numerical.
‘r’ is the color and r represent ‘red’ color.
title(sprintf('Specific heat vs Temperature for %s:',element_name));
title - Title command is a text which can be named, values and modifies the appearance.
sprintf - The sprintf function formats and stores a series of characters and values in the array. Any argument list is converted and put out according to the corresponding format specification.
xlabel('Temperature');
X-LABEL- This command which label x-axis in the graphical representation.
ylabel('Specific heat');
Y-LABEL- This command which label y-axis in the graphical representation.
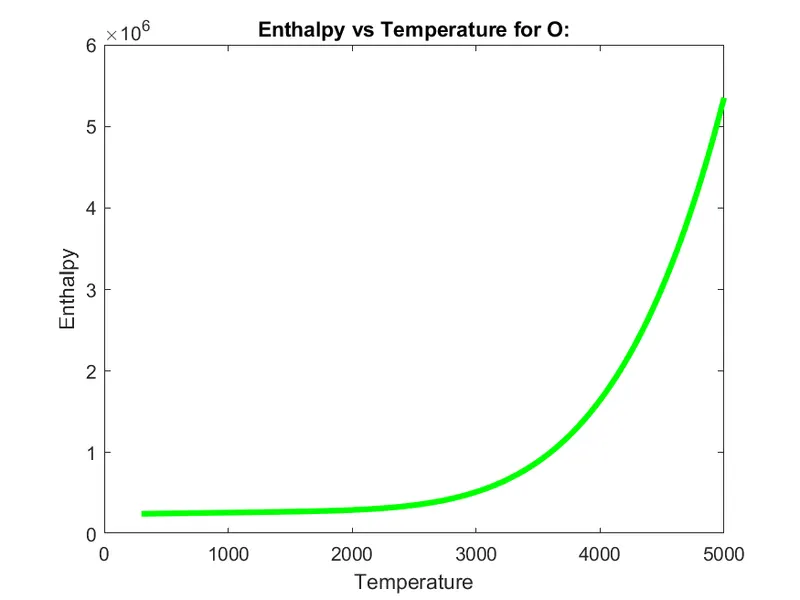
- % Plotting temperatue vs enthalpy
figure(2)
plot(temp,H,'LineWidth',3,'Color','g')
title(sprintf('Enthalpy vs Temperature for %s:',element_name));
xlabel('Temperature');
ylabel('Enthalpy');
figure(2)- This is the second plotting graphical representation.
plot(temp,H,'LineWidth',3,'color','g');
- PLOT- This command is referred as the graphical representation.
- ‘temp’ – Global temperature, ‘H’ – enthalpy
‘linewidth’ means create line thickness in the graphical representation.
‘3’ means the value in numerical.
‘g’ is the color and g represent ‘green’ color.
title(sprintf('Enthalpy vs Temperature for %s:',element_name));
title - Title command is a text which can be named, values and modifies the appearance.
sprintf - The sprintf function formats and stores a series of characters and values in the array. Any argument list is converted and put out according to the corresponding format specification in format.
xlabel('Temperature');
X-LABEL- This command which label x-axis in the graphical representation.
ylabel('Enthalpy');
Y-LABEL- This command which label y-axis in the graphical representation.
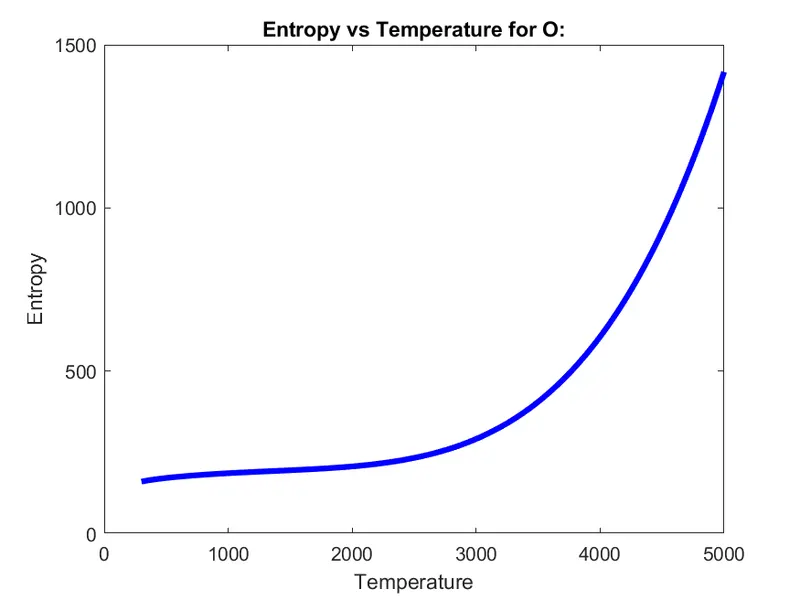
- % Plotting temperatue vs entropy
figure(3)
plot(temp,S,'LineWidth',3,'Color','b')
title(sprintf('Entropy vs Temperature for %s:',element_name));
xlabel('Temperature');
ylabel('Entropy');
figure(3)- This is the third plotting graphical representation.
plot(temp,H,'LineWidth',3,'color','b');
- PLOT- This command is referred as the graphical representation.
- ‘temp’ – Global temperature, ‘S’ - entropy
‘linewidth’ means create line thickness in the graphical representation.
‘3’ means the value in numerical.
‘b’ is the color and b represent ‘blue’ color.
title(sprintf('Entropy vs Temperature for %s:',element_name));
title - Title command is a text which can be named, values and modifies the appearance.
sprintf - The sprintf function formats and stores a series of characters and values in the array. Any argument list is converted and put out according to the corresponding format specification in format.
xlabel('Temperature');
X-LABEL- This command which label x-axis in the graphical representation.
ylabel('Entropy');
Y-LABEL- This command which label y-axis in the graphical representation.
% To save the images captured
saveas(1,'c_p_vs_temp.png');
saveas(2,'H_vs_temp.png');
saveas(3,'S_vs_temp.png');
cd .. ;
end
saveas(1,'c_p_vs_temp.png');
saveas(2,'H_vs_temp.png');
saveas(3,'S_vs_temp.png');
The saveas function is used to save an image with a specific file format, format like .png, .jpg, and many more. For using a saveas function first we want to create an image, we use a bar function or we can create an image using a plot function, both the functions are inbuilt in matlab. Then we take a file name with a figure extension, and name with extension png.
cd .. ;
This command navigate into parent dir.
end
fclose(f1)
The file need to be opened and same as it needs to close as well because the file won’t be saved on the drive and cannot be accessible at any moment, to read or write the file.
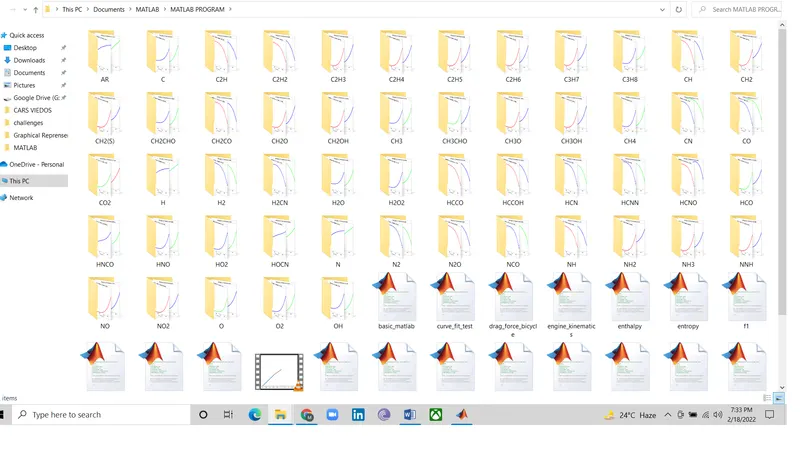
Below image showing the file location of each element of the 53 species block of given data[ NASA Thermodynamic data]
GRAPHICAL REPRESENTATION OF 'O'
GRAPHICAL REPRESENTATION OF 'C'
GRAPHICAL REPRESENTATION OF 'CO2'
COMMAND WINDOW-
O_16
O2_32
H_1
H2_2
OH_17
H2O_18
HO2_33
H2O2_34
C_12
CH_13
CH2_14
CH2(S)_14
CH3_15
CH4_16
CO_28
CO2_44
HCO_29
CH2O_30
CH2OH_31
CH3O_31
CH3OH_32
C2H_25
C2H2_26
C2H3_27
C2H4_28
C2H5_29
C2H6_30
CH2CO_42
HCCO_41
HCCOH_42
H2CN_28
HCN_27
HNO_31
N_14
NNH_29
N2O_44
NH_15
NH2_16
NH3_17
NO_30
NO2_46
HCNO_43
HOCN_43
HNCO_43
NCO_42
CN_26
HCNN_41
N2_28
AR_0
C3H8_44
C3H7_43
CH3CHO_44
CH2CHO_43
ans =
0