Week - 4
first-
Aim-
To implement control logic of a “washing machine” using State flow as per the inputs provided in power & water supply.
concept-
State-Flow: State-flow provides a graphical language that includes state transition diagrams, flow charts, state transition tables, and truth tables.
MODEL-
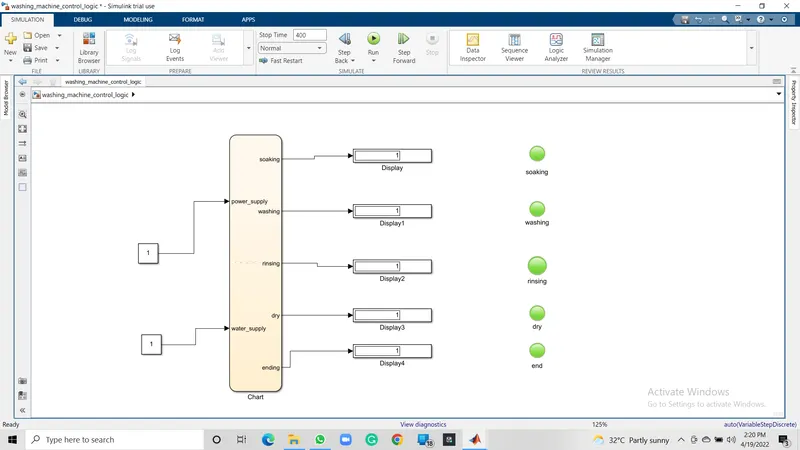
CHART-
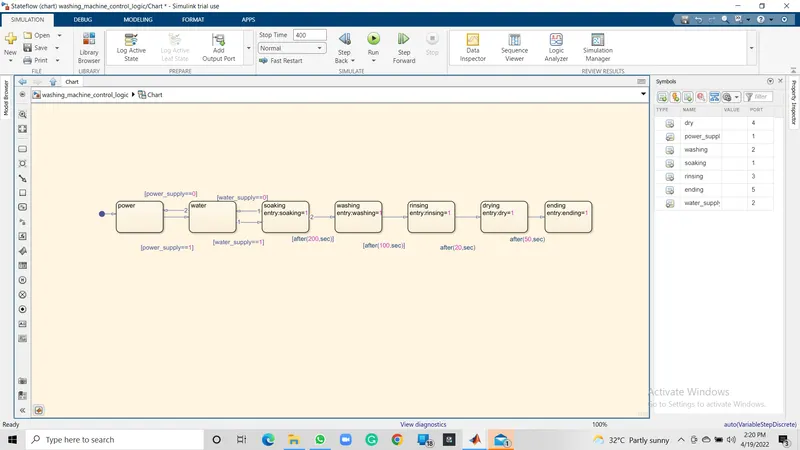
Input Conditions-
- If the power supply is available, the system gets activated
- If the Water supply is not available, stop the process & indicate through LED
- Soaking time should be 200s followed by washing time of 100s.
- Then rinsing happens for the next 20s & dryer runs for 50s
After all the processes have been completed turn on the finished LED
Steps-
- Create a chart in Simulink which satisfies all the above-mentioned conditions.
- Open the ‘Symbols panel’ and assign proper data. (i.e input or output).
- Connect LED lamps to each process and set them accordingly.
- Provide the output as a display.
- To view the output, we have provided a display block and lamps.
Values 1 & 0 are given as input which switches ON and switches OFF the supply of power and water respectively.
Input Conditions: -
Speed Range (kmph) Gear
0 to 15 1
16 to 25 2
26 to 40 3
41 to 60 4
Above 61 5
Steps:
Create a chart in Simulink which satisfies all the above-mentioned conditions.
Open the ‘Symbols panel’ and assign proper data. (i.e input or output).
Provide the output as a display and also provide a scope view of the graph.
SECOND-
AIM-
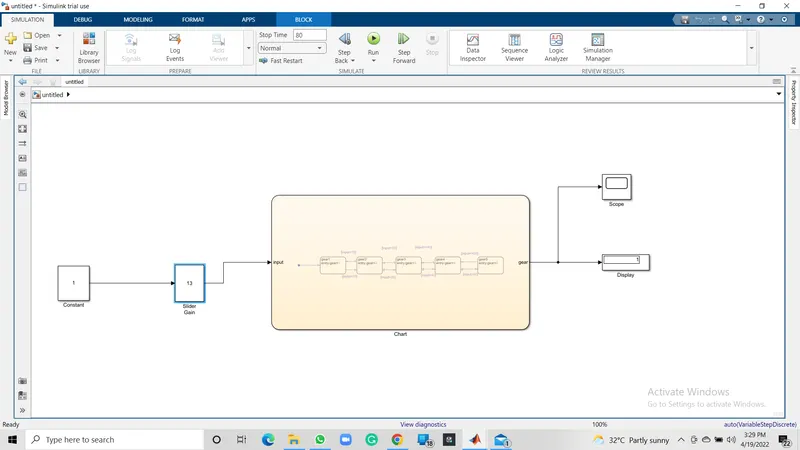
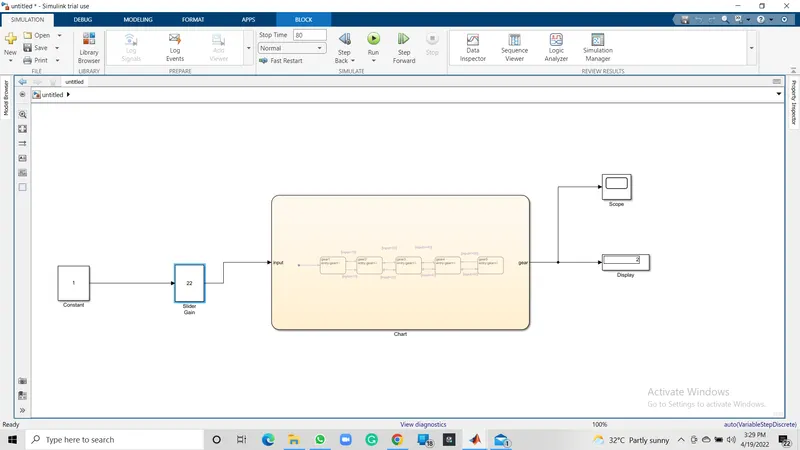
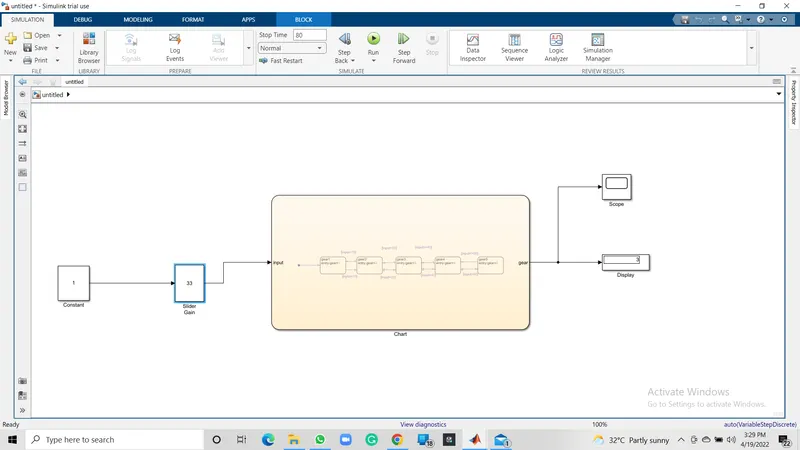
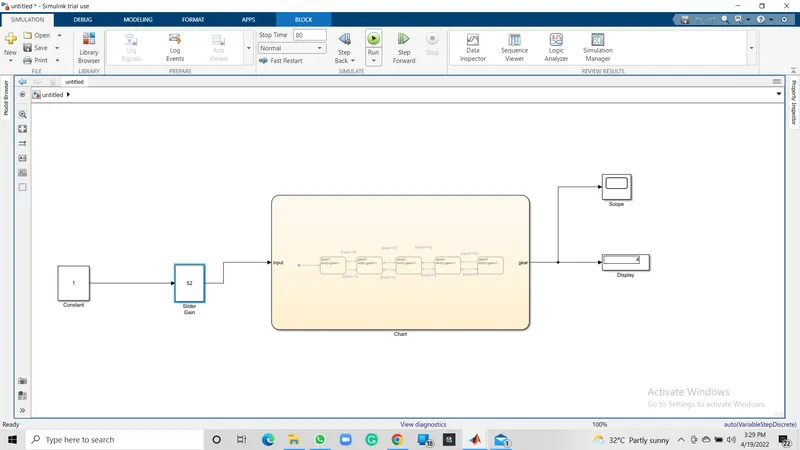
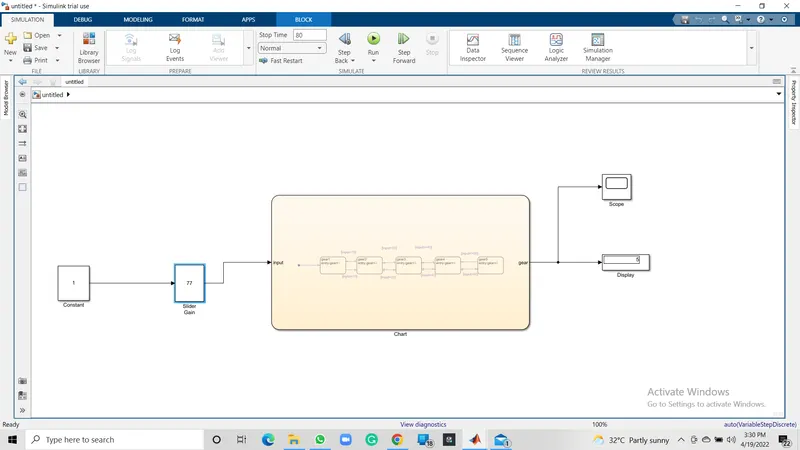
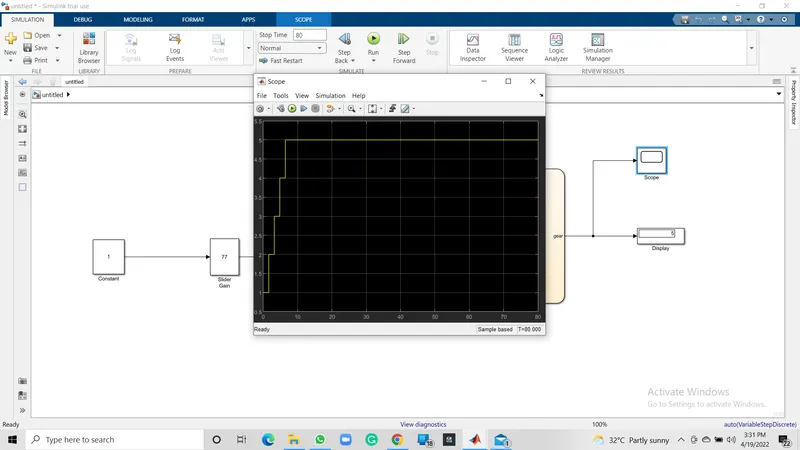
Make a Simulink chart for the “Gear shift” logic. Give speed input while the simulation is running & display the gear number.
MODEL-
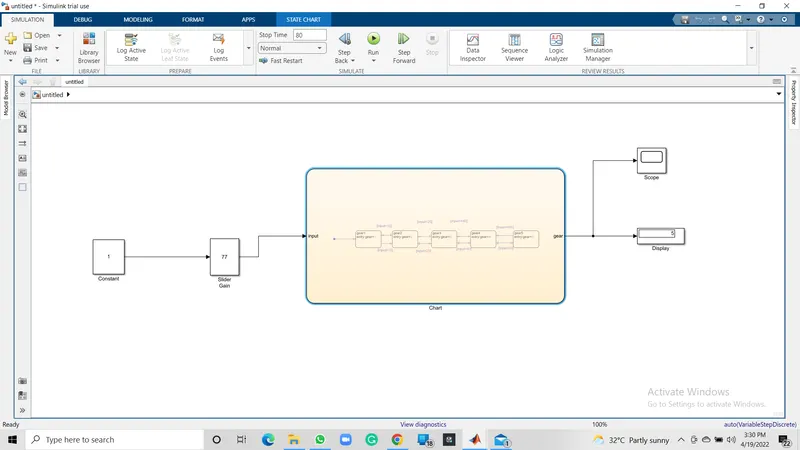
CHART-
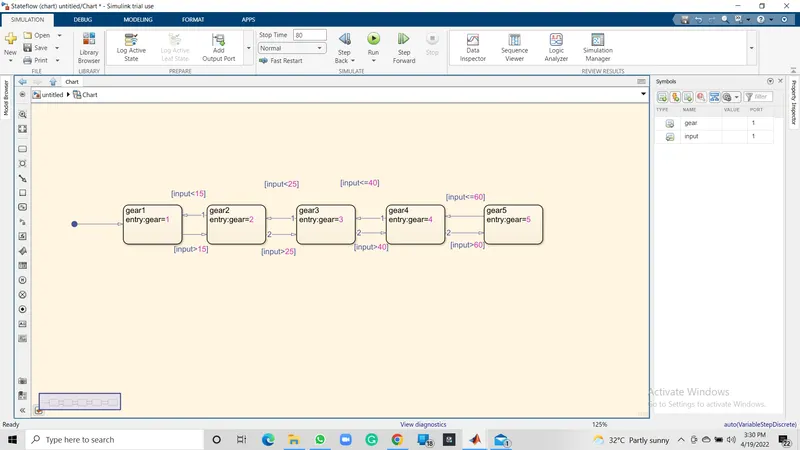
GEAR 1-
GEAR 2-
GEAR 3-
GEAR 4-
GEAR 5-
Input Conditions-
Speed Range (kmph) Gear
0 to 15 1
16 to 25 2
26 to 40 3
41 to 60 4
Above 61 5
Steps-
- Create a chart in Simulink which satisfies all the above-mentioned conditions.
- Open the ‘Symbols panel’ and assign proper data. (i.e input or output).
- Provide the output as a display and also provide a scope view of the graph.