Week - 4
AIM
- Implement control logic of a “washing machine” using Stateflow as per given sequence:
- If the power supply is available, the system gets activated
- If the Water supply is not available, stop the process & indicate through LED
- Soaking time should be 200s followed by Washing time of 100s.
- Then rinsing happens for next 20s & dryer runs for 50s
After all the processes have completed turn on the finished LED
- Make a Simulink chart for the “Gear shift” logic as per below conditions:
Speed Range(kmph) Gear
0 to 15 1
16 to 25 2
26 to 40 3
41 to 60 4
Above 61 5
Give speed input while the simulation is running & display the gear number.
ANS 1)
PROCESS:
- Start Simulink creating a blank model.
- Insert chart block in the stateflow category from library browser.
- Open the chart block and select junction feature from the stateflow window.
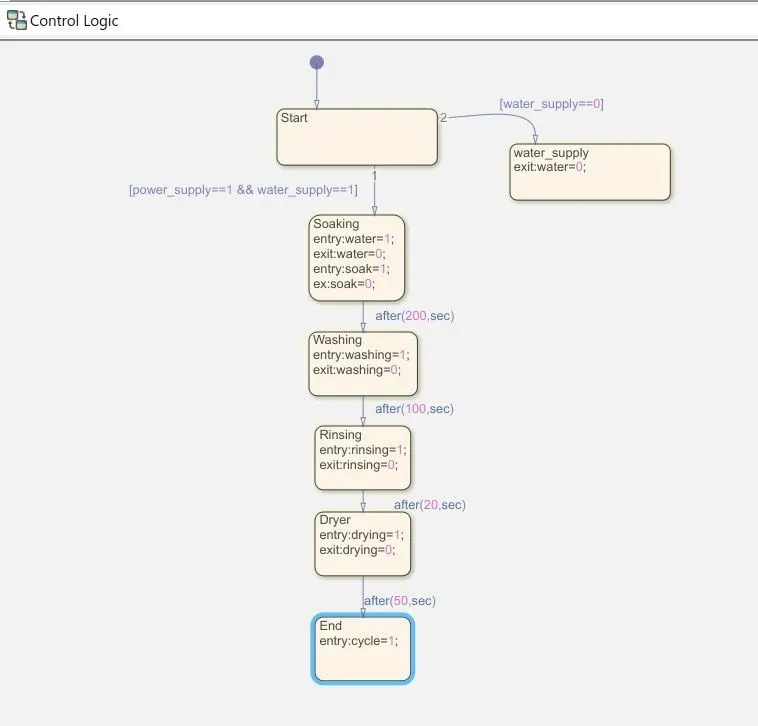
- Control logic for washing machine is as per given that it should soak the water for the first 200 seconds followed by washing time of 100 seconds. Rising the water for the next 20 seconds followed by drying time of 50 seconds.
- Finally run the stateflow and check the sequence of operation for 370 seconds.
BLOCKS USED:
- Chart: A finite state machine is a representation of an event driven system. In this system, the system reponds to an event by making a transition from one state to another. This transition occurs if the condition defining the change is true.
- Display: Shows the value of the input data.
- Constant: Generates a real or complex constant value Signal.
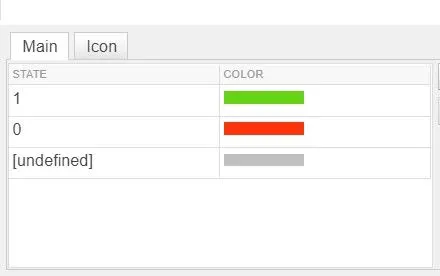
- Lamp: Displays a colour indicating the value of the input signal. You can specify pairs of input values and colours to provide the information you want during the simulation.
- Rocker Switch: It toggles the value during the simulation.
EXPLANATION:
A Rocker switch from the dashboard library is used with a constant of supply the power and as water supply. A lamp is used to indicate the power status. The power status is checked at the entry for every state and the water supply is checked for the soaking and the rinsing process. The status of the running process can be seen by the glowing lamp corresponding to the process name.
MODEL:
The file containing the model is attached below
https://drive.google.com/file/d/1YvPNmLdt63N3RVAg-JBImYacsGzsv72g/view?usp=sharing
Chart Diagram:
Parameters:
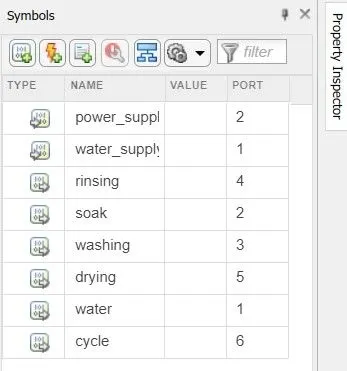
We have given ‘water’, ‘soak’, ‘washing’, ‘rinsing’, ‘dryer’, ‘cycle’ as Outputs of the chart.
We have given ‘water_supply’ & ‘Power_supply’ as Inputs of the chart.
Simulation Time Parameters:
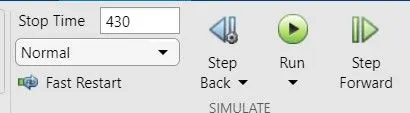
We use 430 seconds so that it can cover the whole cycle and sufficient time to store and solve the parameters.
OUTPUT:
There are 2 conditions asked to slove.
Condition 1: When water supply is OFF.
We should not provide water supply and check for output.
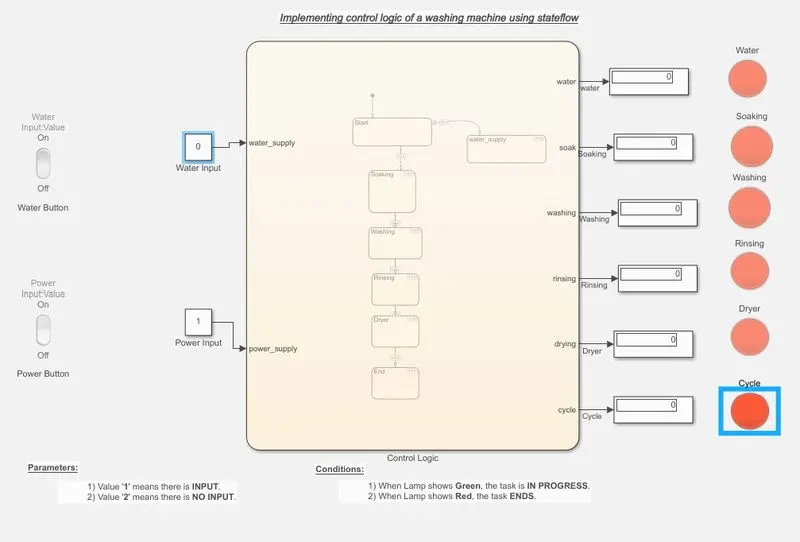
From the above, we can see that indicator of water is showing red, meaning there is no water supply the process is terminated and LED indicator is used to indicate that state.
Condition 2: When water supply is ON.
We should provide water supply and check for output.
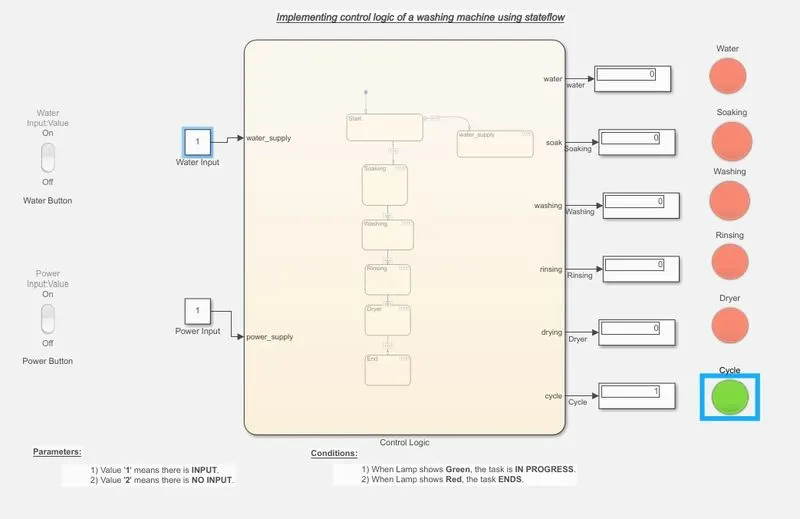
From the above, we can see that indicator of cycle is showing green, after all states are executed indicating the Process completion indicator(named as cycle).
CONCLUSION:
The simulation of the washing machine using stateflow is done and the result is satisfactory.
******************************************************************************************
ANS 2)
MODEL:
- In this model inputs are generated with help of slider gain which is connected to a constant block with value ‘0’. The gear shift is acted by conditions in stateflow. Chart is created and conditions are applied as given to provide the desired output.
- The gear is shifted by variations in speed which being an input is being represented with the name “input”. An speed range is created in chart as several gear system as per conditions.
- Display block is used to obtain the numerical value of the gear being used for the input speed value.
- Lamp is connected to indicate the 5 different colours which are assigned for each gear. The following sequence of colour is assigned for gears from neutral to top gear in ascending order.
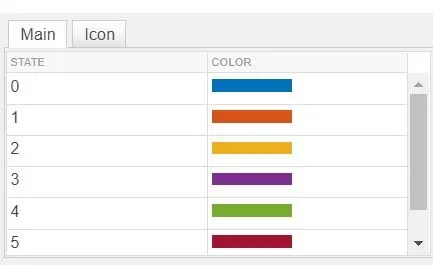
Link for model:https://drive.google.com/file/d/1r-MpBp6SQublsPrdPZMAfV4w0RizxTbH/view?usp=sharing
Chart Logic:
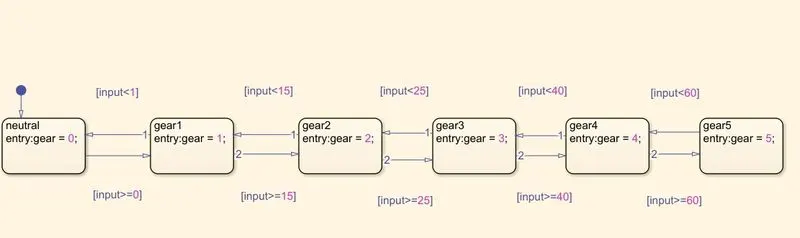
The Speed variation depends on the value that initiate in slider gain parameters. When speed range changes the output gear number will change accordingly as per conditions mentioned. Assuming that the maximum speed is only 100 units.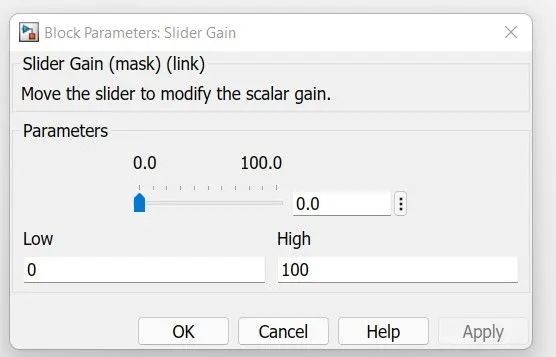
RESULT:
Gear Neutral: When speed is exactly zero(0). The output will display value ‘0’ along with the assigned colour code for the gear as shown. 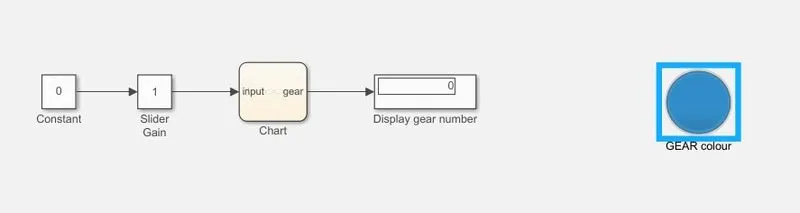
Gear 1: When speed range is 0 to 15, the output displays value ‘1’ along with the assigned colour code for the gear as shown.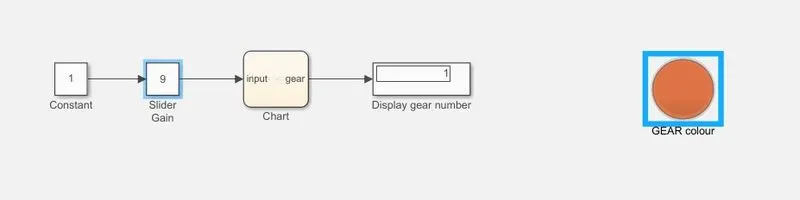
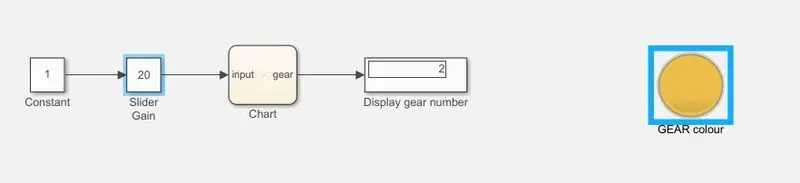
Gear 2: When speed range is 16 to 25, the output displays value ‘2’ along with the assigned colour code for the gear as shown.
Gear 3: When speed range is 26 to 40, the output displays value ‘3’ along with the assigned colour code for the gear as shown.
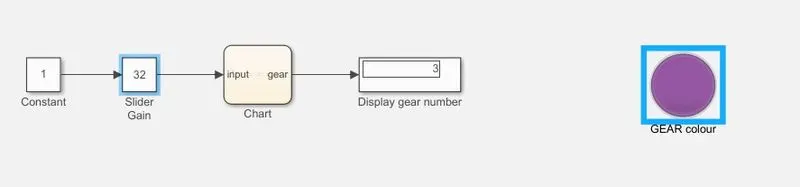
Gear 4: When speed range is 41 to 60, the output displays value ‘4’ along with the assigned colour code for the gear as shown.
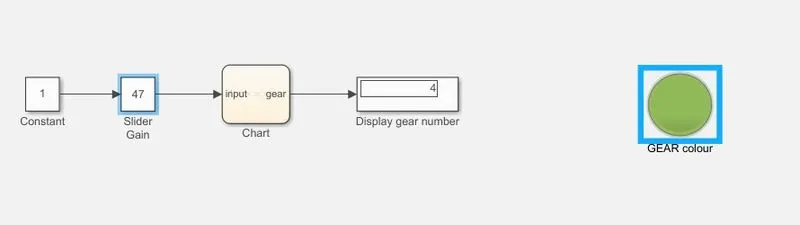
Gear 5: When speed range is above 60, the output displays value ‘5’ along with the assigned colour code for the gear as shown.

CONCLUSION: Thus the logic of the gear change can be done using the stateflow.