Project 1 - Parsing NASA thermodynamic data
Aim:
- write a code in MATLAB to parse the NASA thermodynamic data file provided.
- Write a function that extracts the 14 coefficients (File Parsing: meaning extracting the useful information from a file and utilizing that information for our program) and calculate the enthalpy, entropy and specific heats for all the species provided in the data file.
- To Calculate the molecular weight of each species and displaying it in the command window.
- Plot the Cp, Enthalpy and Entropy for the local temperature range (low temperature: high temperature) specific for each species.
- Saving the plots as images in a separate folder for each species.
Theory:
NASA came up with polynomials that can be used to evaluate thermodynamic properties such as Cp (Specific Heat), H(Enthalpy) and S(Entropy). They have also documented the efficients that are required to evaluate these polynomials for 1000+ species.
The thermodynamic properties in terms of the coefficients are given as:
- (Cp/R) = a1 + a2(T) + a3(T2) + a4(T3) + a5(T4)
- (H/RT) = a1 + a2(T/2) + a3(T2/3) + a4(T3/4) + a5(T4/5) + (a6/T)
- (S/R) = a1.lnT + a2(T) + a3(T2/2) + a4(T3/3) + a5(T4/4) + a7
Where,
- R is a universal Gas Constant = 8.314 KJ/K-mol-K,
- T is the temperature.
- Specific Heat (Cp): Defined as the amount of heat required to raise the temperature of unit mass of a substance by 1 degree.
- Enthalpy (H): It is a property of a thermodynamic system, It is the sum of system’s internal energy and the product of the pressure and volume of a thermodynamic process. It is an extensive property.
- Entropy (S): It is a thermodynamic quantity representing the unavailability of a system’s thermal energy for conversion into mechanical work, often interpreted as the degree of disorder or randomness in the system.
- The FIRST 7 coefficients are HIGH – temperature coefficients and the SECOND 7 coefficients are LOW – temperature coefficients.
#########CODE#############
close all
clear all
clc

file = fopen('Thermo.dat','r') %Opening the NASA Thermo data file provided, and reading the data
line1 = fgetl(file) % Getting the heading in the data file
line2 = fgetl(file) % Global temperatures value
comment1 = fgetl(file) % Comment line in data file (insignificant data for writing code)
comment2 = fgetl(file) % Comment line in data file (insignificant data for writing code)
comment3 = fgetl(file) % Comment line in data file (insignificant data for writing code)
A = strsplit(line2,' '); % Splitting the 2nd line of data file, to extract individual global temperature values
global_low = str2num(A{2}); % Global low temperature
global_mid = str2num(A{3}); % Global mid temperature
global_high = str2num(A{4}); % Global high temperature

R = 8.314; % Defining Universal Gas Constant

% Extracting individual species data
for i = 1:53 % total 53 individual species
    T = fgetl(file);

    % Extracting the species name
    species_name = T(1:9);
species_name = deblank(species_name); % removing blank space

    % Extracting local temperatures
    species_temp = T(49:75);
    local_values = strsplit(species_temp,' ');
    l_low_temp = str2num(local_values{1});
    l_mid_temp = str2num(local_values{3});
    l_high_temp = str2num(local_values{2});
    % storing the local temperatures in a variable
    temp = [l_low_temp l_mid_temp l_high_temp];

    temp_range = linspace(l_low_temp,l_high_temp,500);

    coeff = fgetl(file);
    coeff1 = findstr(coeff,'E');

    %extracting coefficients
    a1 = coeff(1:coeff1(1)+3);
    a1 = str2num(a1);
    a2 = coeff(coeff1(1)+4:coeff1(2)+3);
    a2 = str2num(a2);
    a3 = coeff(coeff1(2)+4:coeff1(3)+3);
    a3 = str2num(a3);
    a4 = coeff(coeff1(3)+4:coeff1(4)+3);
    a4 = str2num(a4);
    a5 = coeff(coeff1(4)+4:coeff1(5)+3);
    a5 = str2num(a5);

    new_line = fgetl(file);
    coeff2 = findstr(new_line,'E');
    a6 = new_line(1:coeff2(1)+3);
    a6 = str2num(a6);
    a7 = new_line(coeff2(1)+4:coeff2(2)+3);
    a7 = str2num(a7);
    a8 = new_line(coeff2(2)+4:coeff2(3)+3);
    a8 = str2num(a8);
    a9 = new_line(coeff2(3)+4:coeff2(4)+3);
    a9 = str2num(a9);
    a10 = new_line(coeff2(4)+4:coeff2(5)+3);
    a10 = str2num(a10);

    new_line1 = fgetl(file);
    coeff3 = findstr(new_line1,'E');
    a11 = new_line1(1:coeff3(1)+3);
    a11 = str2num(a11);
    a12 = new_line1(coeff3(1)+4:coeff3(2)+3);
    a12 = str2num(a12);
    a13 = new_line1(coeff3(2)+4:coeff3(3)+3);
    a13 = str2num(a13);
    a14 = new_line1(coeff3(3)+4:coeff3(4)+3);
    a14 = str2num(a14);

    % specific Heat calculation
    Cp = specific_heat(a1,a2,a3,a4,a5,a8,a9,a10,a11,a12,temp,temp_range,R);

    %enthalpy calculation
    H = enthalpy(a1,a2,a3,a4,a5,a6,a8,a9,a10,a11,a12,a13,temp,temp_range,R);

    %entropy calculation
    S = entropy1(a1,a2,a3,a4,a5,a7,a8,a9,a10,a11,a12,a14,temp,temp_range,R);

    %Molecular weight calculator
    m_weight = weight(species_name);

    %saving molecular weight
    species_w = fopen('species_mass.txt','w');
    fprintf(species_w,'molecular mass of %s is %f',species_name,m_weight);
    fclose(species_w);

    %plotting and saving
    cur_dir = pwd;

    % making a new folder for each species
    mkdir(species_name);
    cd(species_name);

    figure(1)
    plot(temp_range,Cp,'LineWidth',2,'Color','r')
    title(species_name);
    xlabel('Temperature in K');
    ylabel('Specific Heat in KJ/Kg-K');

    figure(2)
    plot(temp_range,H,'LineWidth',2,'Color','g')
    title(species_name);
    xlabel('Temperature in K');
    ylabel('Enthalpy in KJ/Kg');

    figure(3)
    plot(temp_range,S,'LineWidth',2,'Color','b')
    title(species_name);
    xlabel('Temperature in K');
    ylabel('Entropy in KJ/K');

    %saving the plots in seperate folder for each species
    saveas(1,'specific heat.jpg');
    saveas(2,'enthalpy.jpg');
    saveas(3,'entropy.jpg');

    cd(cur_dir);

    %printing the molecular weight of the species
    sprintf('molecular weight of %s = %f',species_name,m_weight)

end

fclose(file)
Called Function Codes:
** To Calculate Entropy
function[S] = entropy1(a1,a2,a3,a4,a5,a7,a8,a9,a10,a11,a12,a14,temp,temp_range,R)
% a1 - a7 are high temp coefficients, a8-a14 are low temp coefficients
for i = 1:length(temp_range)
    if temp_range(i)<=temp(2)
        S(i) = R*((a8*log(temp_range(i)))+(a9*(temp_range(i)))+(a10*(temp_range(i).^2)/2)+(a11*(temp_range(i).^3)/3)+(a12*((temp_range(i).^4)/4))+a14);
    else
        S(i) = R*((a1*log(temp_range(i)))+(a2*(temp_range(i)))+(a3*(temp_range(i).^2)/2)+(a4*(temp_range(i).^3)/3)+(a5*((temp_range(i).^4)/4))+a7);
    end
end
** To Calculate Enthalpy
function[H] = enthalpy(a1,a2,a3,a4,a5,a6,a8,a9,a10,a11,a12,a13,temp,temp_range,R)
% a1 - a6 are high temp coefficients, a8-a13 are low temp coefficients
for i = 1:length(temp_range)
    if temp_range(i)<=temp(2)
        H(i) = R*((a8*temp_range(i))+(a9*((temp_range(i).^2)/2))+(a10*(temp_range(i).^3)/3)+(a11*(temp_range(i).^4)/4)+(a12*((temp_range(i).^5)/5))+a13);
    else
        H(i) = R*((a1*temp_range(i))+(a2*((temp_range(i).^2)/2))+(a3*(temp_range(i).^3)/3)+(a4*(temp_range(i).^4)/4)+(a5*((temp_range(i).^5)/5))+a6);
    end
end
** To Calculate Specific Heat
function[Cp] = specific_heat(a1,a2,a3,a4,a5,a8,a9,a10,a11,a12,temp,temp_range,R)
% a1 - a5 are high temp coefficients, a8-a12 are low temp coefficients
for i = 1:length(temp_range)
    if temp_range(i)<=temp(2)
        Cp(i) = R*(a8+(a9*temp_range(i))+(a10*(temp_range(i).^2))+(a11*(temp_range(i).^3))+(a12*(temp_range(i).^4)));
    else
        Cp(i) = R*(a1+(a2*temp_range(i))+(a3*(temp_range(i).^2))+(a4*(temp_range(i).^3))+(a5*(temp_range(i).^4)));

    end
end
** To Calculate Molecular Weight
function [m_weight] = weight(species_name)
species = (species_name);
elements ={'H','O','N','Ar','C','S'};
atomic_weight = [1,16,14,39,12,32]; % Assigning atomic weight for each array element of a species
m_weight = 0; % Initialising value for M
for i = 1:length(species)
    for j = 1:length(elements)
        if strcmp(species_name(i),elements(j)) % Compares the species name with species array
            m_weight = m_weight+atomic_weight(j);
            x = j;
        end
    end
    n = str2num(species_name(i)); % Extracts the numbers present in the species name
    if n>1
        m_weight = m_weight+(atomic_weight(x)*(n-1)); % To add the representative elements of the species with the weight
    end
end
end
OUTPUT:
- The molecular weights of all 53 elements are printed in the command window. A sample for reference for few elements is given below.
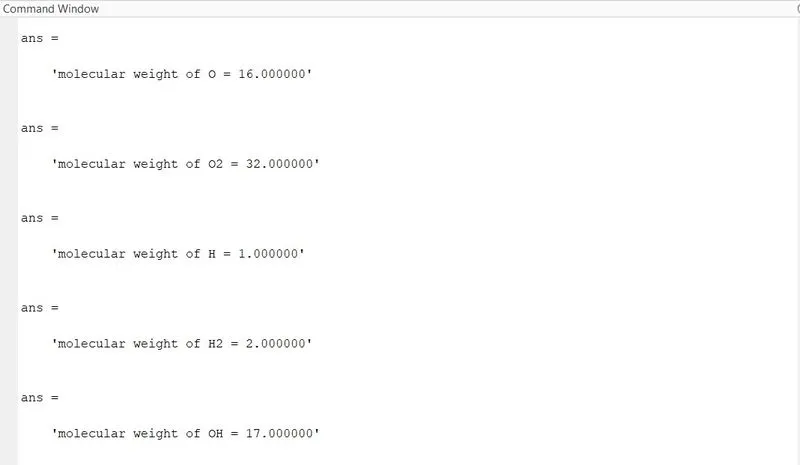
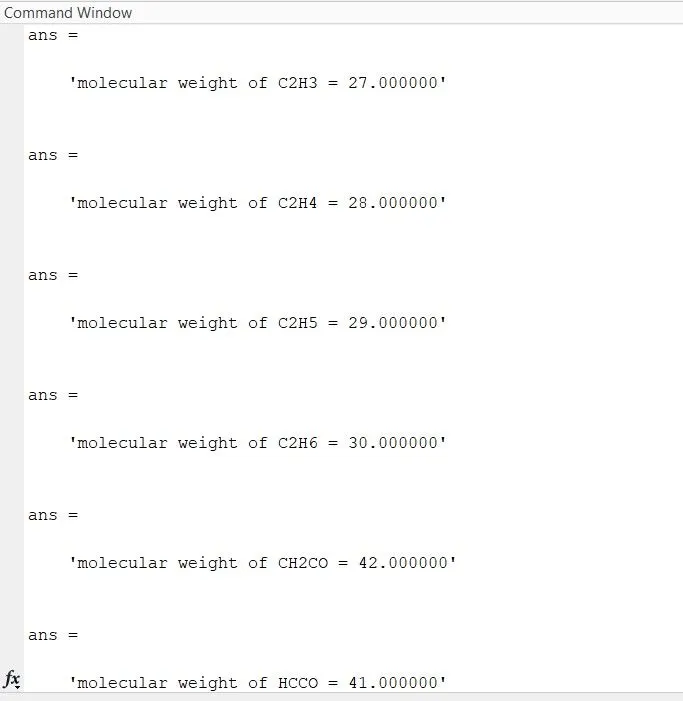
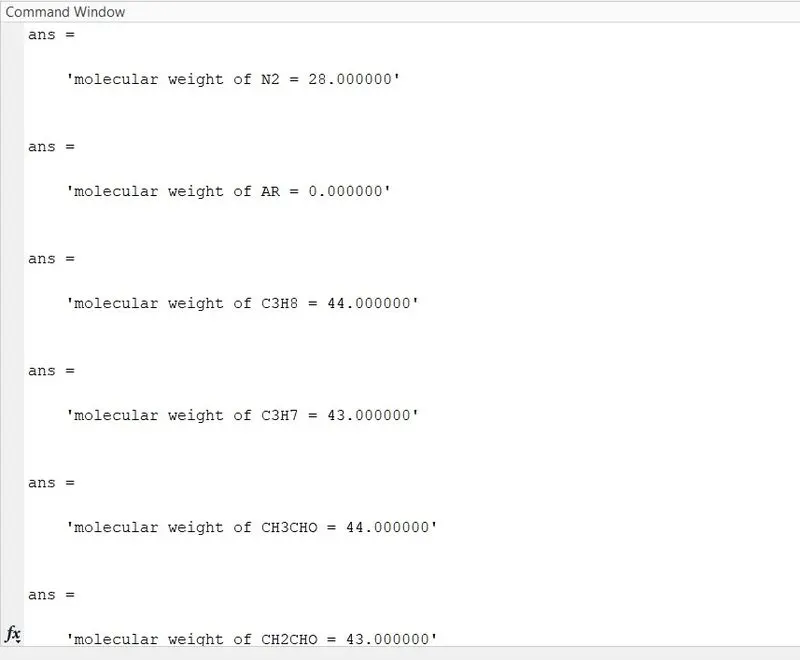
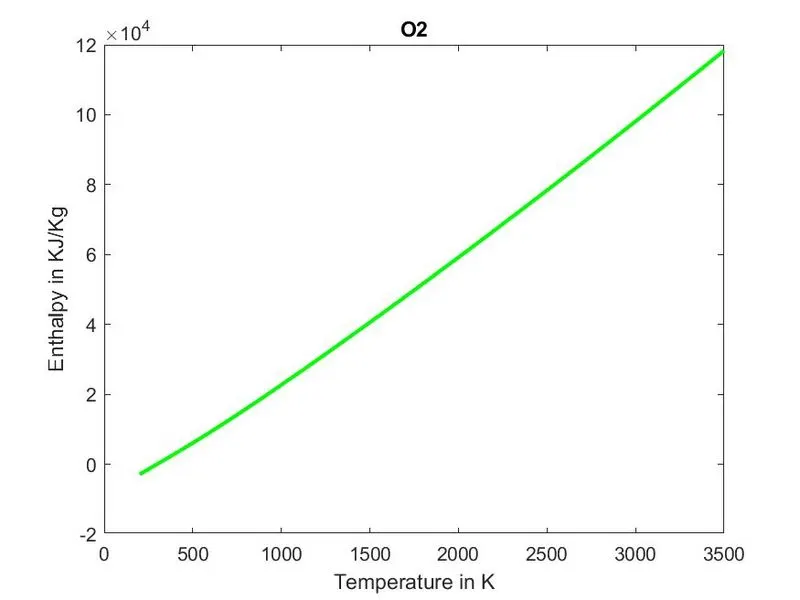
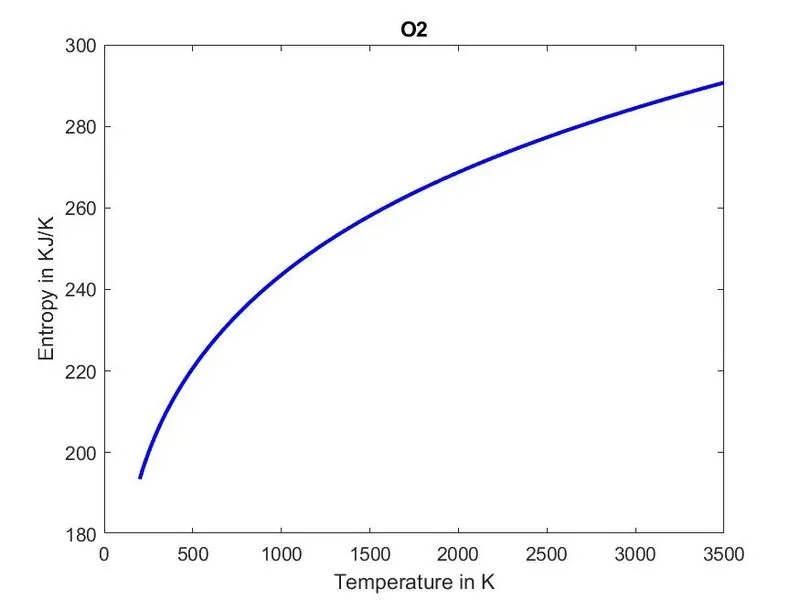
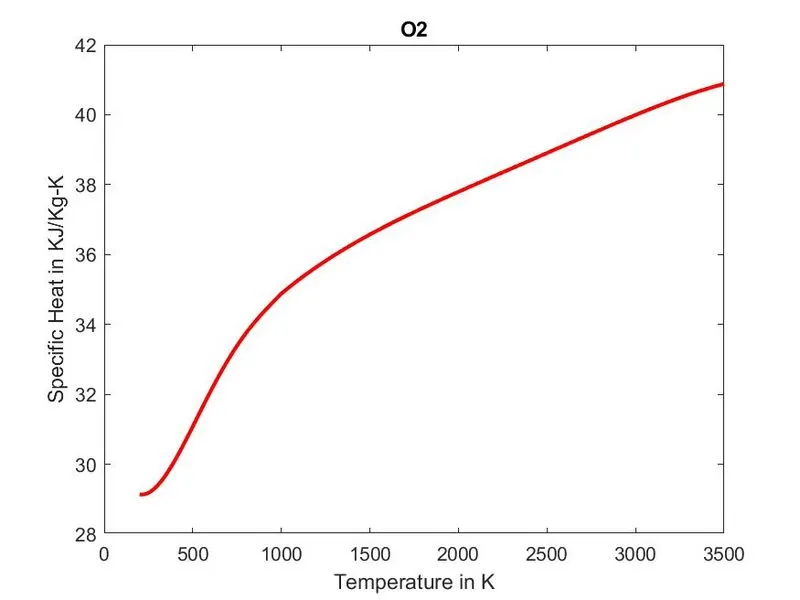
- Plots of O2 in order(i) Enthalpy vs Temperature (ii) Entropy vs temperature (iii) Specific Heat vs Temperature.
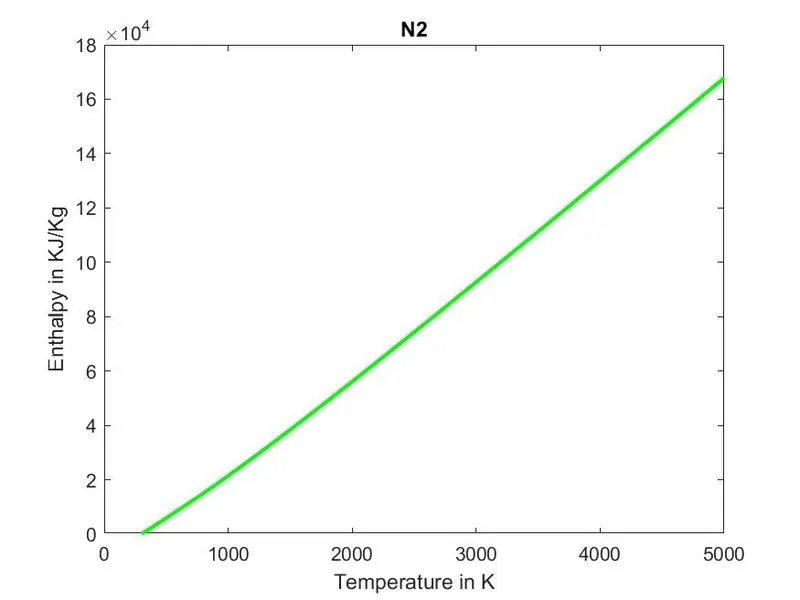
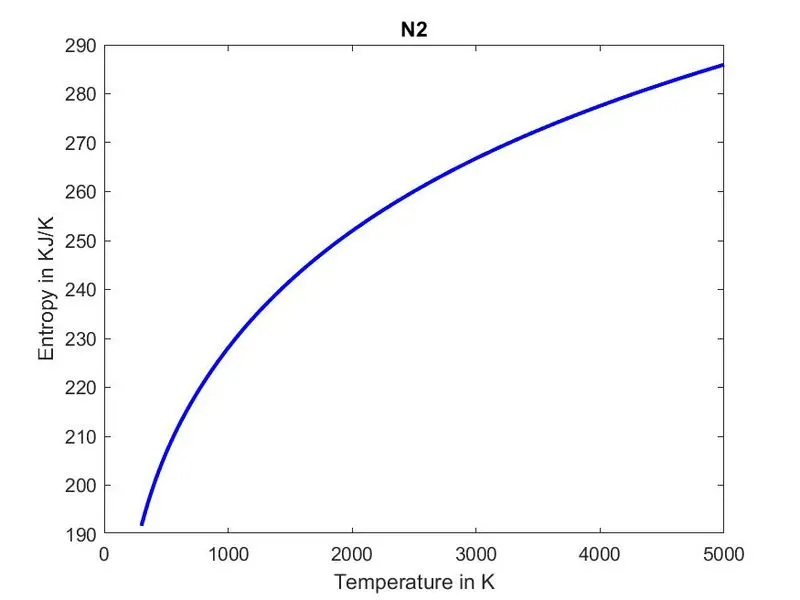
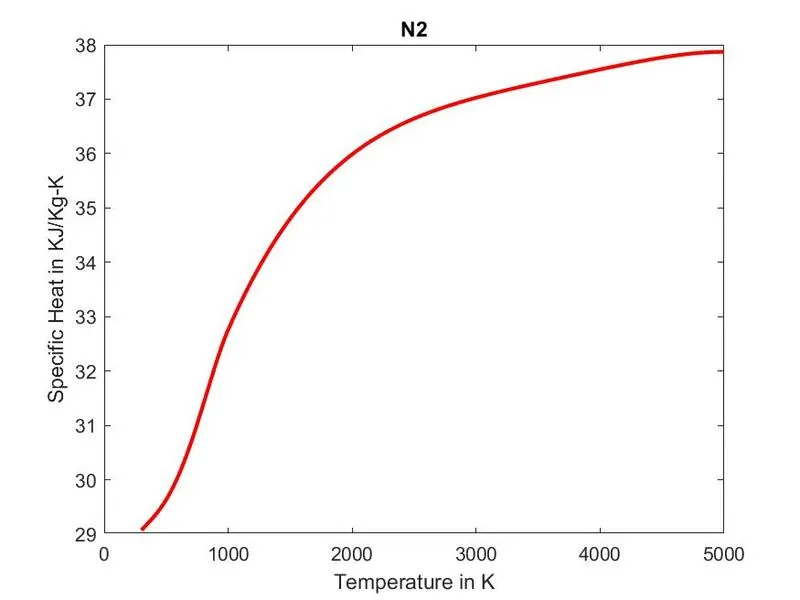
- Plots of N2 in order(i) Enthalpy vs Temperature (ii) Entropy vs temperature (iii) Specific Heat vs Temperature.
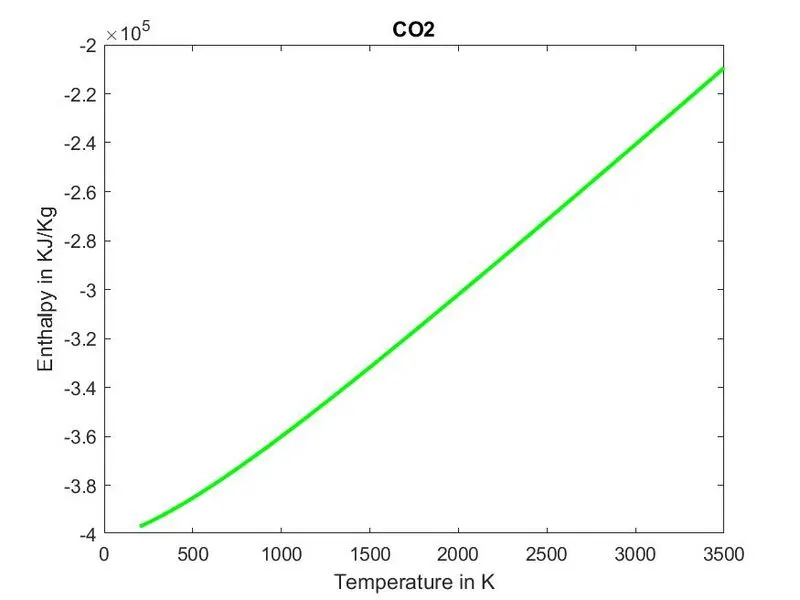
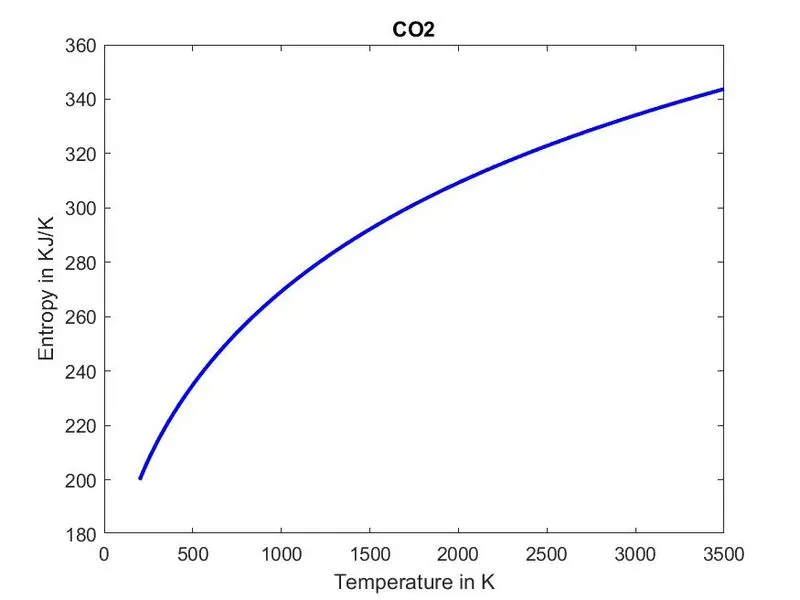
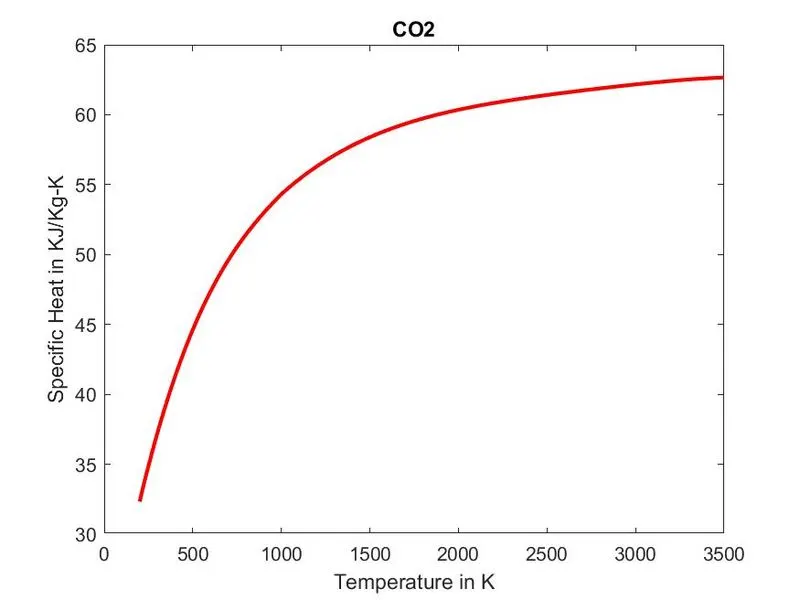
- Plots of CO2 in order(i) Enthalpy vs Temperature (ii) Entropy vs temperature (iii) Specific Heat vs Temperature.
- Screenshot of all folders generated and saved in one location in a single folder is as shown below:

Explanation of Algorithm:
- The beginning of program is written with commands clear all, close all and clc commands to free up the command window and the workspace.
- Now, we will read the data from the external NASA thermodynamic file “Thermo.dat” using the commands fopen and fgetl.
- The useful header information will be extracted from the file such as global temperature limits.
- Following by extracting the individual species data of all the species present in the file using the command fgetl, to read the file line by line and skipping the lines not useful for calculation.
- For loop is used for extracting the data of the species mentioned in the file which are: 14 coefficients(7 for higher temperature and rest for lower temperature), Species name and the local temperature limits.
- Calculation of Cp, H, S and molecular weight will be done in separate function files and will be called in the main program.
- For all species plots for (i) specific heat v/s temperature, (ii) enthalpy v/s temperature and (iii) entropy v/s temperature, are generated and saved in seperate folders for each element.
- Lastly molecular weight of all species are displayed in the command window
References: